What is exploratory data analysis?
Exploratory Data Analysis in Power BI

Jacob H. Marquez
Data Scientist at Microsoft
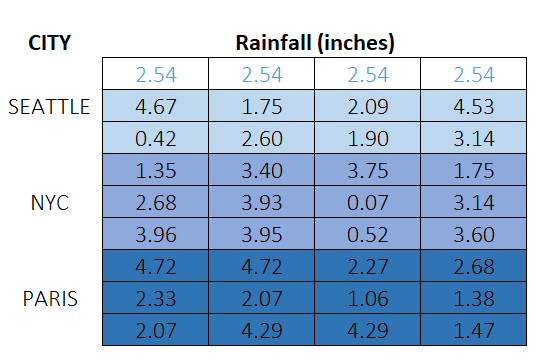
2. Identifying missing data
Missing at random
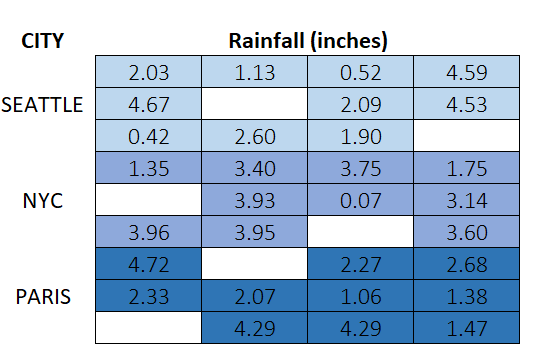
Missing not at random
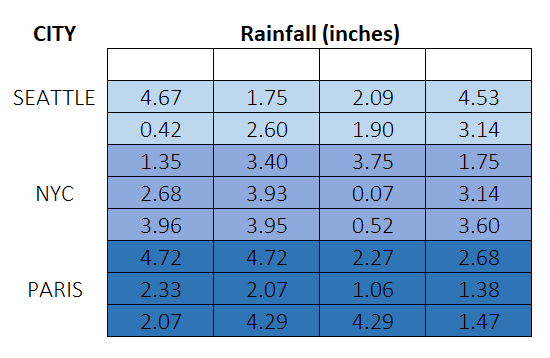
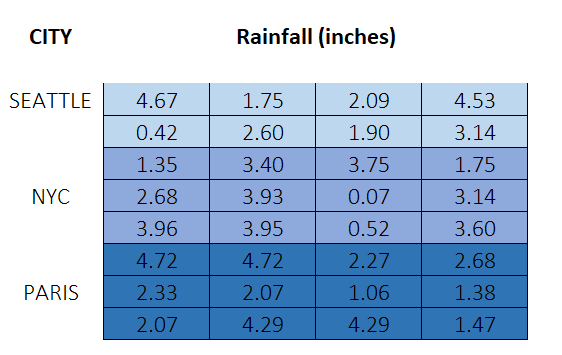
2. Addressing missing data
3. Describe the data with distributions.
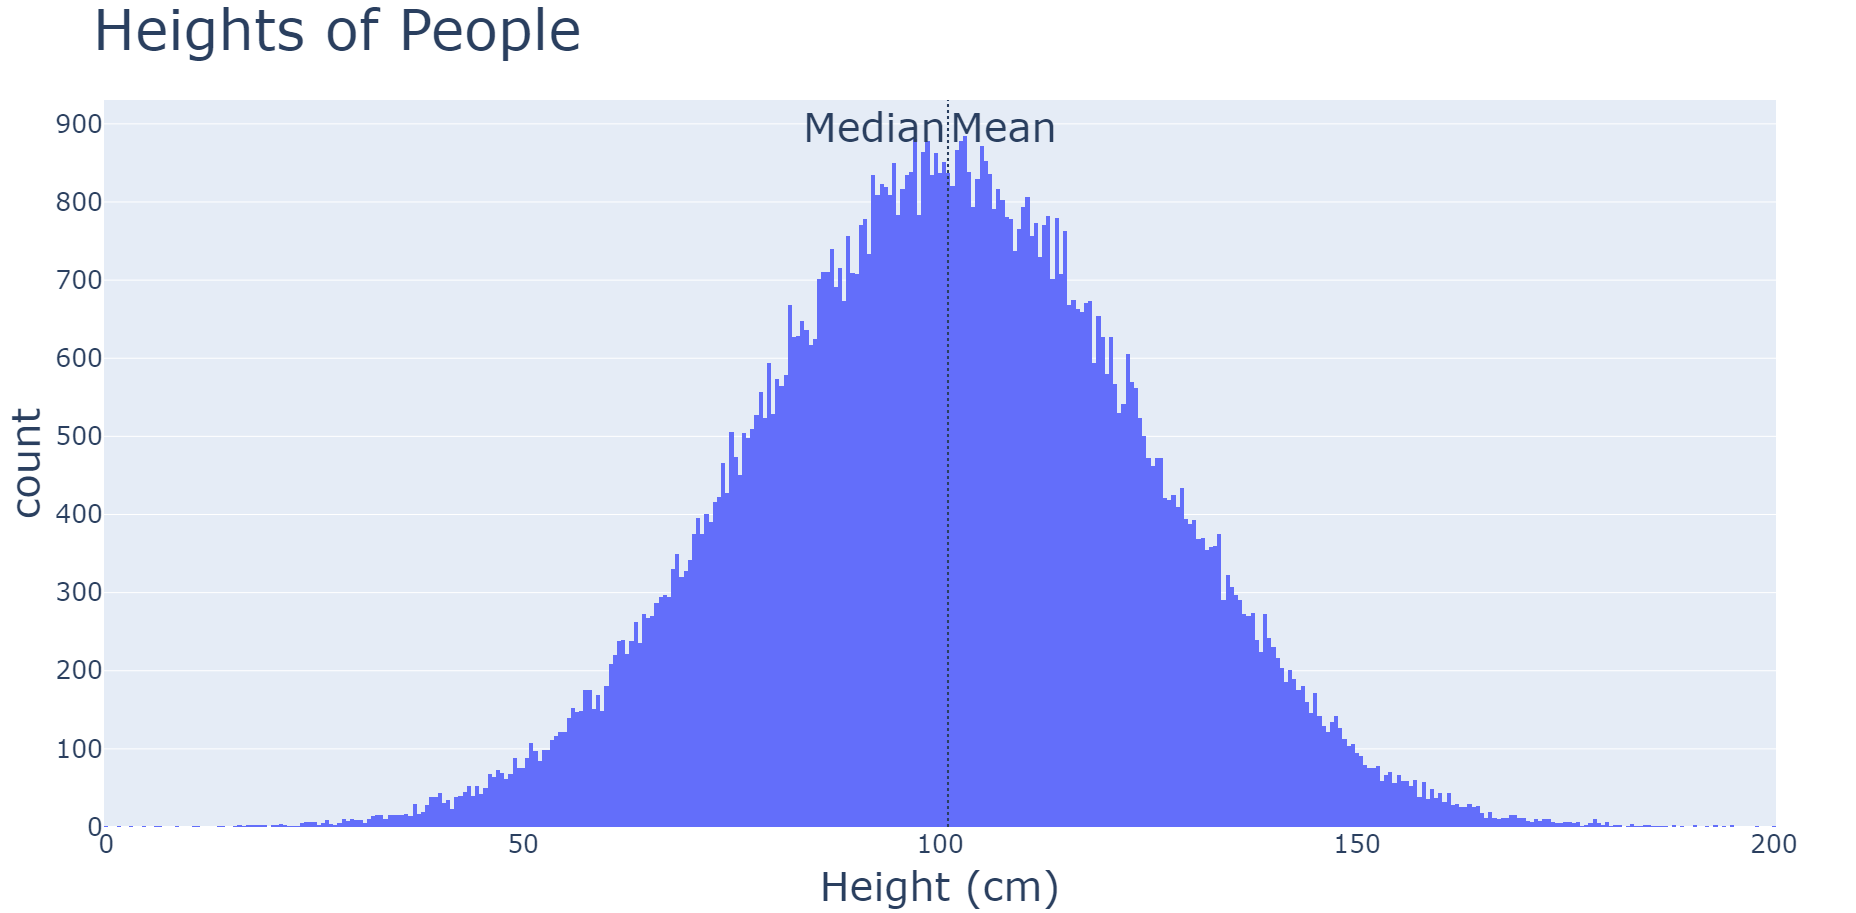
- Median and the mean are the same value
- A symmetrical curve
3. Describing the data with distributions
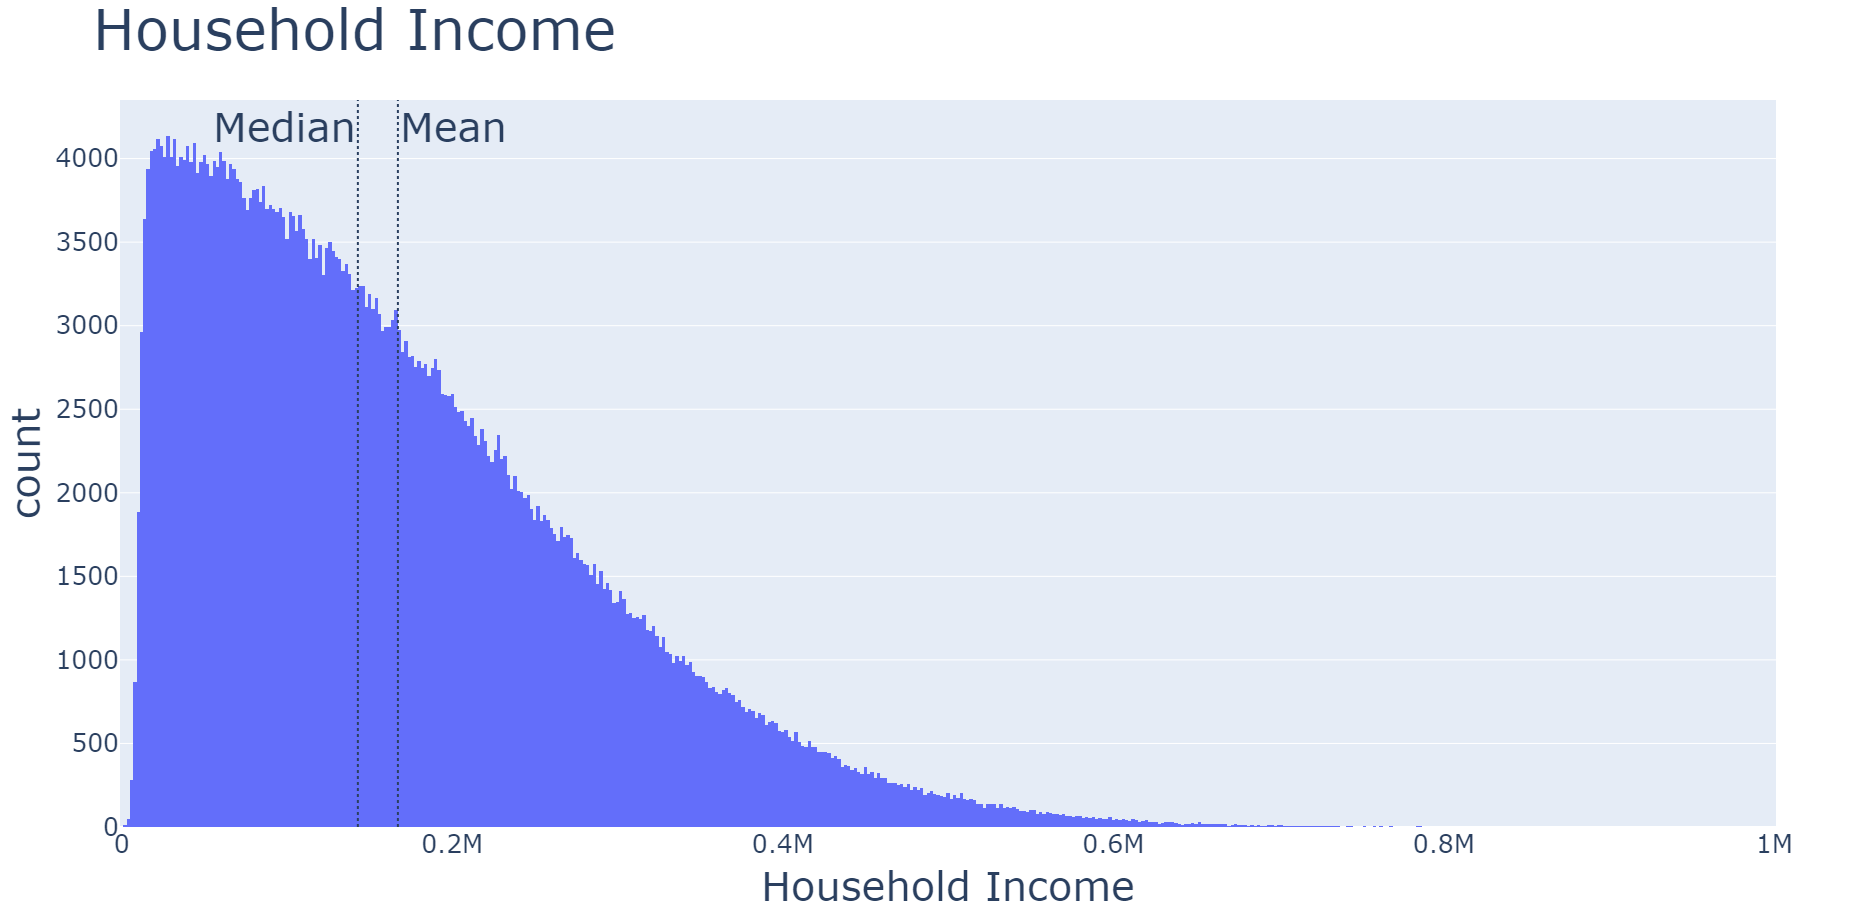
- Median < Mean
- "Right-skewed": the tail is to the right
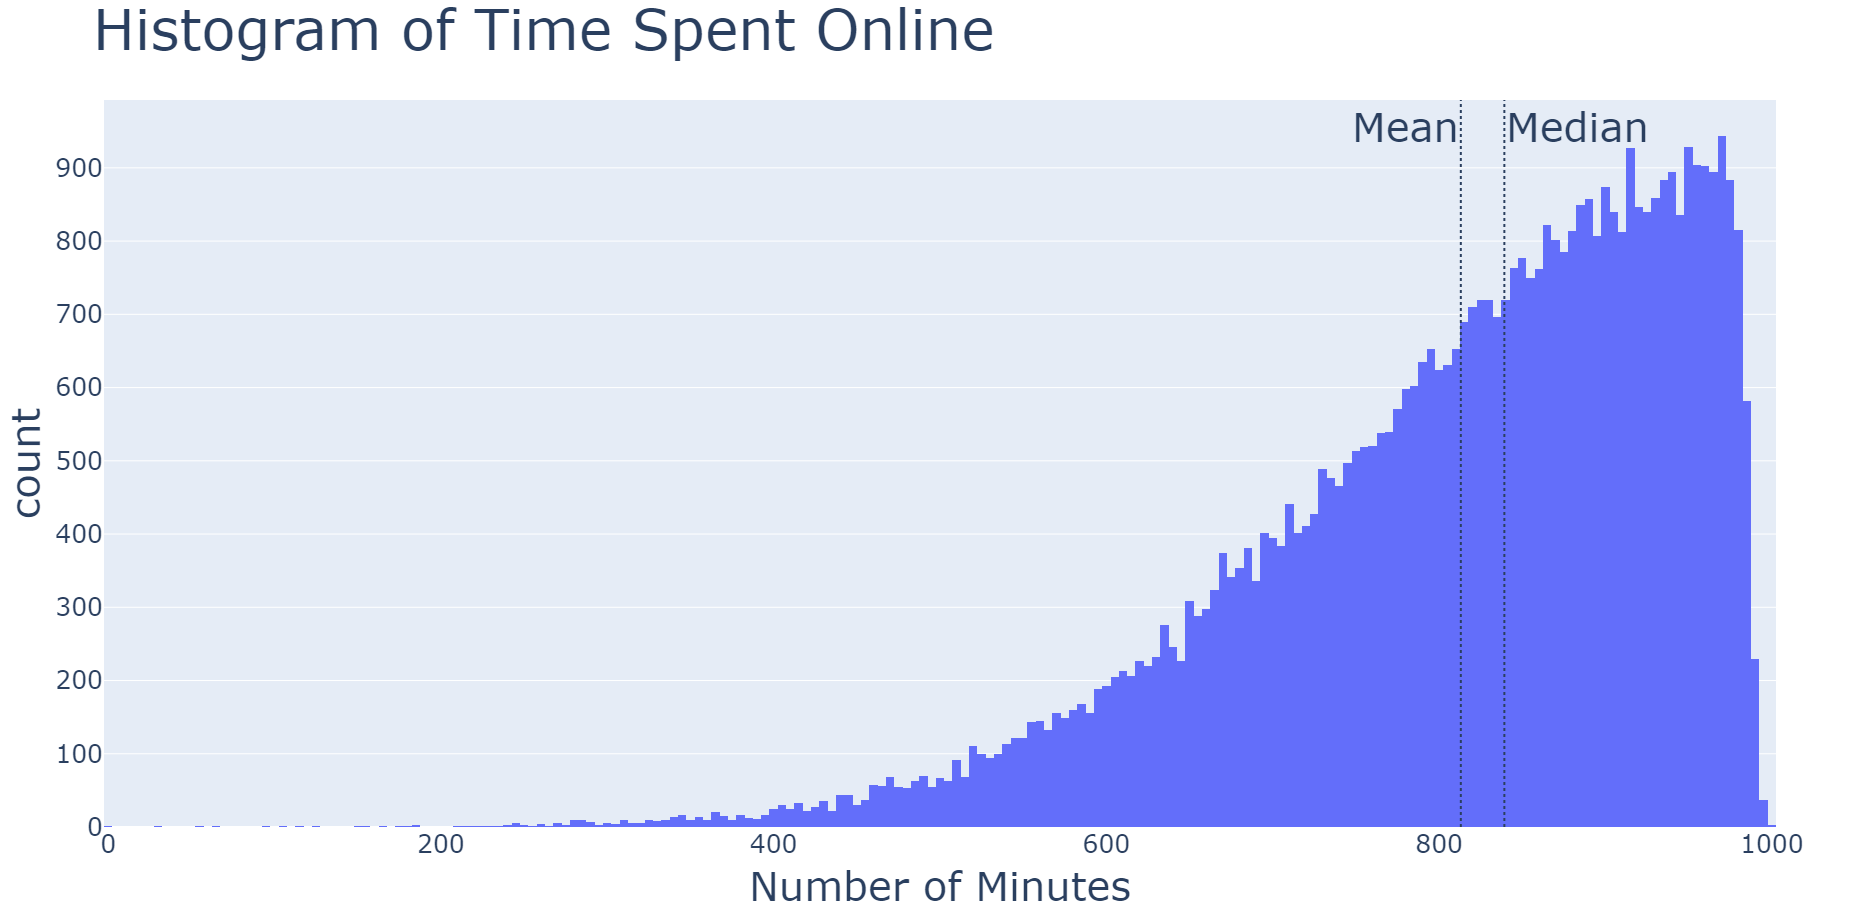
- Median > Mean
- "Left-skewed": the tail is to the left
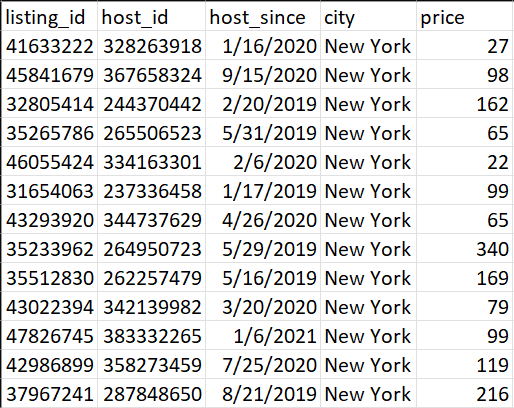
The dataset: AirBnB listings