Building visualizations with Seaborn
Introduction to Python in Power BI

Jacob H. Marquez
Data Scientist
Plots with the Seaborn package
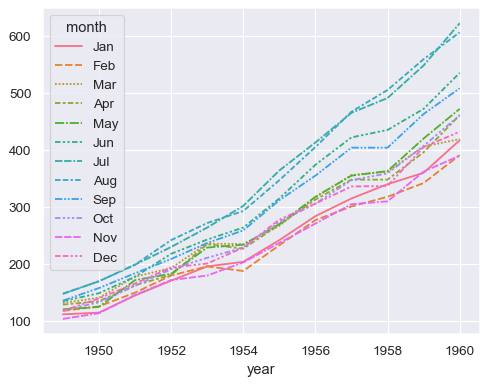
1 https://seaborn.pydata.org/generated/seaborn.lineplot.html
Plots with the Seaborn package
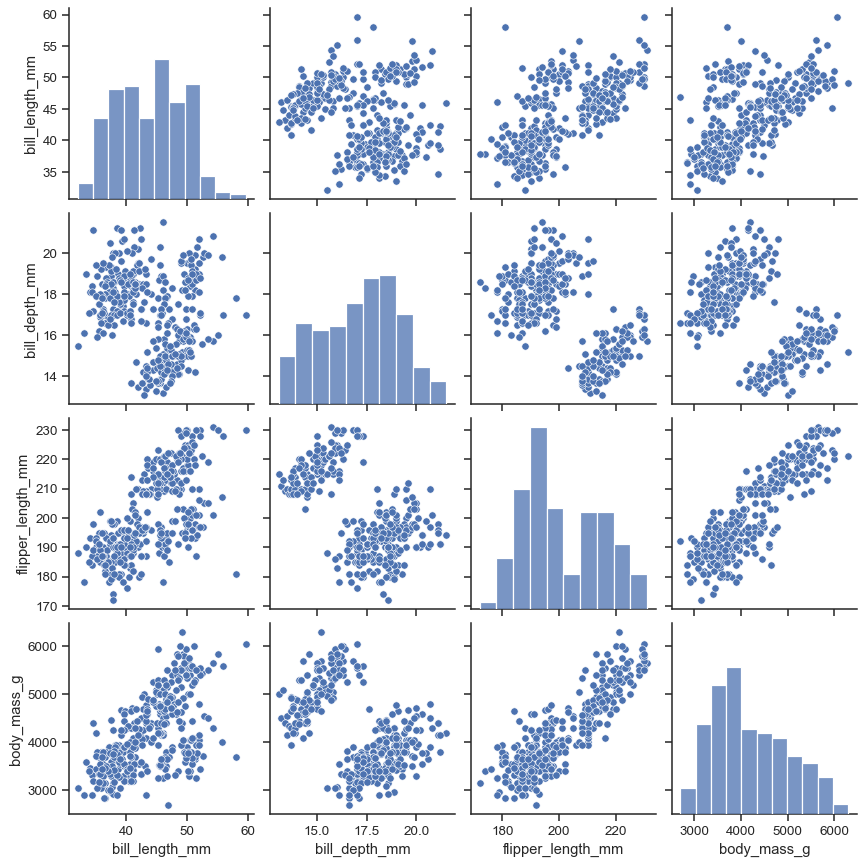
1 https://seaborn.pydata.org/generated/seaborn.pairplot.html
Plots with the Seaborn package
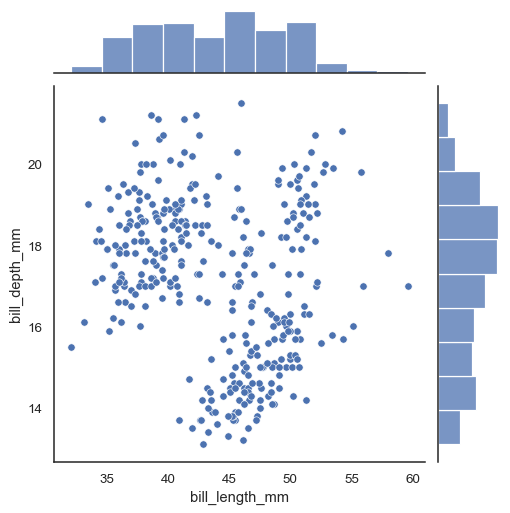
1 https://seaborn.pydata.org/generated/seaborn.jointplot.html
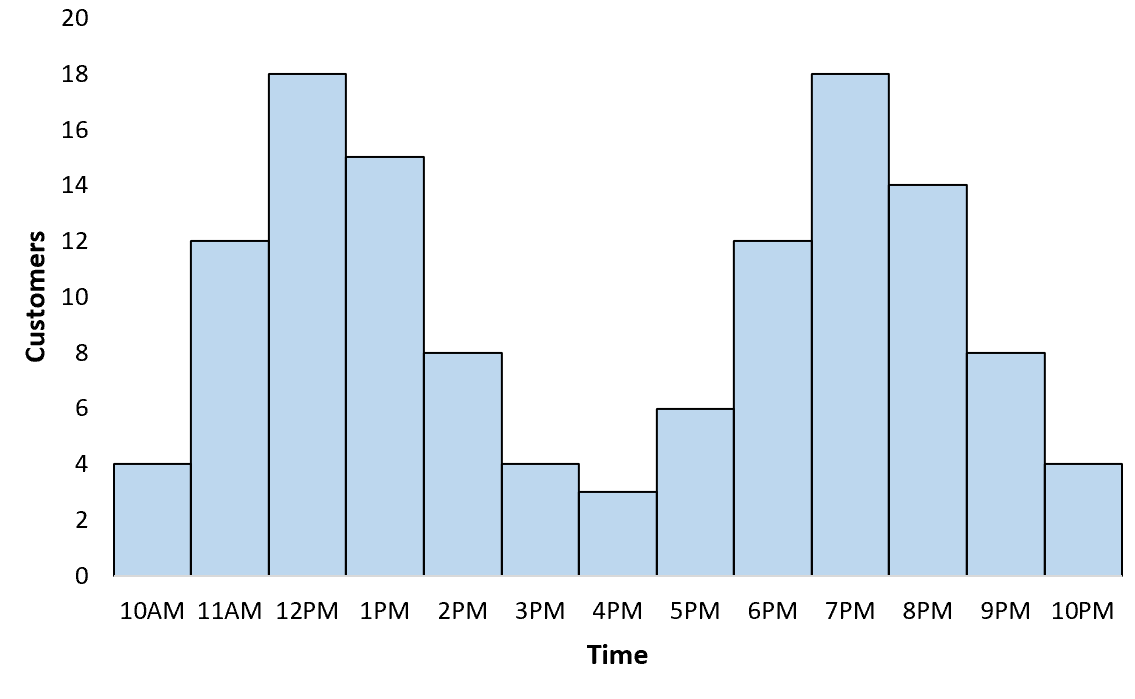
Histograms
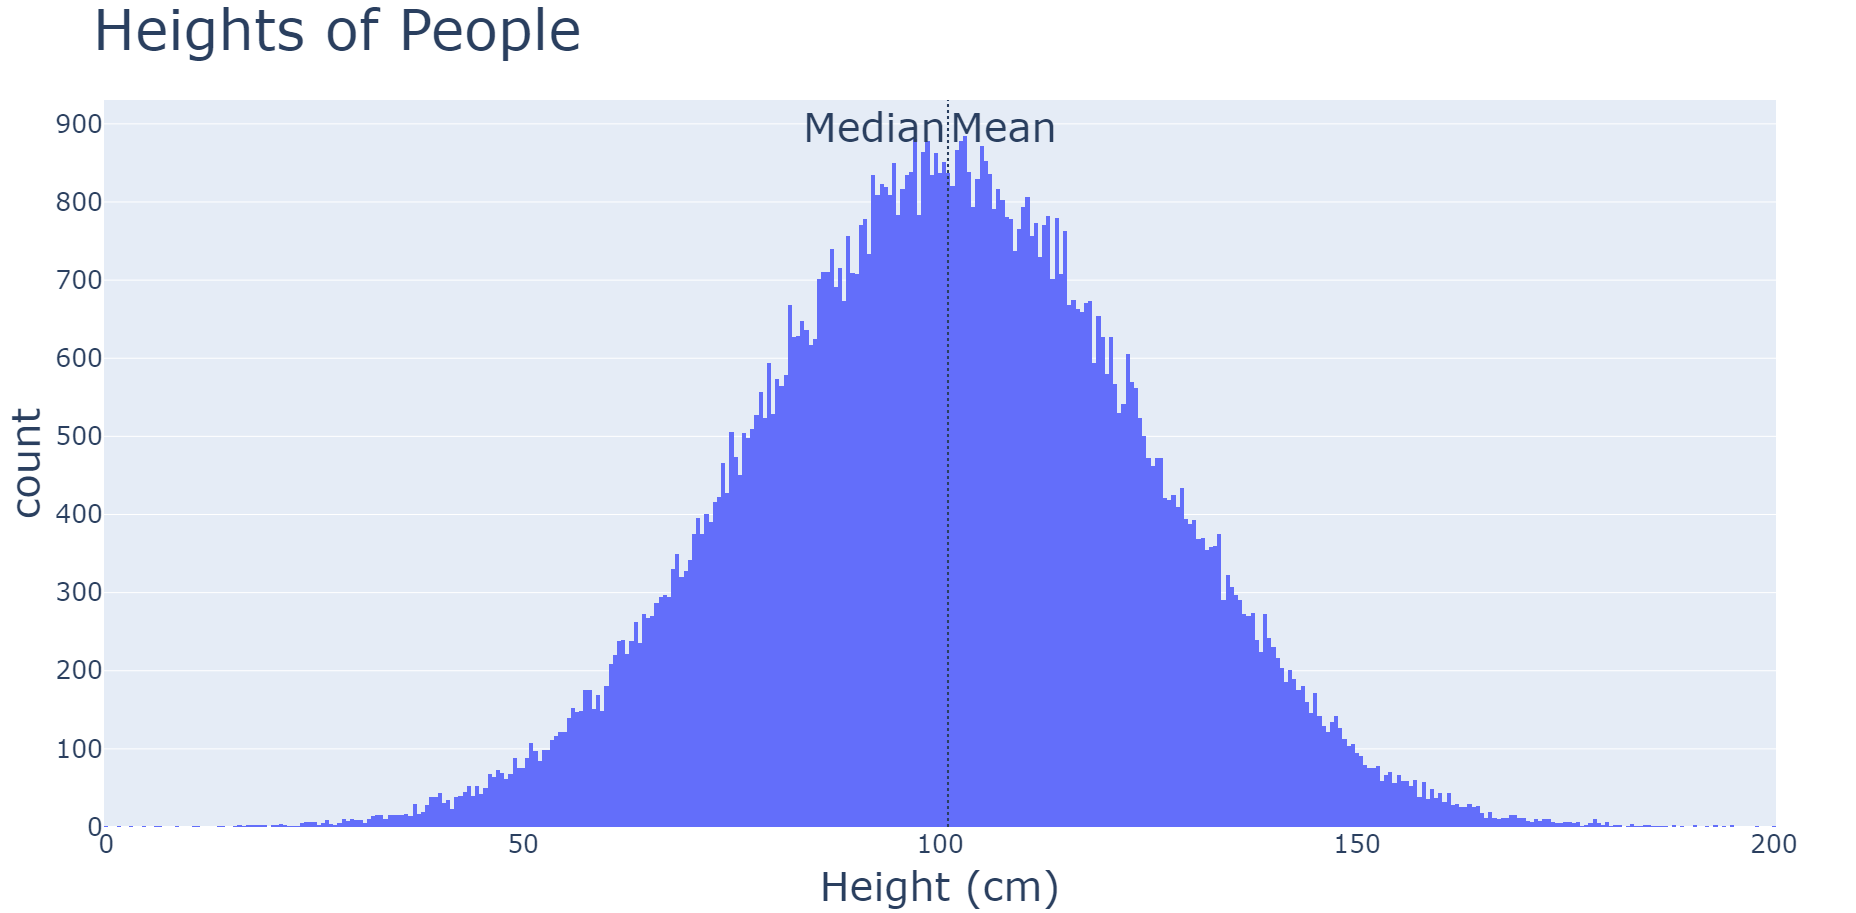
1 https://seaborn.pydata.org/generated/seaborn.histplot.html
Reading a histogram
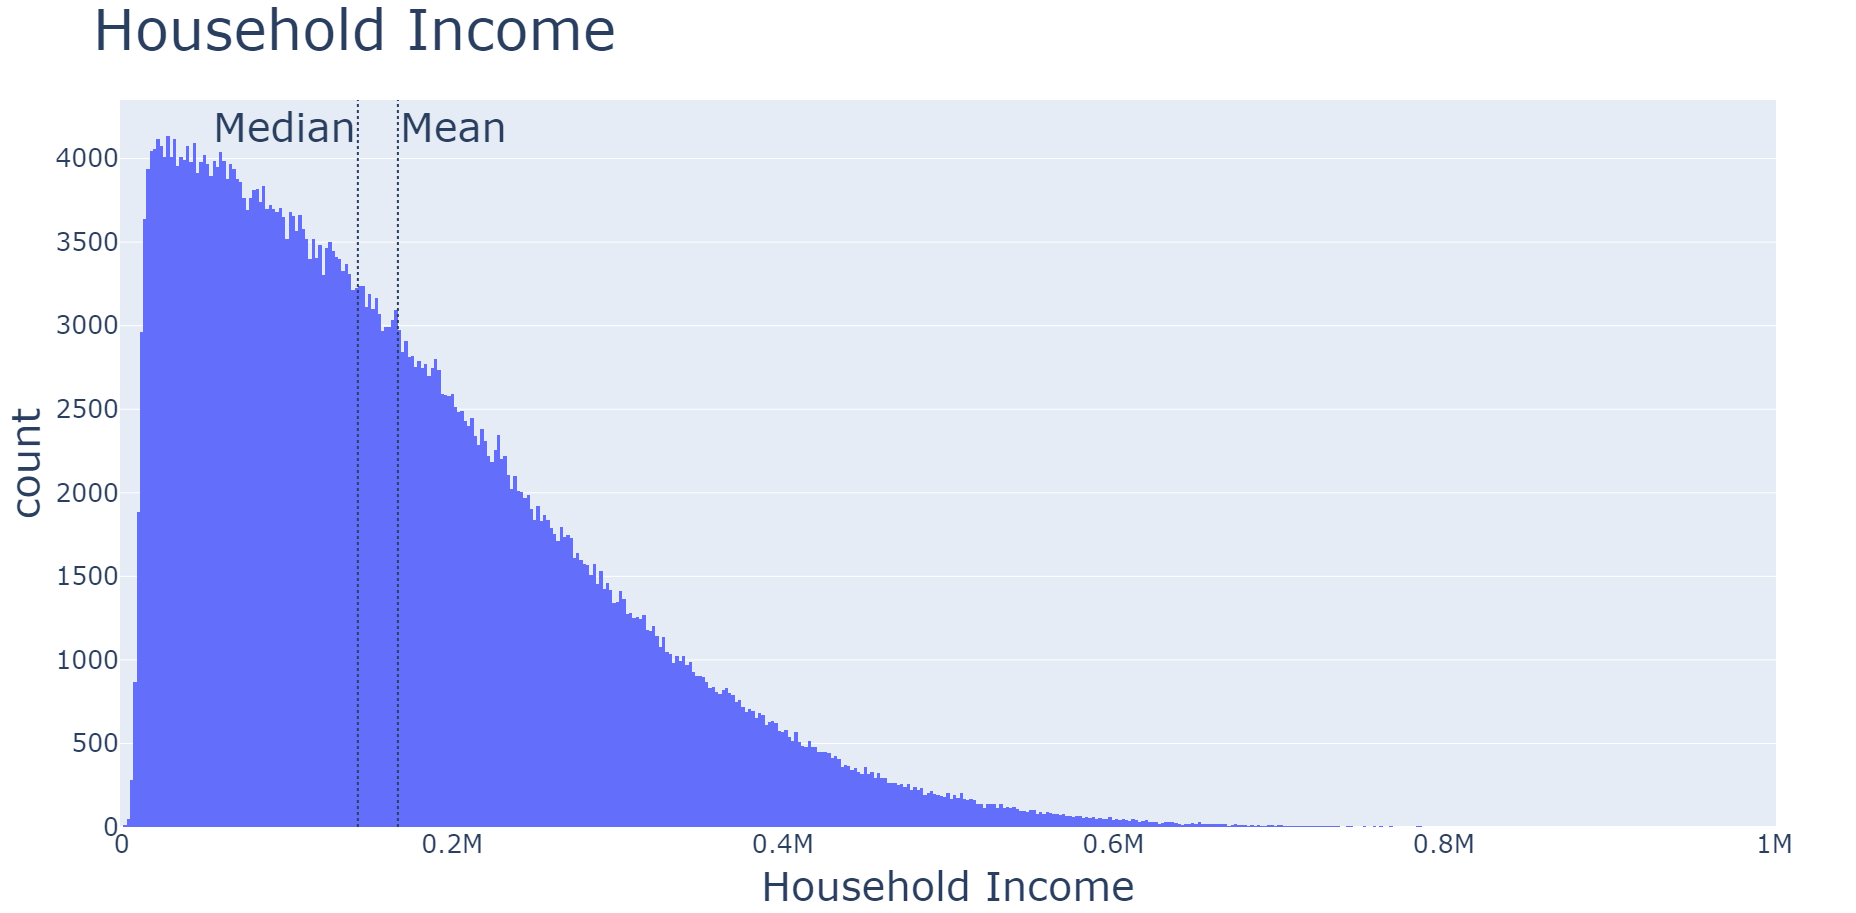
Reading a histogram
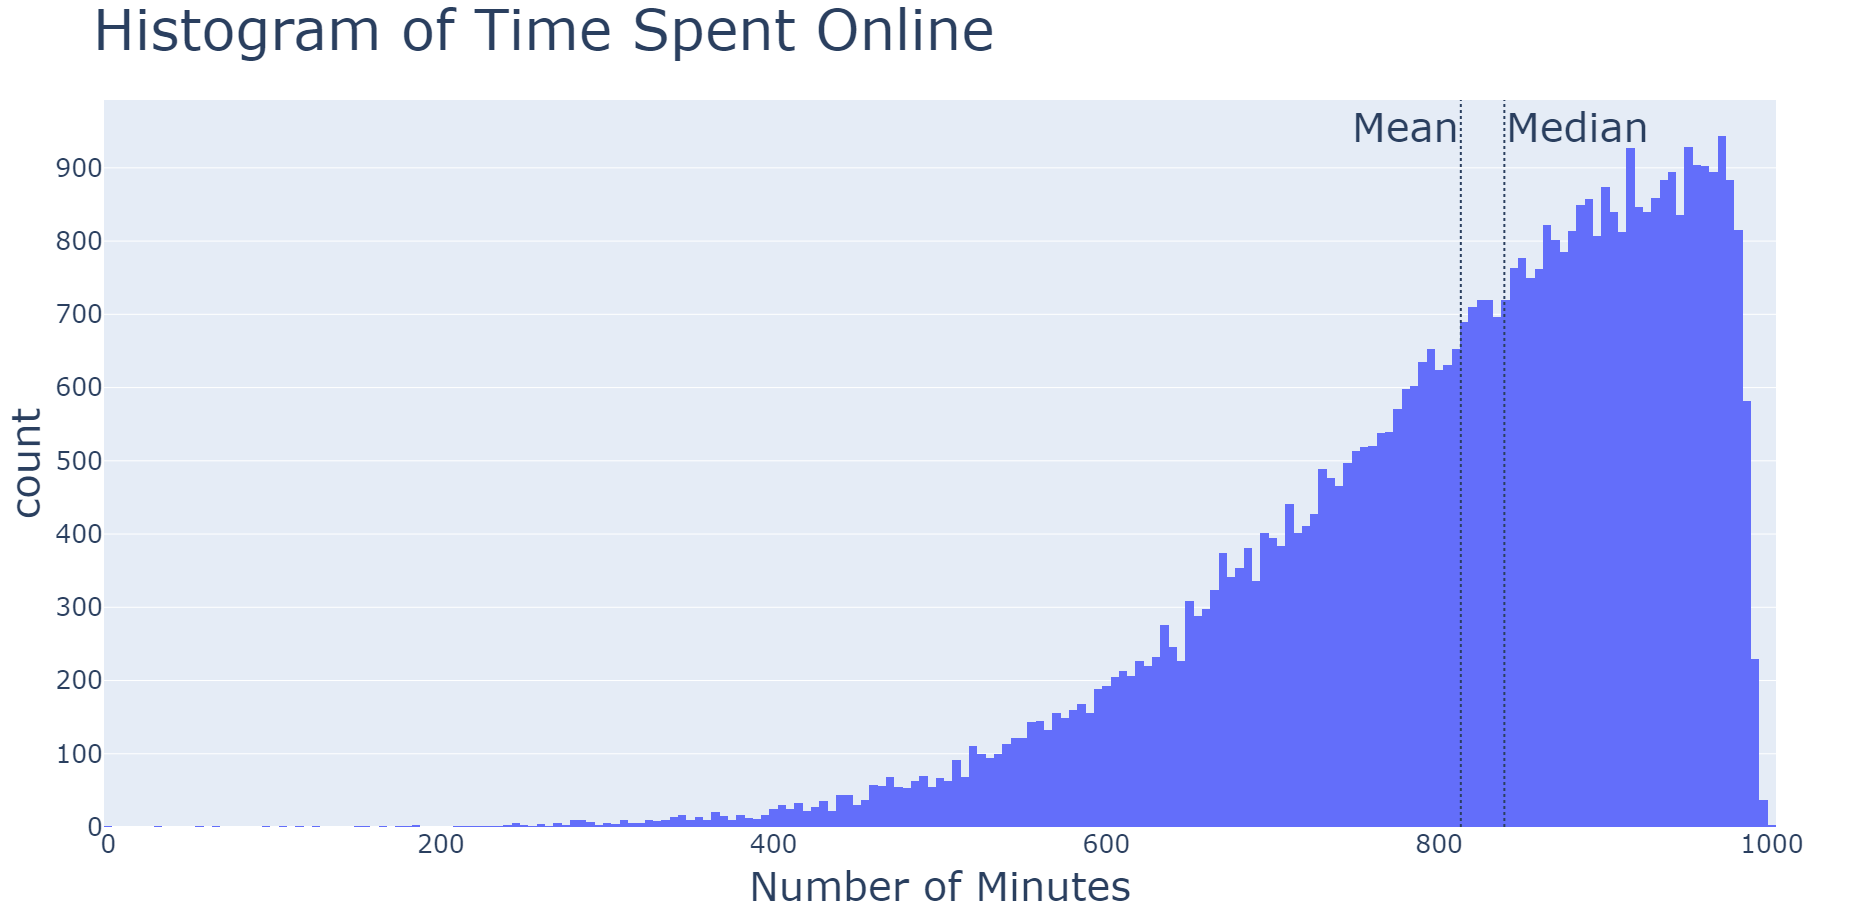
Reading a histogram
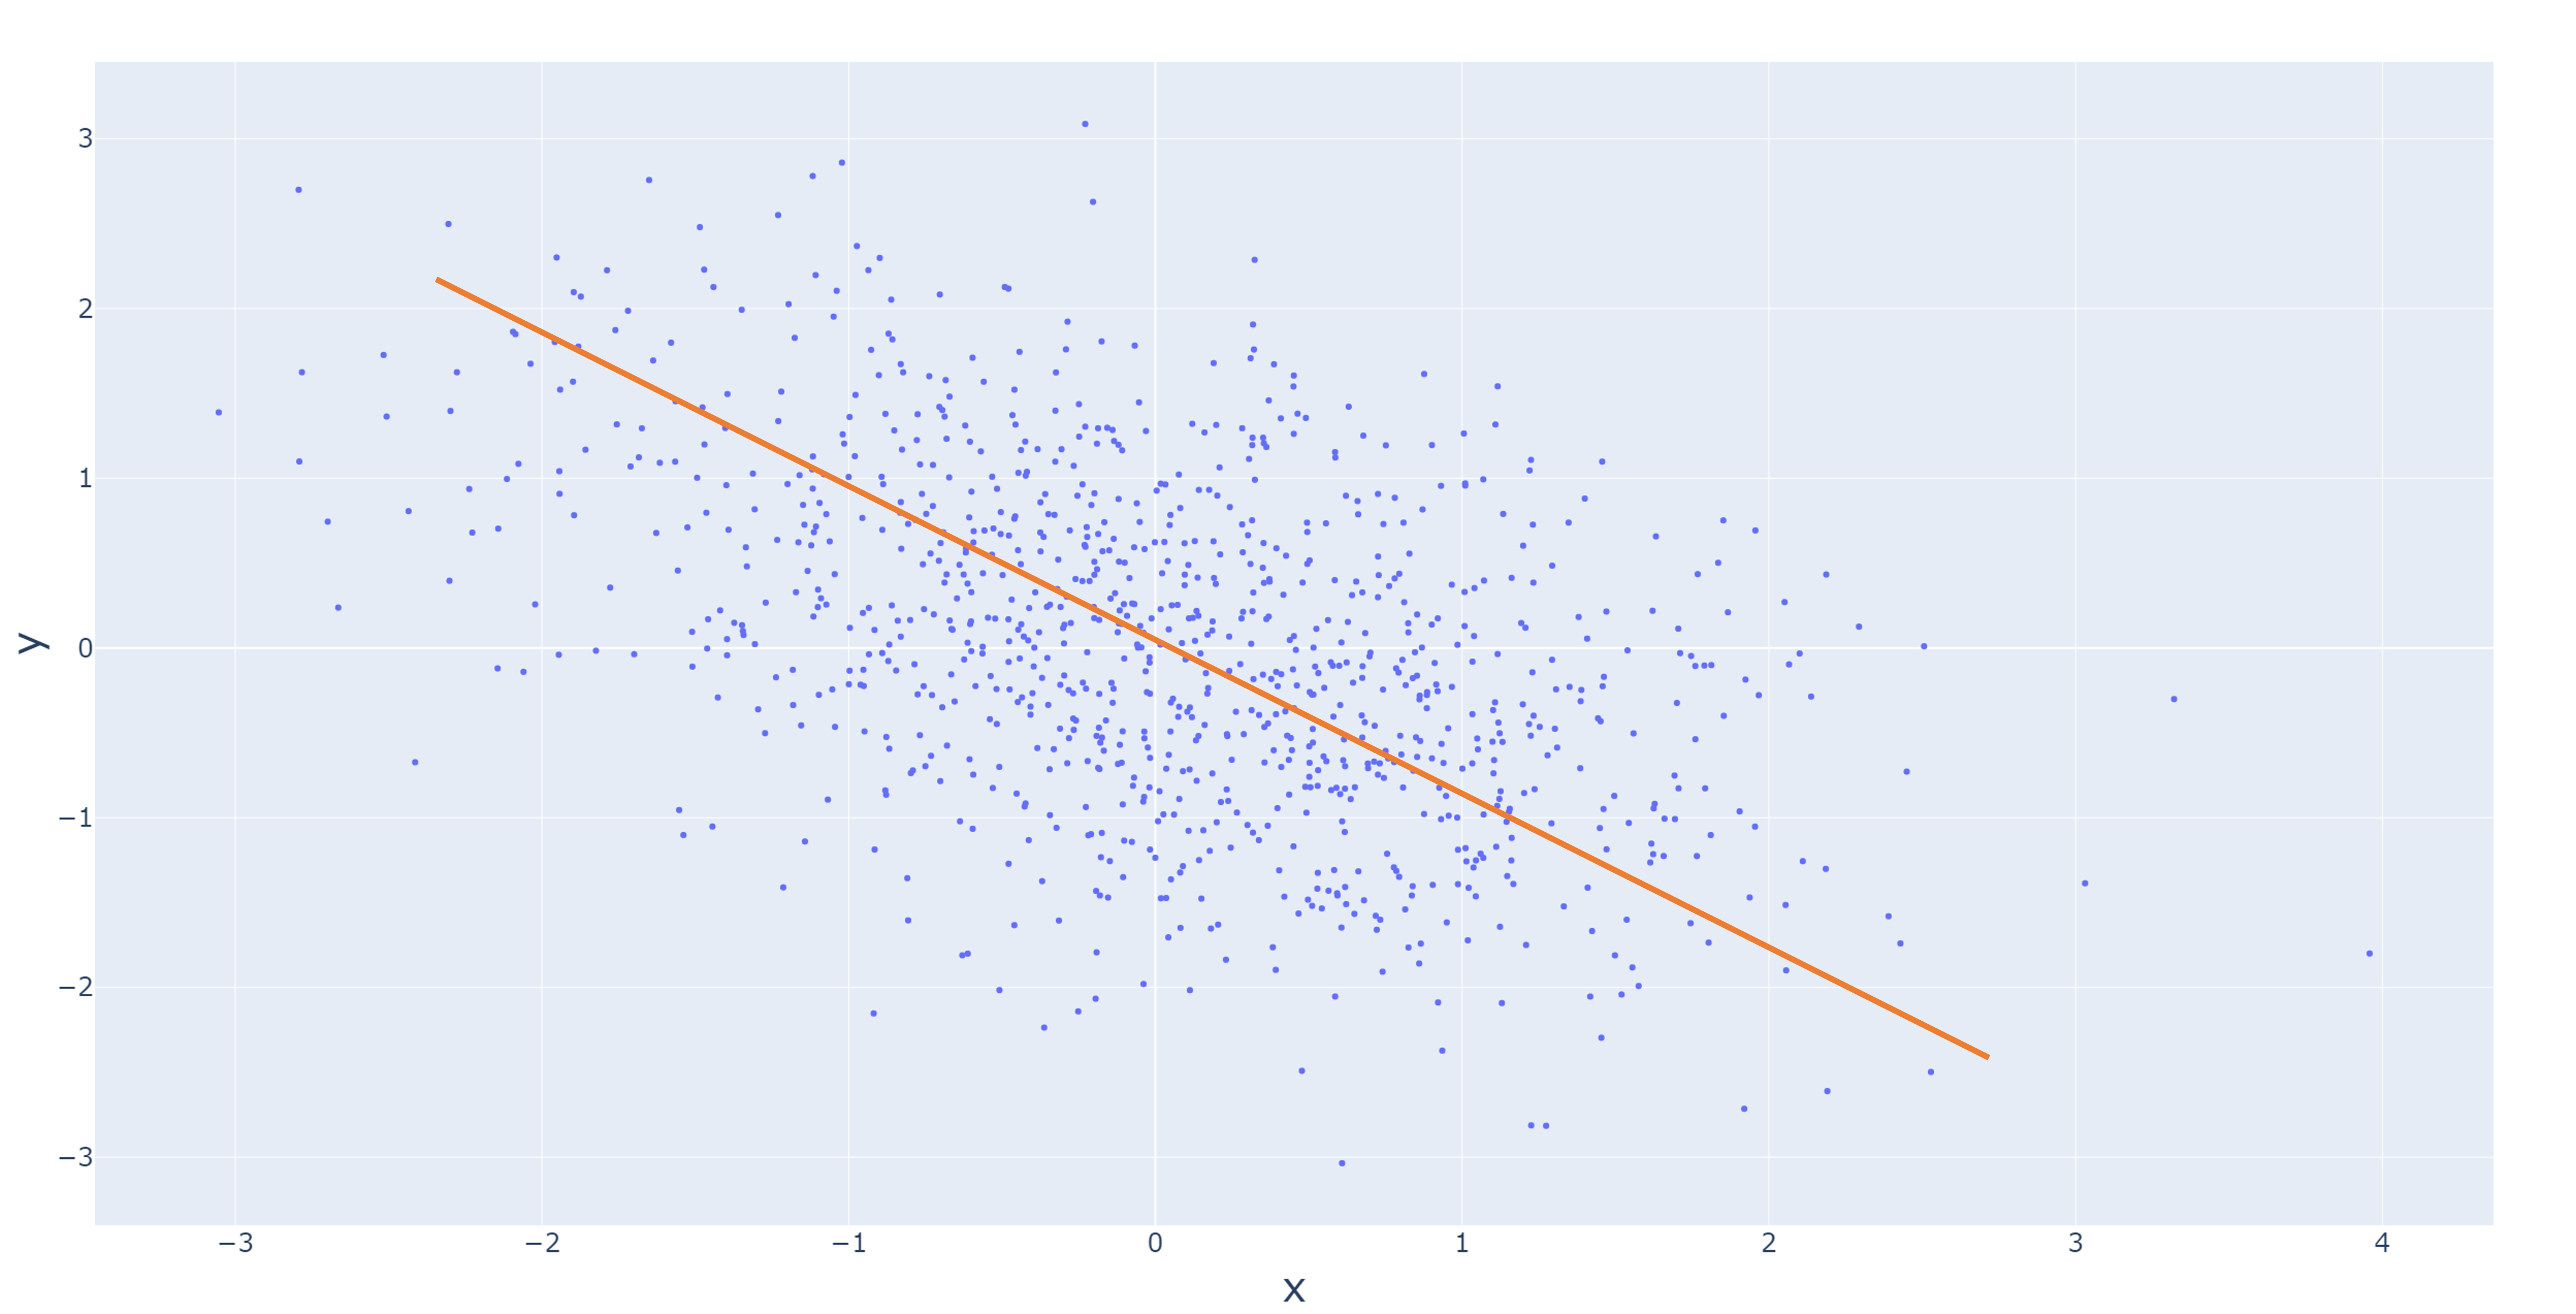
Scatter plots
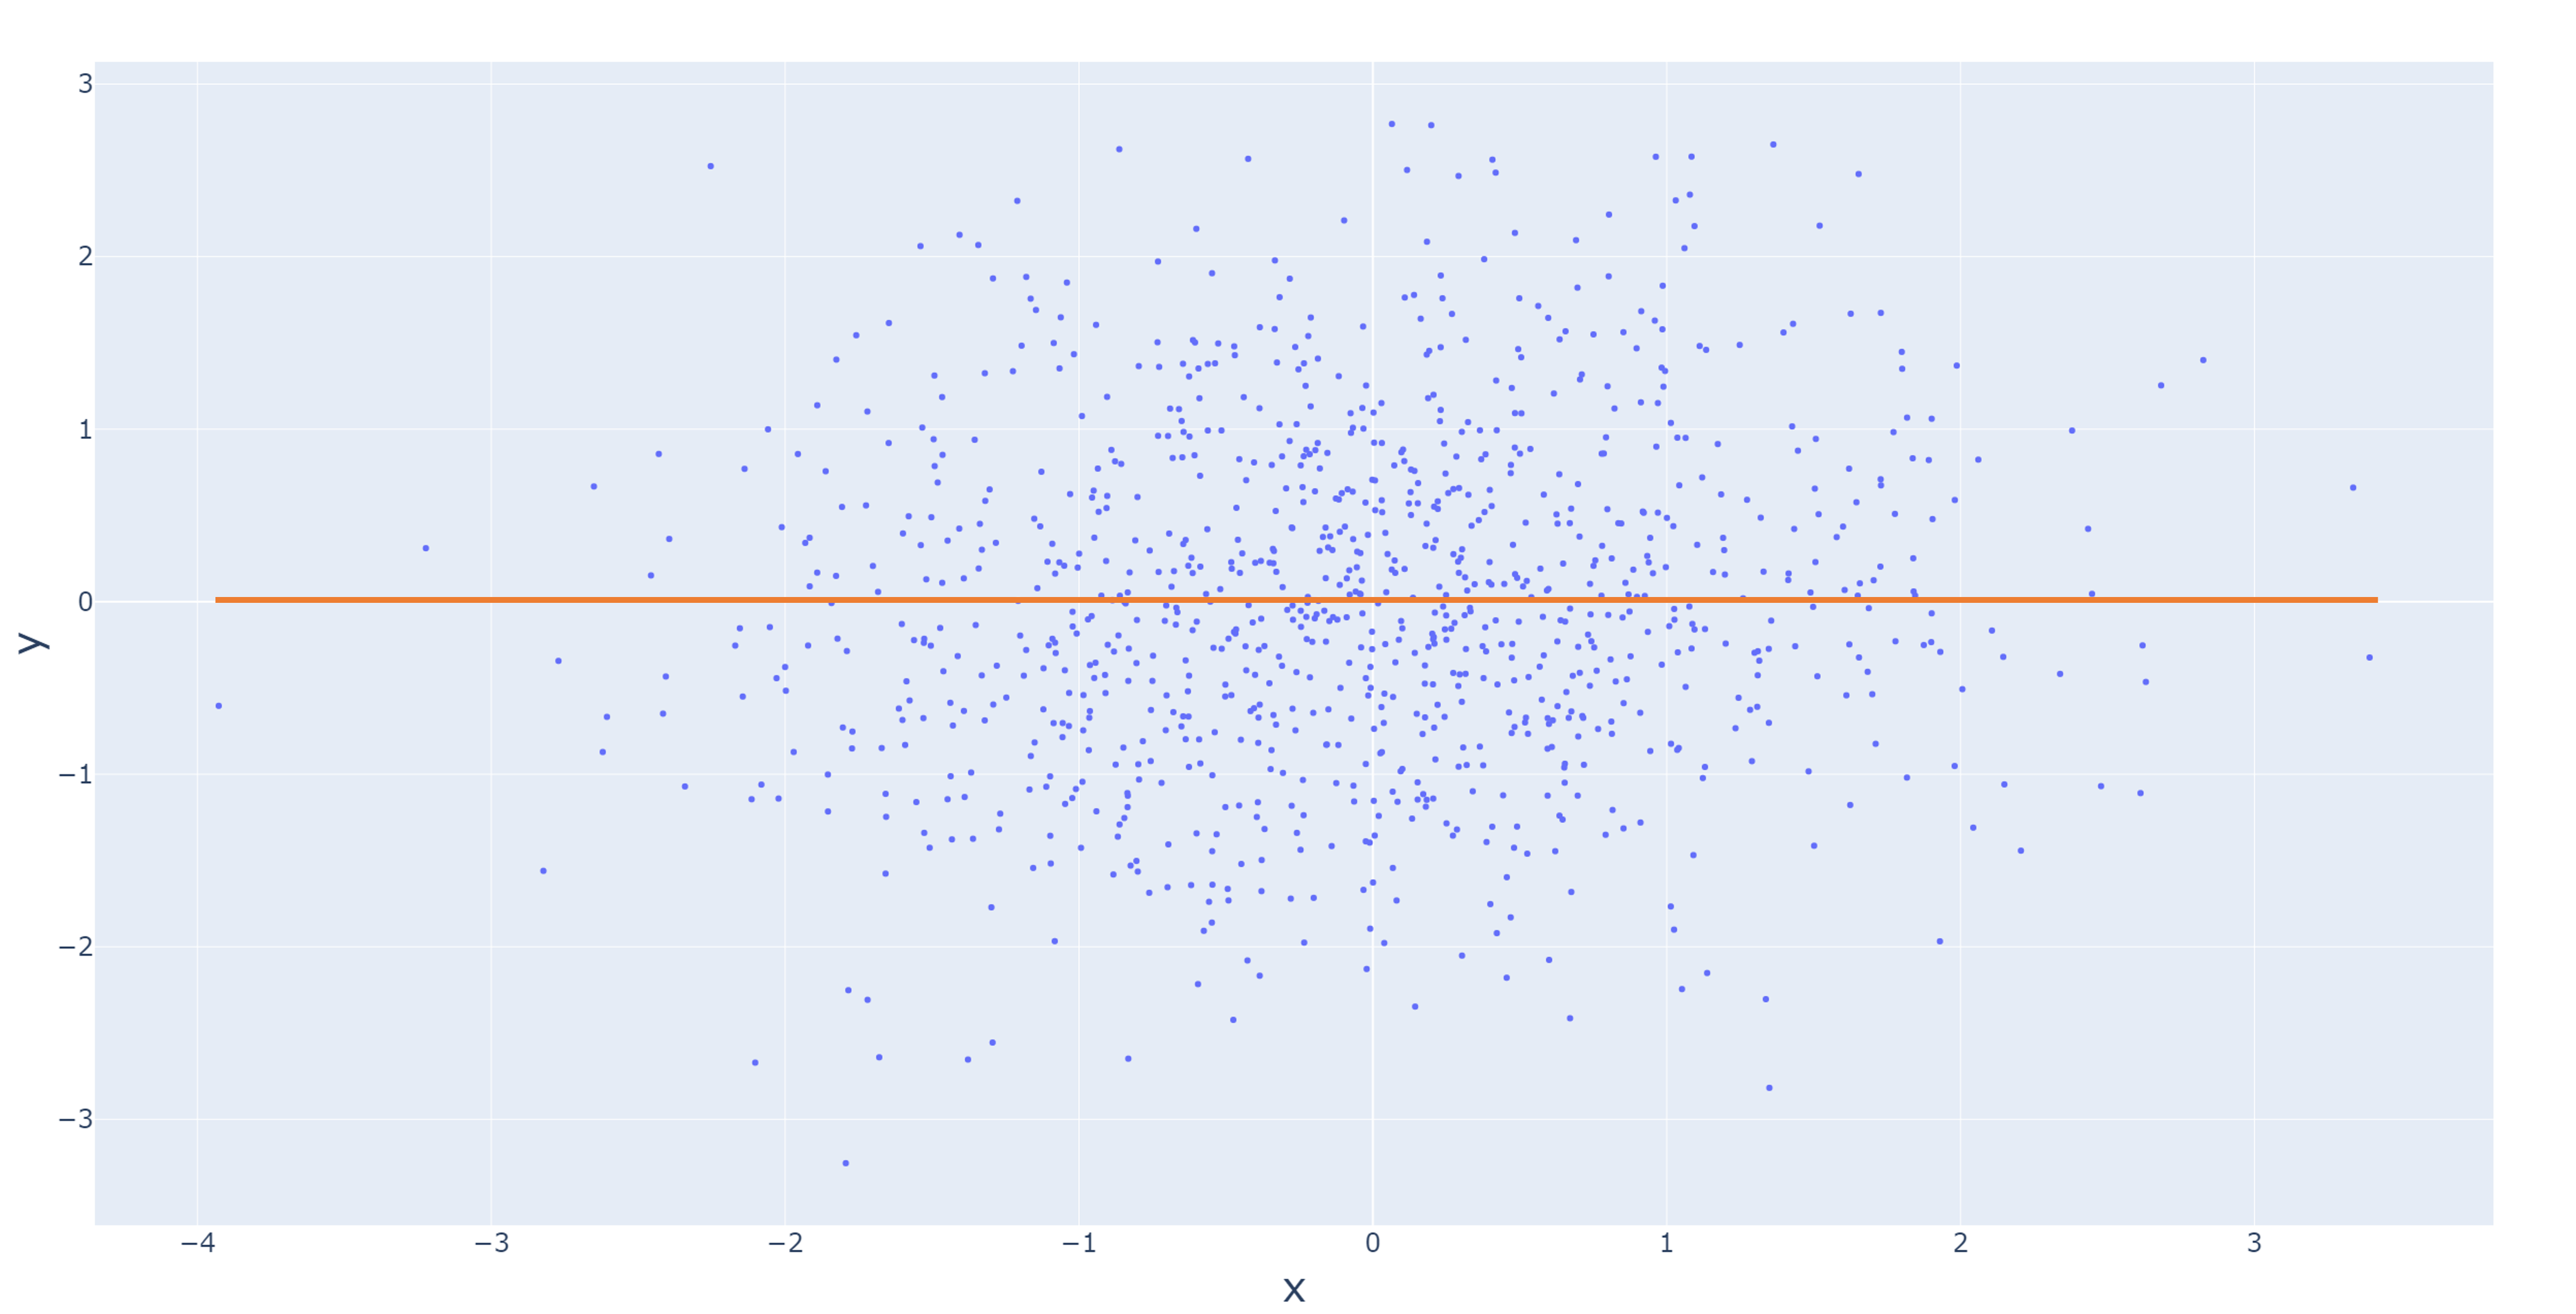
Reading scatter plots
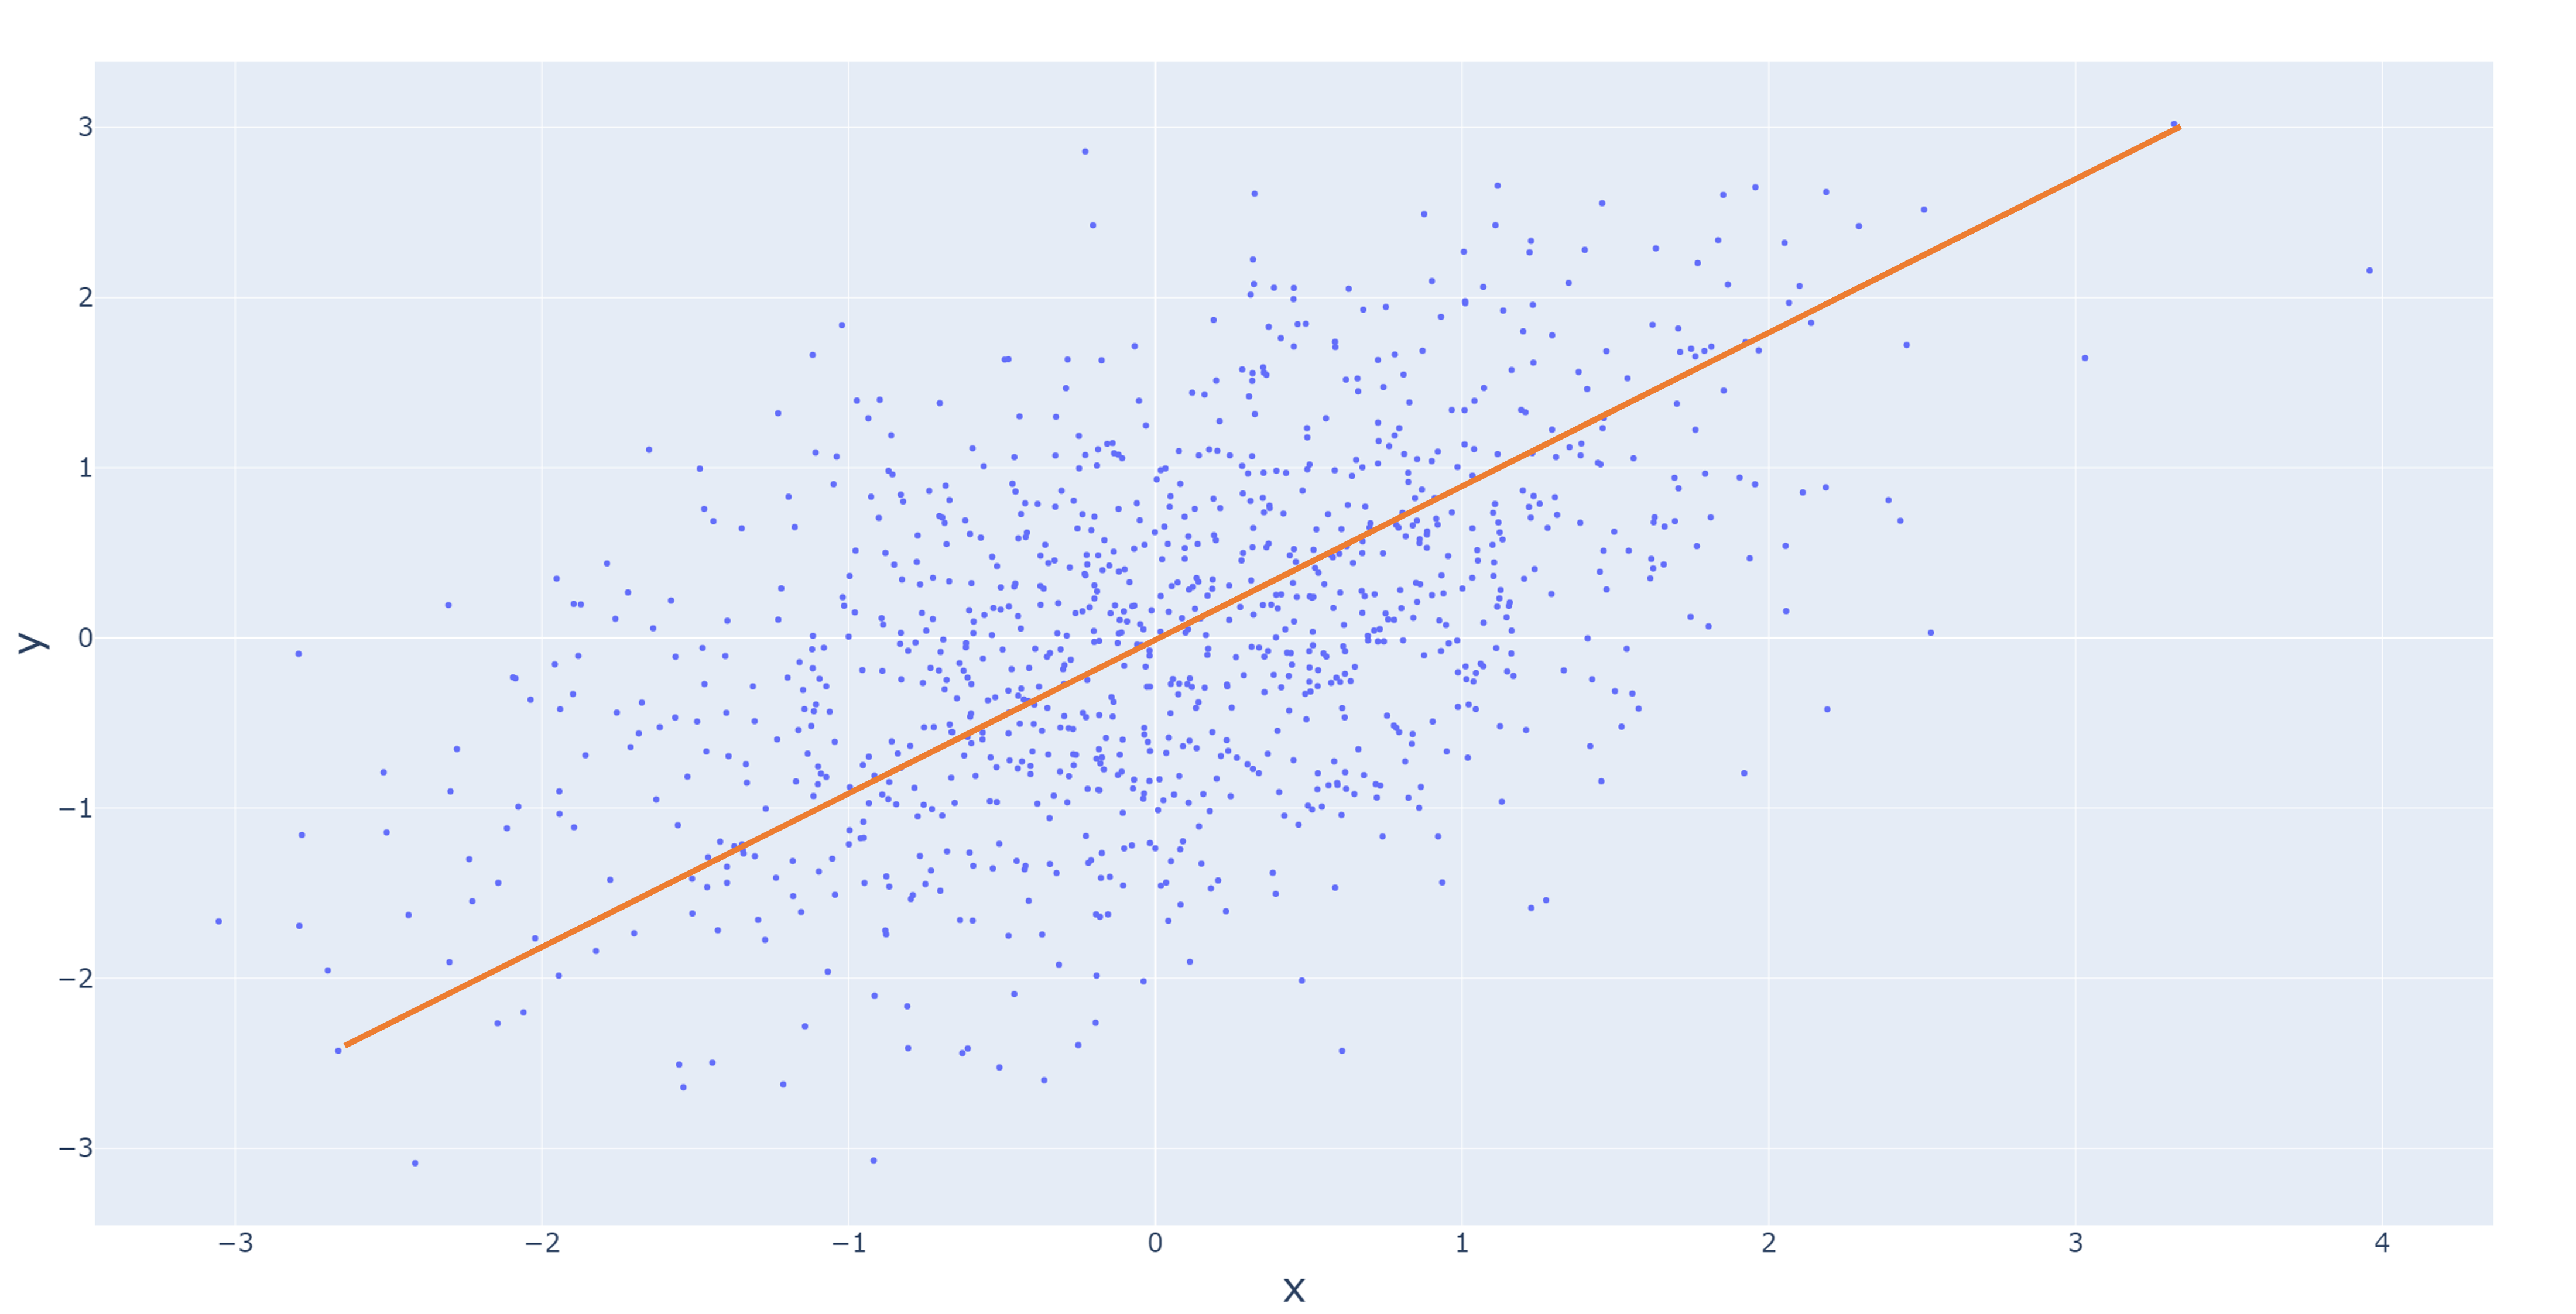
Reading scatter plots
Joint plots
Pair plots

