From data to story: a case study
Introduction to Data Literacy

Carl Rosseel
Head of Business Intelligence Curriculum, DataCamp
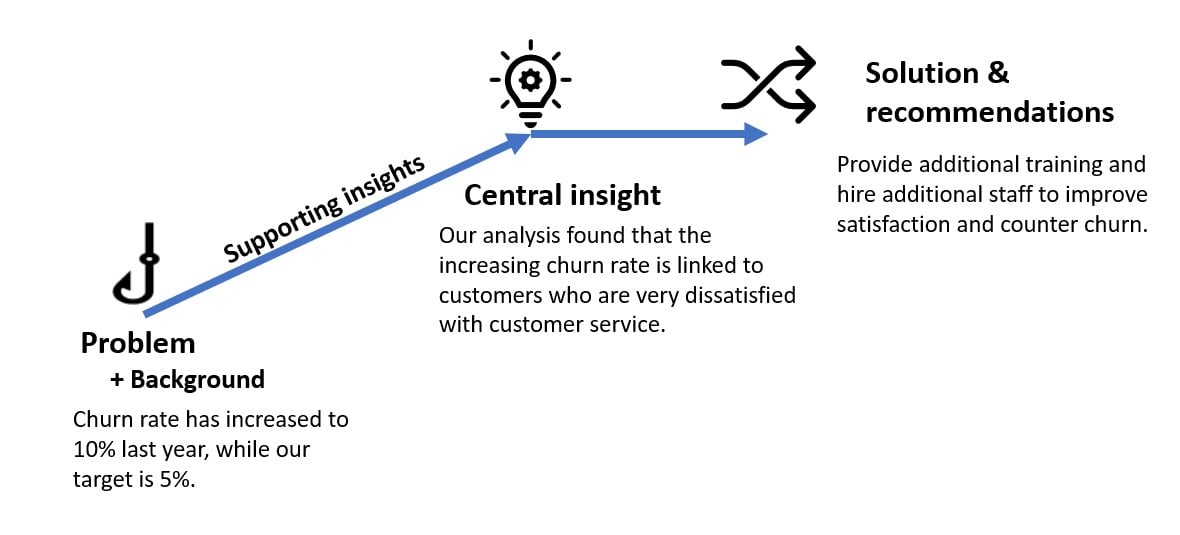
The case study: Customer Churn

Setting up the narrative structure
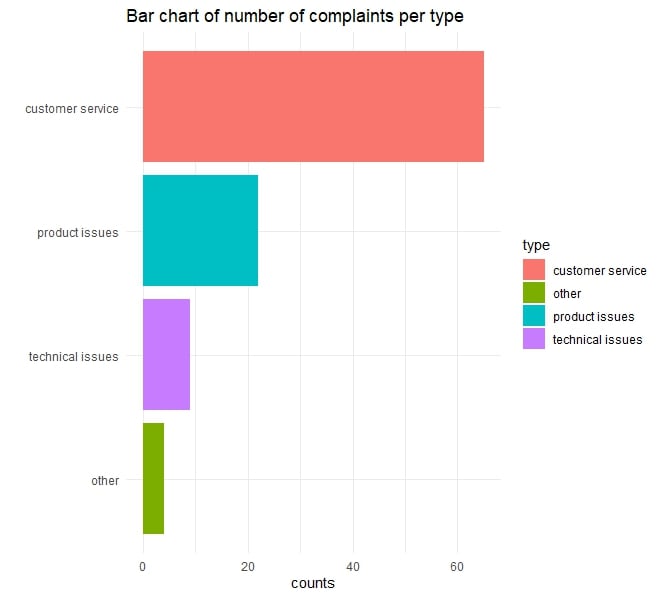
Choosing visualizations
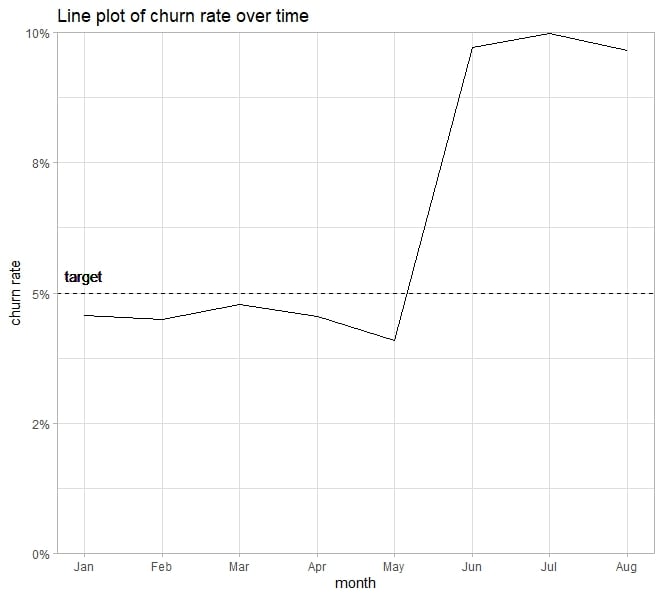
Choosing visualizations
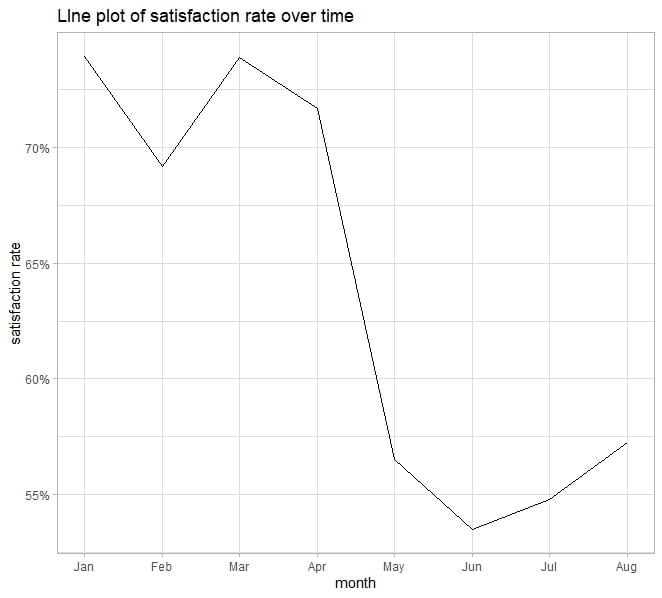
Choosing visualizations