Descriptive analytics

Introduction to Data Literacy

Carl Rosseel

Head of Business Intelligence Curriculum, DataCamp

Analytics overview

Schematic overview of the four types of analytics

Introduction to Data Literacy

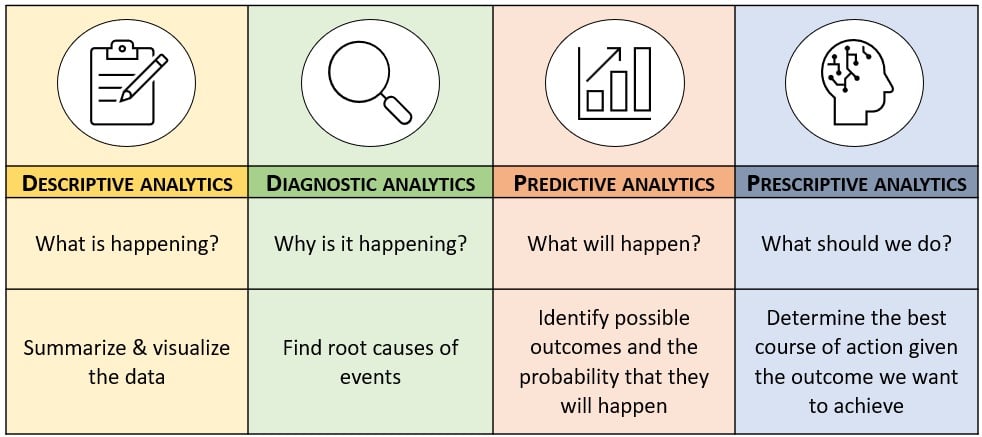
Why use descriptive analytics?
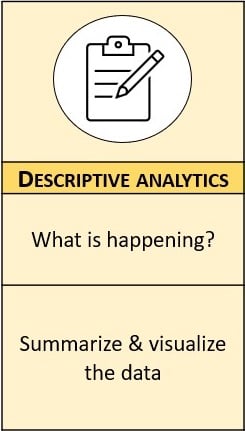
  • Get to know the data
  • Investigate relationships in the data
  • Preparation for more advanced techniques

Zoom-in of descriptive analytics

Introduction to Data Literacy

Common techniques

  • Descriptive statistics
  • Visualizations
  • Outlier detection

Often combined in exploratory data analysis (EDA)

Example of outlier detection

Introduction to Data Literacy

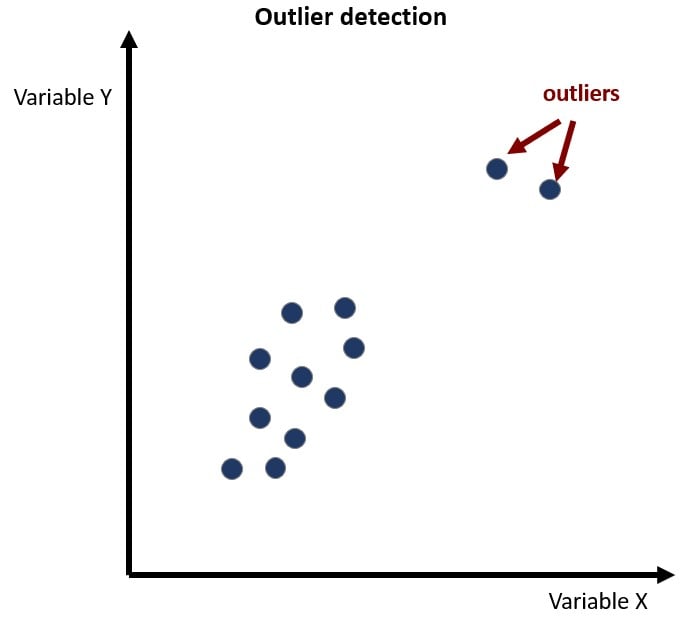
Exploratory data analysis

  • Focus on exploring the data:
    • Assessing its main characteristics
    • Finding relationships, patterns or groups
    • Suggesting hypotheses for future analysis


  • Combines different techniques, with a strong emphasis on visualization
  • Groundwork for further analysis but also valuable on its own

Illustration of person checking data with a magnifier

Introduction to Data Literacy

Case study: ice cream sales

Which ice cream flavor sells the most?

  • Count sales per flavor
  • Calculate most commonly sold flavor per store
  • Calculate commonly sold flavor per month


Apply insights to drop unpopular flavors or offer new flavors with similar characteristics as existing popular ones

Picture of ice cream

Introduction to Data Literacy

Let's practice!

Introduction to Data Literacy

Preparing Video For Download...