Resampling as a special type of Monte Carlo simulation
Monte Carlo Simulations in Python

Izzy Weber
Curriculum Manager, DataCamp
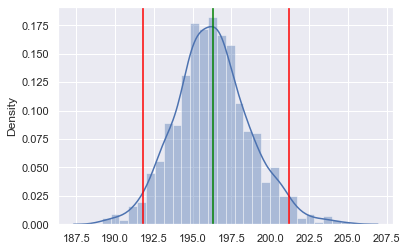
Visualization of bootstrap results
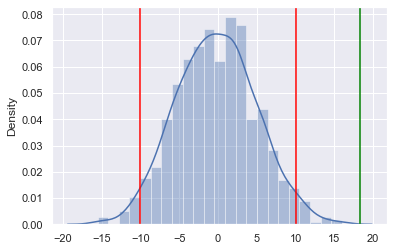
Visualizing permutation results
sns.distplot(simu_diff)
plt.axvline(-10.03, color="red")
plt.axvline(10.03, color="red")
plt.axvline(18.32, color="green")