Explore the data
Monte Carlo Simulations in Python

Izzy Weber
Curriculum Manager, DataCamp
The diabetes dataset
Ten independent variables:
- Age
age - Sex
sex - Body mass index
bmi - Average blood pressure
bp - Six blood serum measurements:
tc,ldl,hdl,tch,ltg,glu
1 Bradley Efron, Trevor Hastie, Iain Johnstone and Robert Tibshirani (2004) "Least Angle Regression," Annals of Statistics (with discussion), 407-499 2 https://www4.stat.ncsu.edu/~boos/var.select/diabetes.html
The diabetes dataset
Dependent variable
- A quantitative measure of disease progression one year after baseline,
y
Size of the dataset
- 442 diabetes patients
The diabetes dataset
dia.head()
|     | age | sex | bmi  | bp     | tc  | ldl   | hdl  | tch  | ltg    | glu | y   |
|-----|-----|-----|------|--------|-----|-------|------|------|--------|-----|-----|
| 0   | 59  | 2   | 32.1 | 101.00 | 157 | 93.2  | 38.0 | 4.00 | 4.8598 | 87  | 151 |
| 1   | 48  | 1   | 21.6 | 87.00  | 183 | 103.2 | 70.0 | 3.00 | 3.8918 | 69  | 75  |
| 2   | 72  | 2   | 30.5 | 93.00  | 156 | 93.6  | 41.0 | 4.00 | 4.6728 | 85  | 141 |
| 3   | 24  | 1   | 25.3 | 84.00  | 198 | 131.4 | 40.0 | 5.00 | 4.8903 | 89  | 206 |
| 4   | 50  | 1   | 23.0 | 101.00 | 192 | 125.4 | 52.0 | 4.00 | 4.2905 | 80  | 135 |
1 https://www4.stat.ncsu.edu/~boos/var.select/diabetes.html 2 http://statweb.lsu.edu/faculty/li/IIT/diabetes.txt
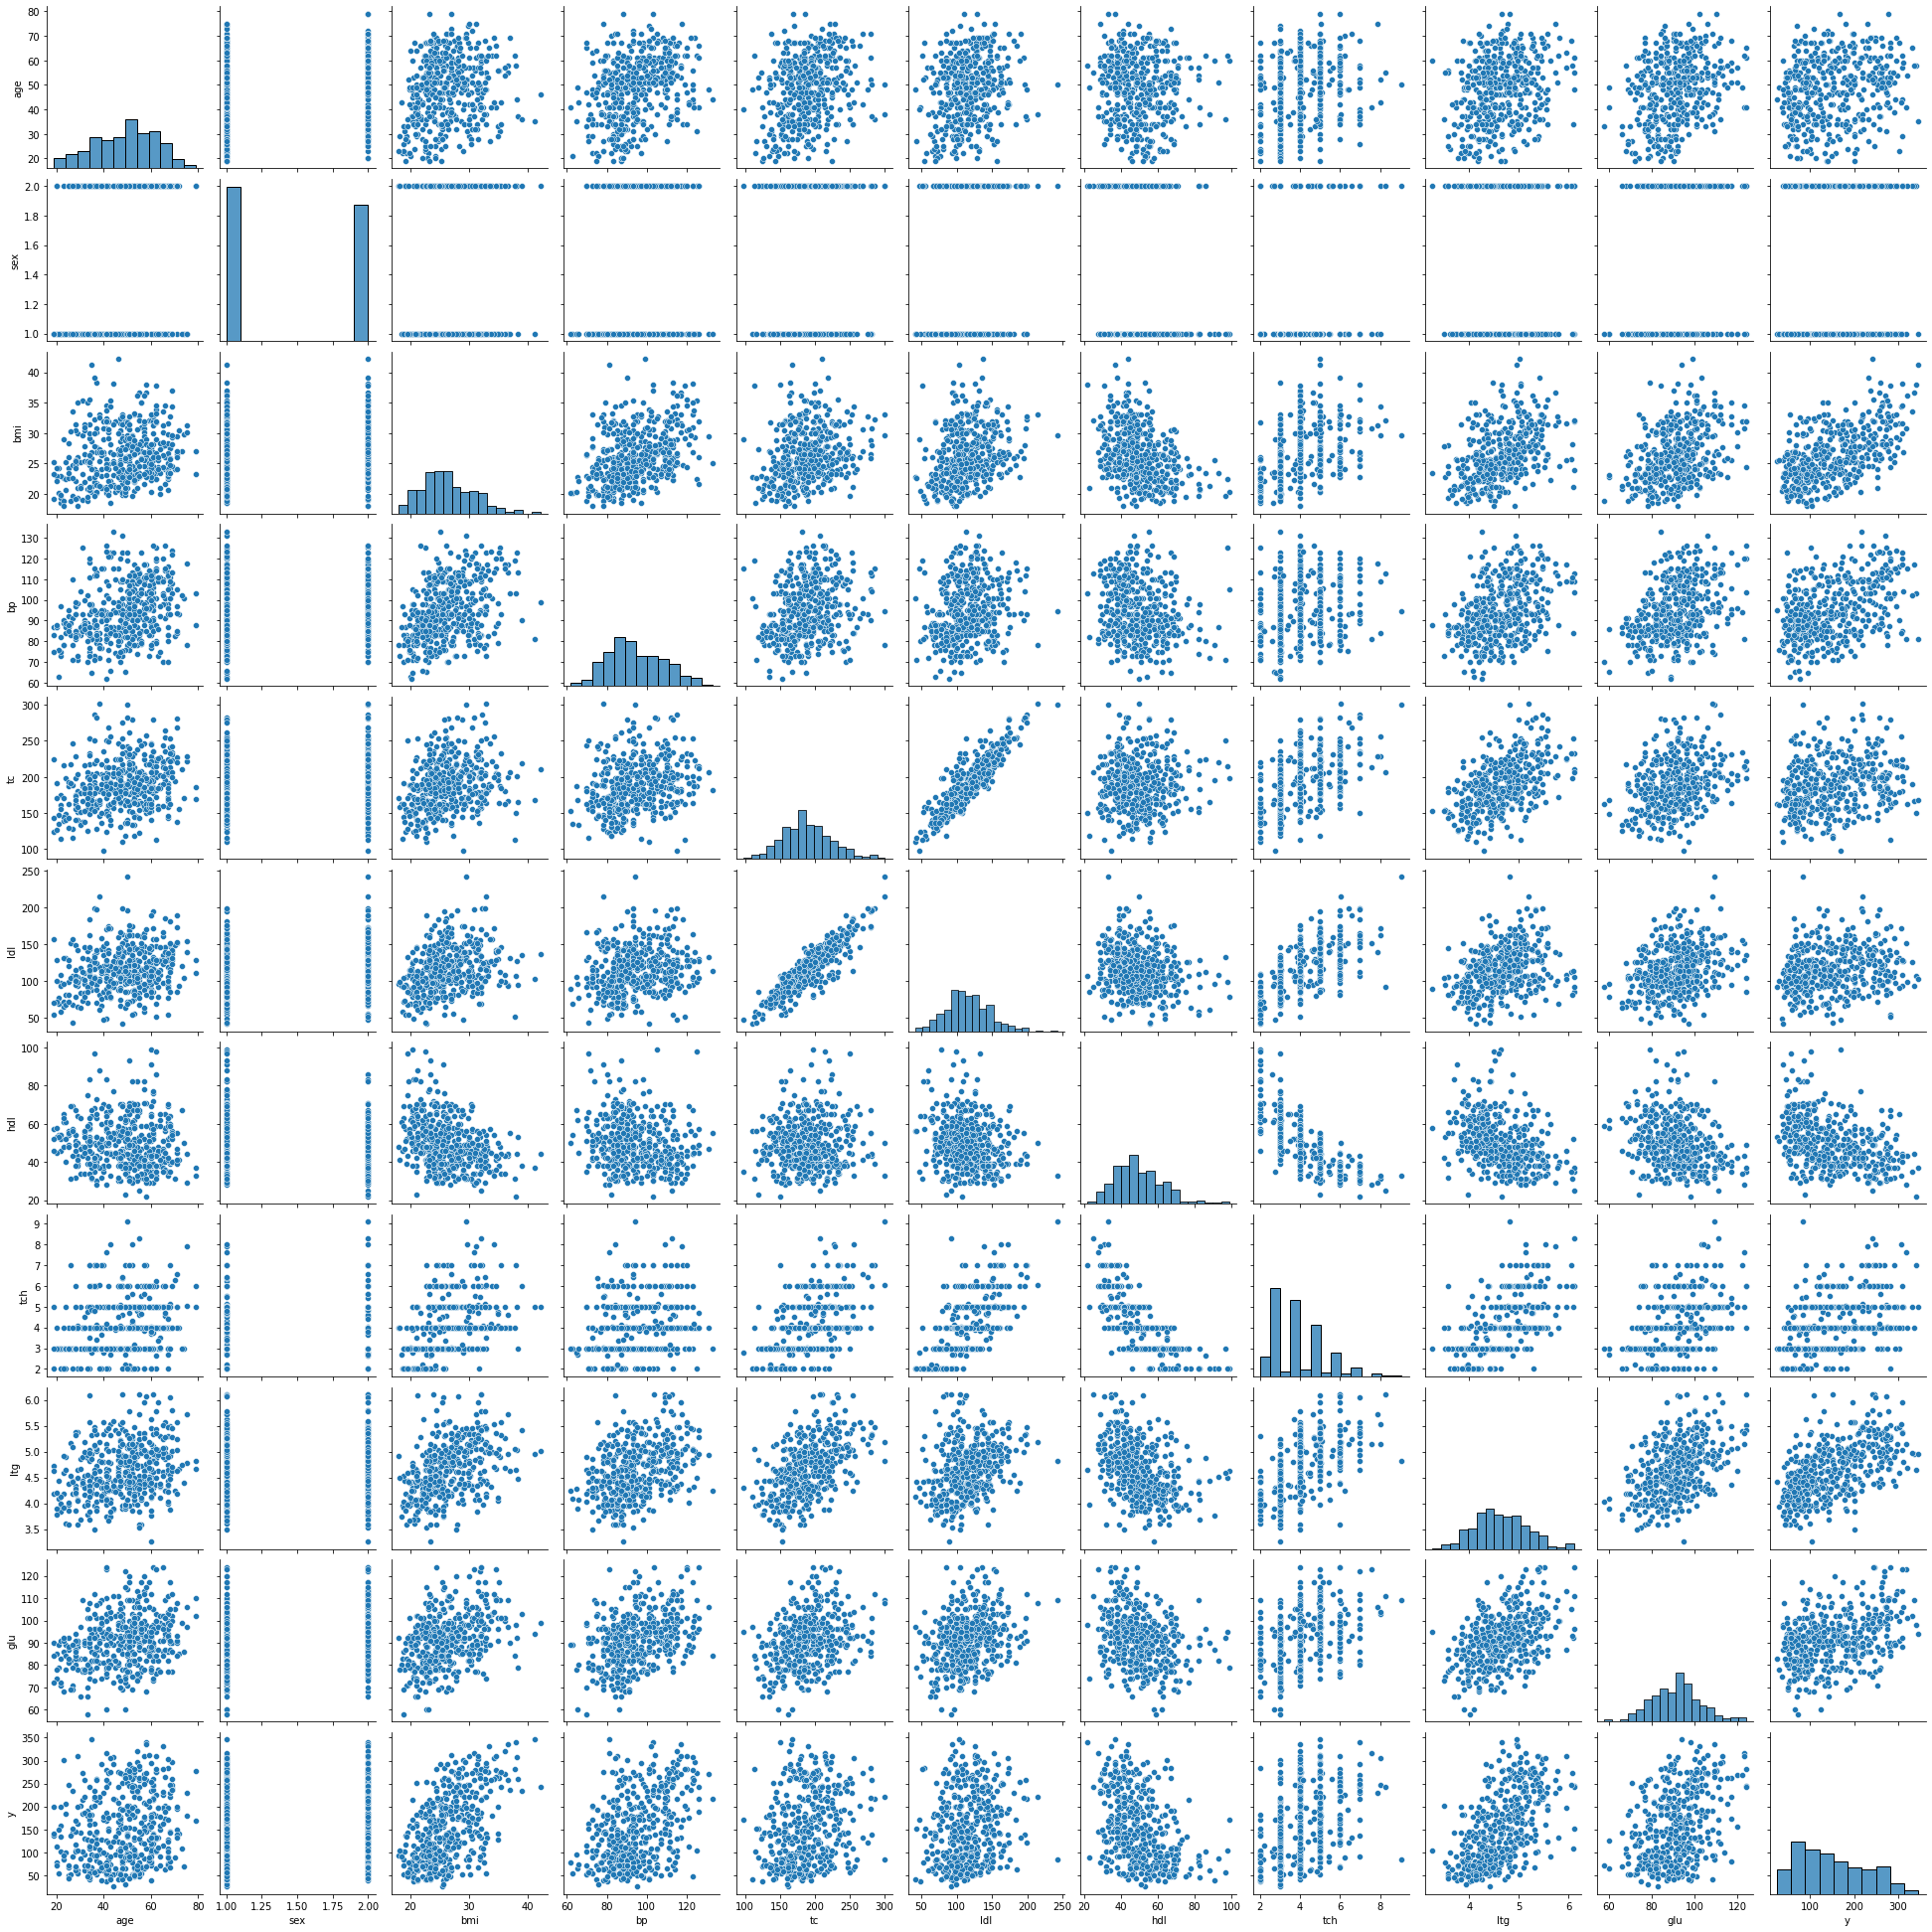
Why do we explore data before simulation?
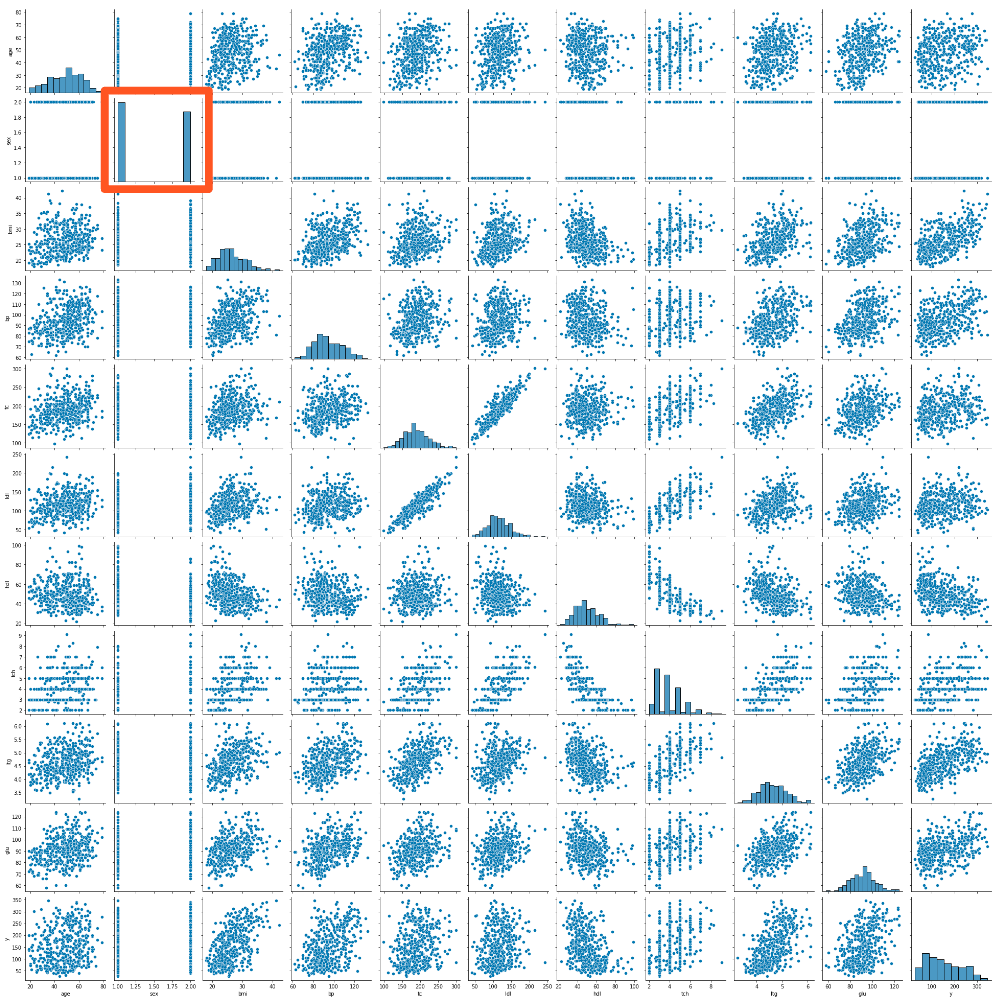
- Visually inspect the distribution of variables
- Intuition for probability distribution
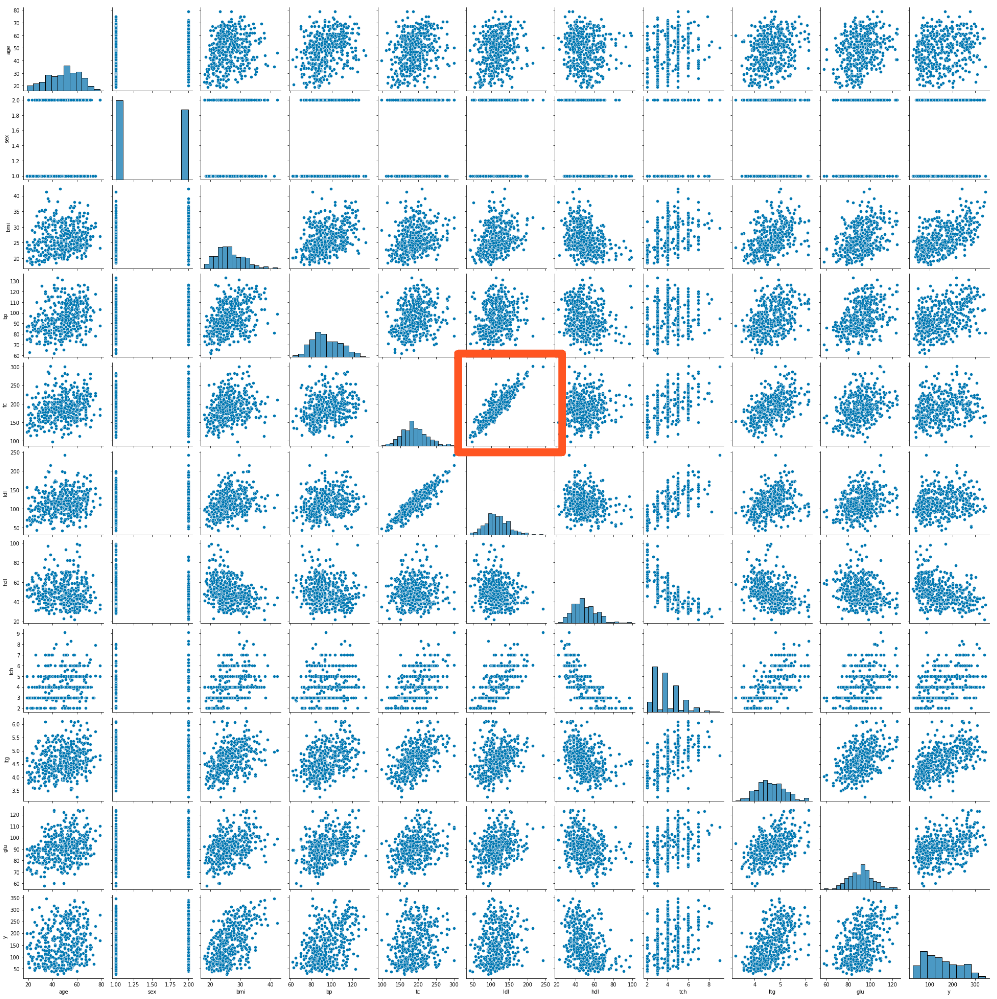
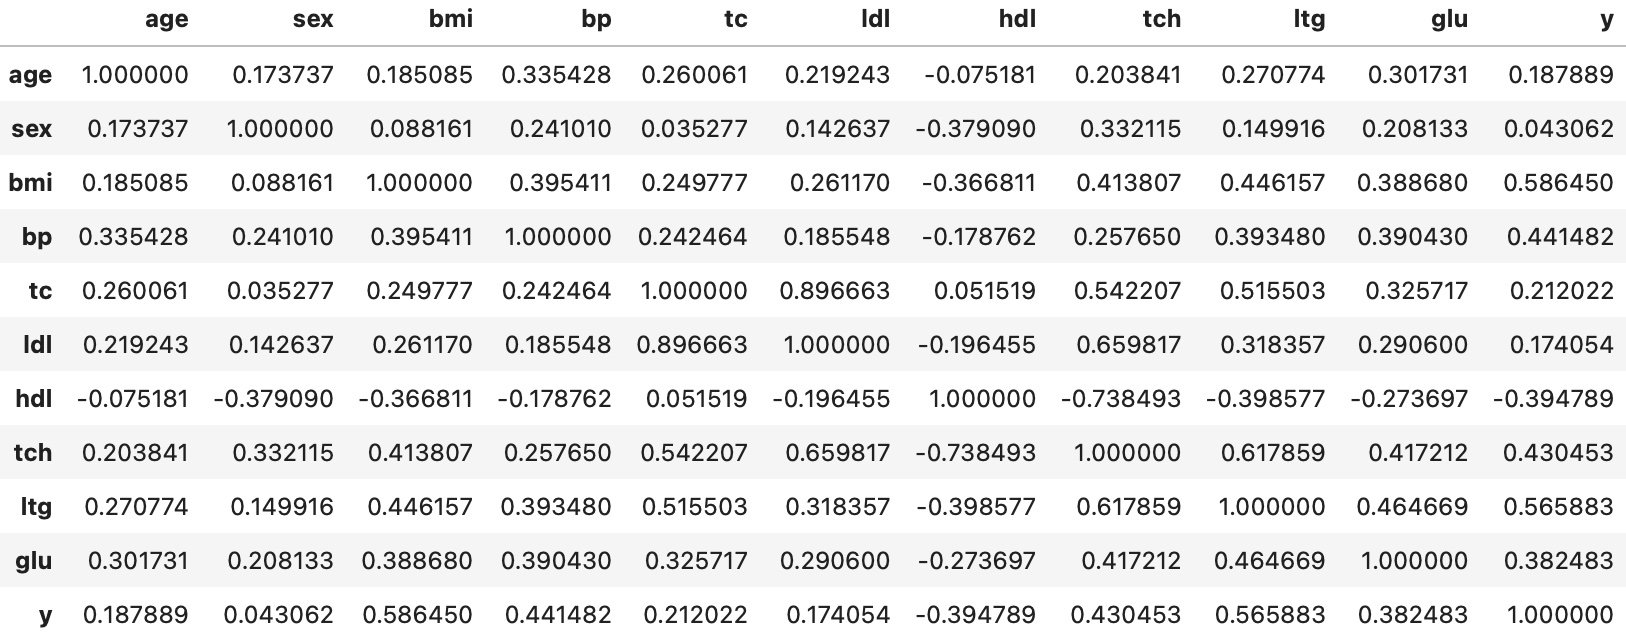
- Check and measure the correlation between predictor variables
- Rationales for modeling covariance structure
- Check and measure the correlation between predictor variables and the response
- Initial understanding of relationship between predictors and response
Pairplot of the dataset
sns.pairplot(dia)

Pairplot of the dataset
sns.pairplot(dia)

Pairplot of the dataset
sns.pairplot(dia)

Correlations between different variables
dia.corr()

Let's practice!
Monte Carlo Simulations in Python

