Sensitivity analysis

Monte Carlo Simulations in Python

Izzy Weber

Curriculum Manager, DataCamp

Sensitivity analysis

  • Helps us understand the impact of the range of inputs

  • Illustrates the patterns or trends when summarized in tables or plots


If we increase or decrease the values for bmi and hdl using a Monte Carlo simulation, how will the predicted y values (disease progression) change?

Monte Carlo Simulations in Python

Defining the parameters

cov_dia = dia[["age", "bmi", "bp", "tc", "ldl", "hdl", "tch", "ltg", "glu"]].cov()
mean_dia = dia[["age", "bmi", "bp", "tc", "ldl", "hdl", "tch", "ltg", "glu"]].mean()
Monte Carlo Simulations in Python

Defining the simulation function

def simulate_bmi_hdl(cov_dia, mean_list):

list_ys = [] for i in range(50): simulation_results = st.multivariate_normal.rvs(mean=mean_list, size=500, cov=cov_dia) df_results = pd.DataFrame(simulation_results, columns=["age","bmi","bp","tc","ldl","hdl","tch","ltg","glu"]) predicted_y = regr_model.predict(df_results) df_y = pd.DataFrame(predicted_y, columns=["predicted_y"]) df_summary = pd.concat([df_results, df_y], axis=1) y = np.mean(df_summary["predicted_y"]) list_ys.append(y)
return(np.mean(list_ys))
Monte Carlo Simulations in Python

Perform simulations with a range of input parameters

hdl = []
bmi = []
simu_y = []
for mean_hdl_inc in np.arange(-20, 50, 30): 
    for mean_bmi_inc in np.arange(-7, 11, 3):

mean_list = mean_dia + np.array([0, mean_bmi_inc, 0, 0, 0, mean_hdl_inc, 0, 0, 0]) hdl.append(mean_hdl_inc) bmi.append(mean_bmi_inc)
mean_y = simulate_bmi_hdl(cov_dia, mean_list)
simu_y.append(mean_y)
df_sa = pd.concat([pd.Series(hdl), pd.Series(bmi), pd.Series(simu_y)], axis=1)
df_sa.columns = ["hdl_inc", "bmi_inc", "y"]
Monte Carlo Simulations in Python

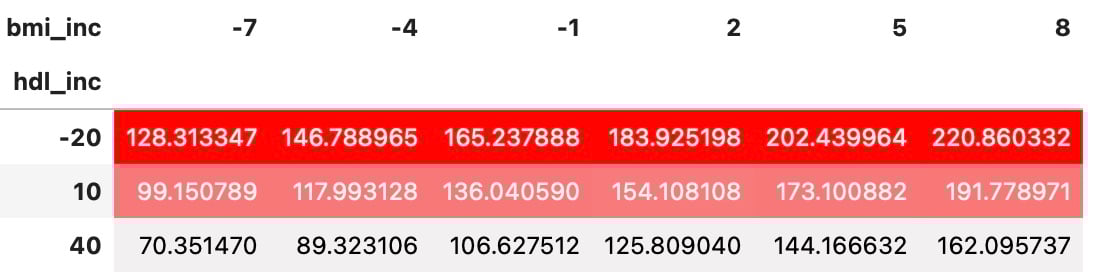
Styled DataFrames of sensitivity analysis results

df_sa.sort_values(by=['hdl_inc', 'bmi_inc']).pivot(index='hdl_inc',
                                             columns='bmi_inc',
                                             values='y').style.background_gradient(
                                             cmap=sns.light_palette("red", as_cmap=True))

The df_sa after sorting, pivoting, and styling

Monte Carlo Simulations in Python

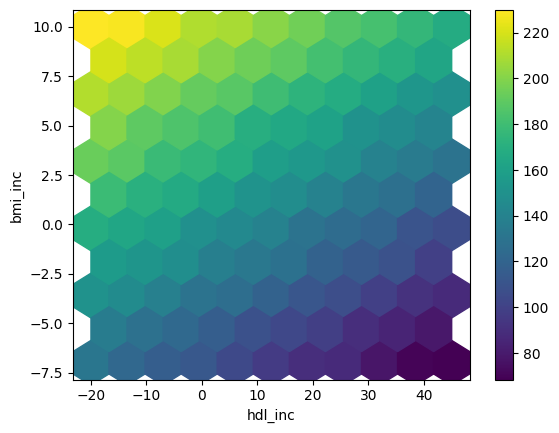
Hexbin plot for sensitivity analysis results

df_sa.plot.hexbin(x='hdl_inc',y='bmi_inc', C='y',
                    reduce_C_function=np.mean,
                    gridsize=10, cmap="viridis",
                    sharex=False) 

A hexbin of df_sa

Monte Carlo Simulations in Python

Hexbin plot for dense parameter space

Monte Carlo Simulations in Python

Let's practice!

Monte Carlo Simulations in Python

Preparing Video For Download...