Generating multivariate random variables

Monte Carlo Simulations in Python

Izzy Weber

Curriculum Manager, DataCamp

Sampling from multivariate distributions

Multinomial distribution

  • Variables each follow binomial distribution
  • Probabilities of these variables sum to one


Example: simulating the results of flipping a biased coin

scipy.stats.multinomial.rvs()
Monte Carlo Simulations in Python

Sampling from multivariate distributions

Multivariate normal distribution

  • Variables each follow normal distribution
  • Variables can be correlated with each other or not


Example: simulating price and demand

scipy.stats.multivariate_normal.rvs()
Monte Carlo Simulations in Python

Sampling from multinomial distributions

Simulation:.rvs(n, p, size)

  • $n$: 50
  • $p$: [0.2, 0.8]
  • size: 500
results = st.multinomial.rvs(50,
    [0.2, 0.8], size=500)

df_results=pd.DataFrame( {"Head":results[:, 0], "Tail":results[:, 1]}) sns.pairplot(df_results)

Pairplot of biased coin flip sampling

Monte Carlo Simulations in Python

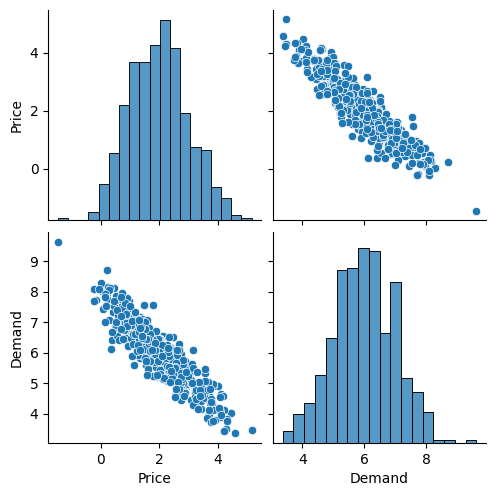
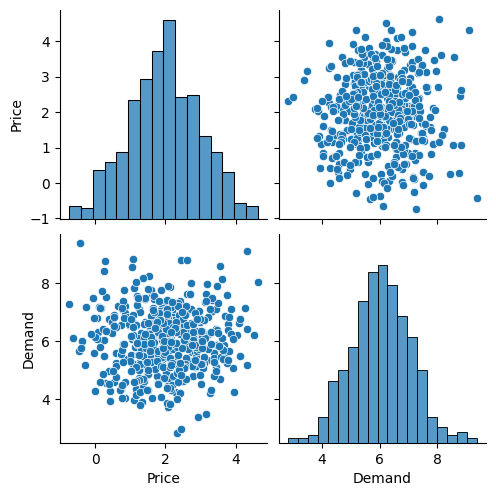
Sampling from multivariate normal distributions
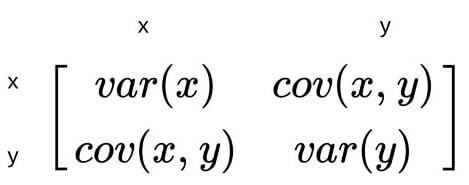
Simulation: .rvs(mean, size)

  • mean: [2, 6]
  • size: 500
results=st.multivariate_normal.rvs(
    mean=[2, 6], size=500)

df_results=pd.DataFrame( {"Price":results[:, 0], "Demand":results[:, 1]}) sns.pairplot(df_results)

Pairplot of price and demand sampling results

Monte Carlo Simulations in Python

Covariance matrix

  • Captures the variance and covariances of variables
  • Definition using two random variables $x$ and $y$:

covariance matrix structure

Example:

df_historical.cov()
|        | Price     | Demand   |
|--------|-----------|----------|
| Price  | 0.920545  | -0.85578 |
| Demand | -0.855780 | 0.98417  |
Monte Carlo Simulations in Python

Multivariate normal sampling with defined covariance

Simulation: .rvs(mean, size)

  • mean: [2, 6]
  • size: 500
  • cov: np.array([[1, -0.9], [-0.9, 1]])
cov_mat = np.array([[1,-0.9], [-0.9,1]])
results = st.multivariate_normal.rvs(
    mean=[2,6], size=500, cov=cov_mat)

df_results = pd.DataFrame( {"Price":results[:,0], "Demand":results[:,1]}) sns.pairplot(df_results)

a pairplot of the results

Monte Carlo Simulations in Python

Let's practice!

Monte Carlo Simulations in Python

Preparing Video For Download...