What is a rolling window?
Manipulating Time Series Data in R

Harrison Brown
Graduate Researcher in Geography
Windows

Windows
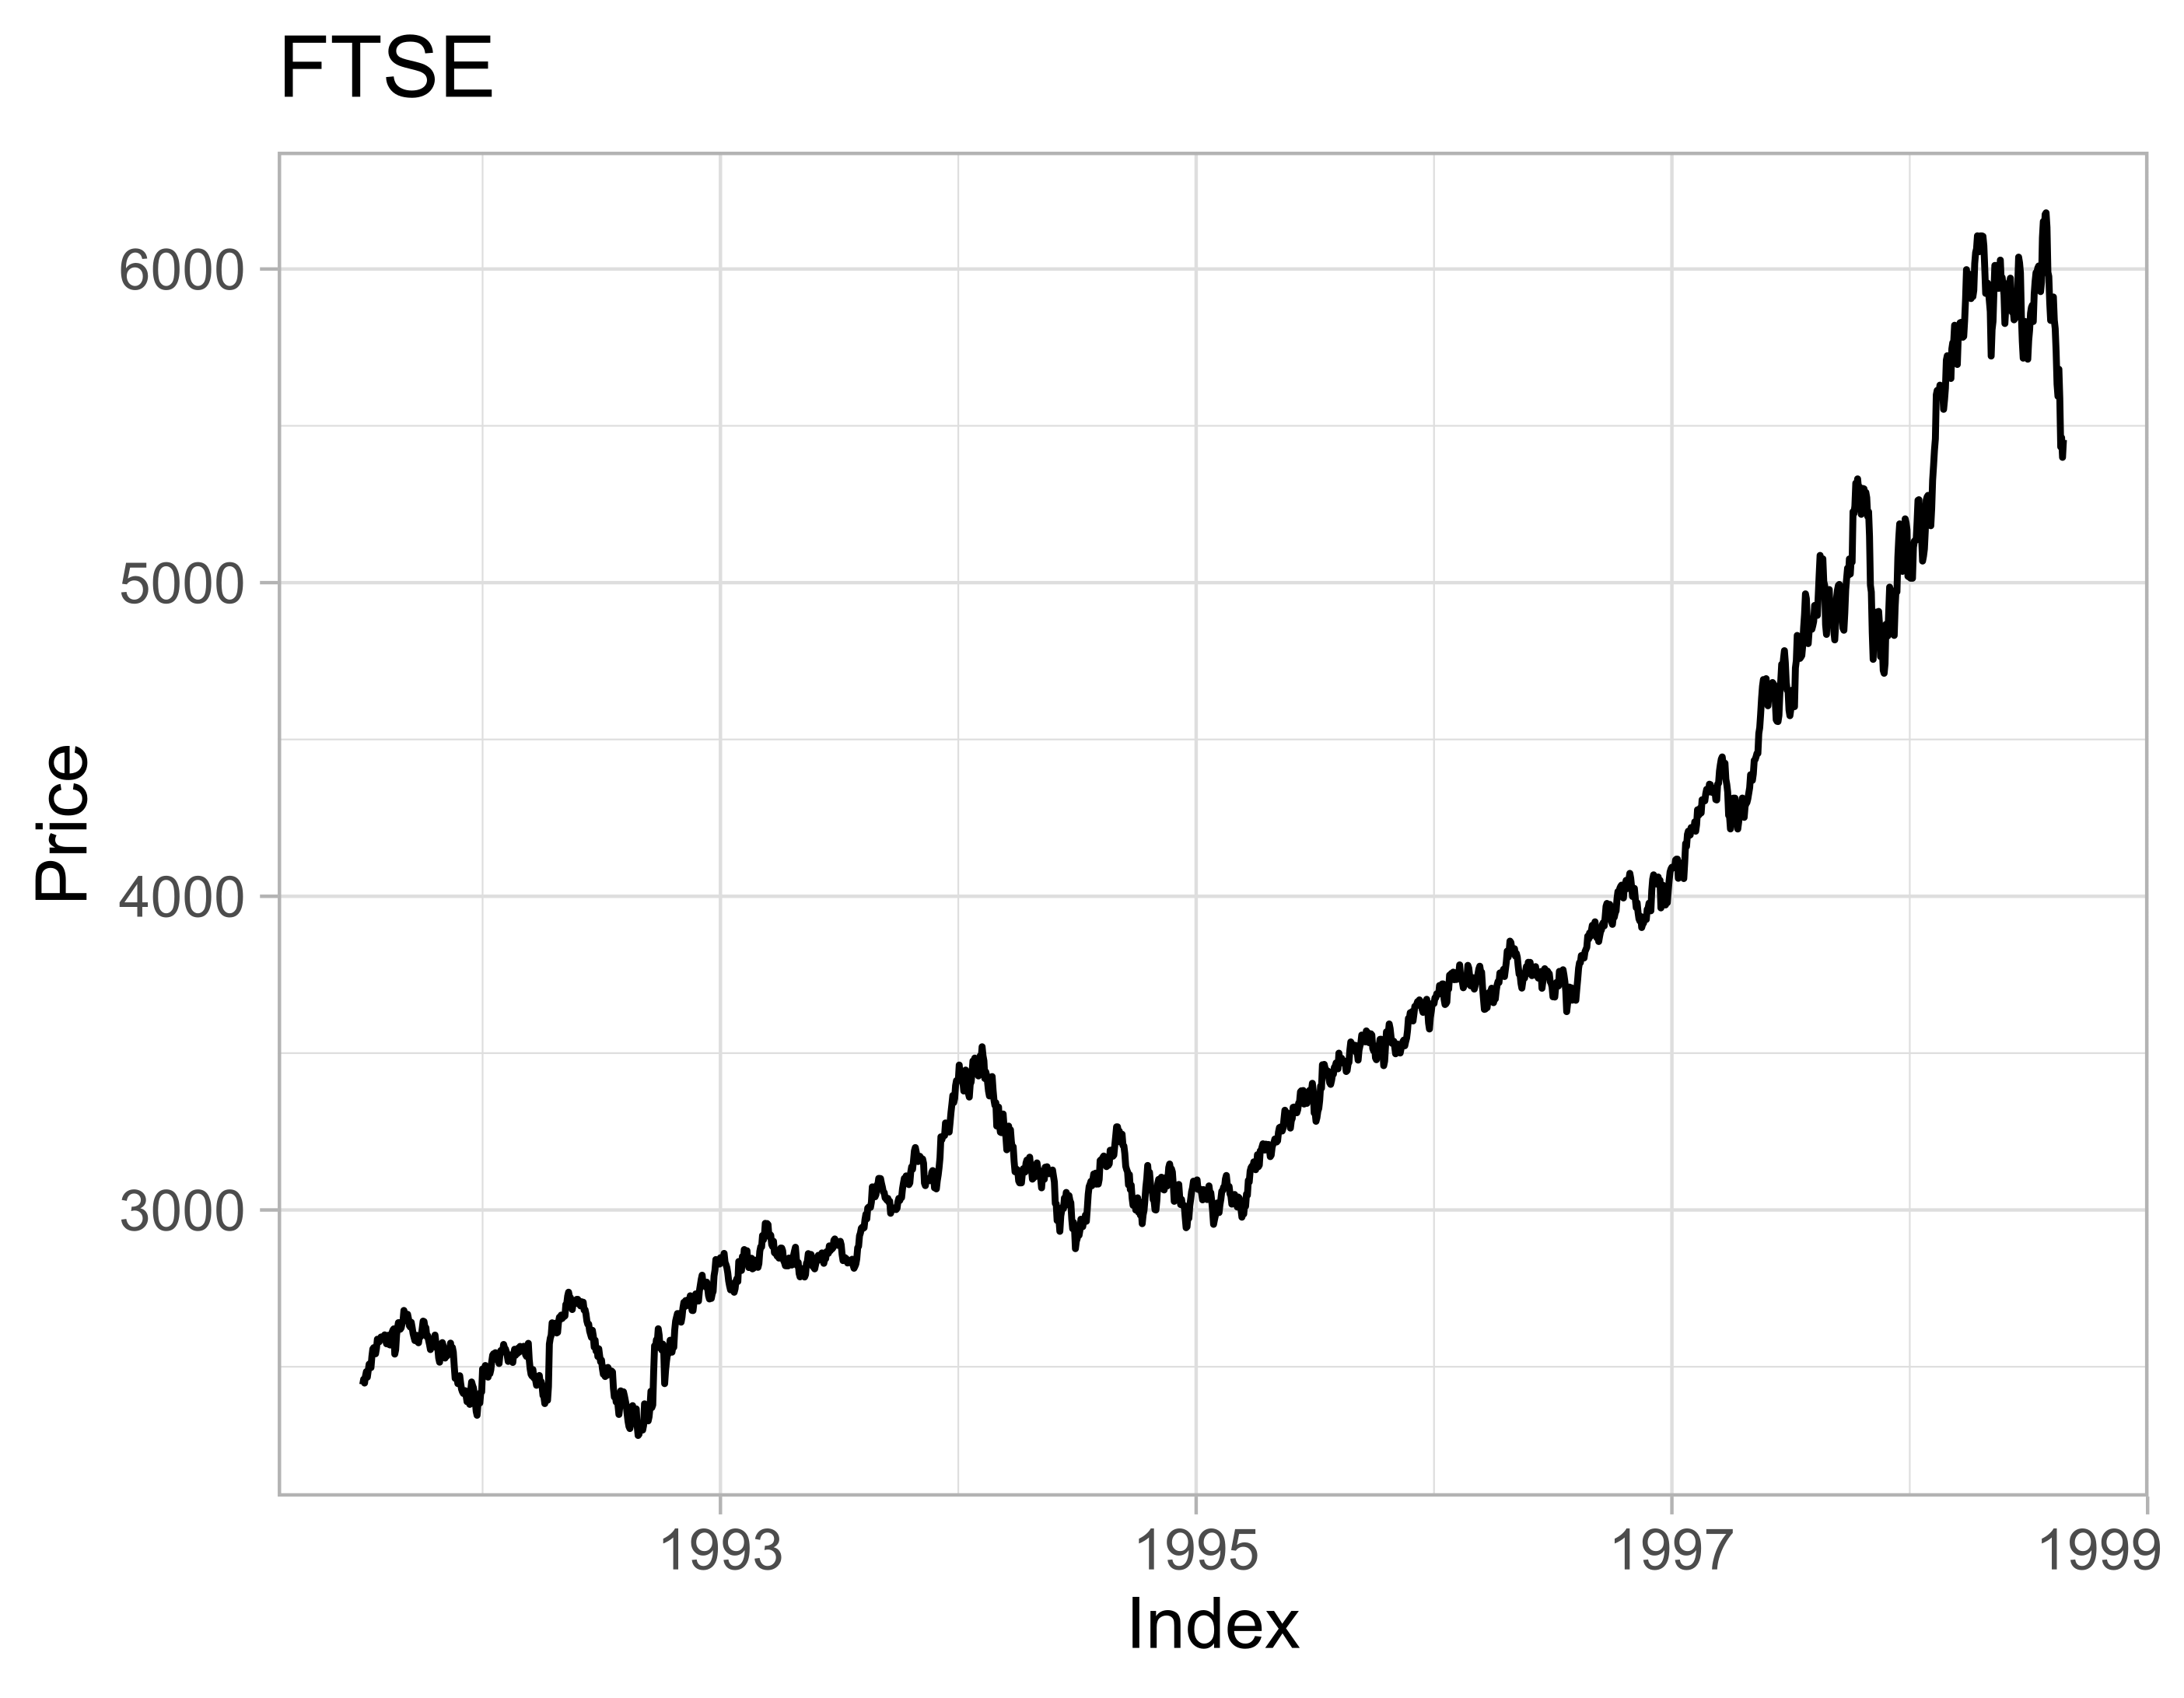
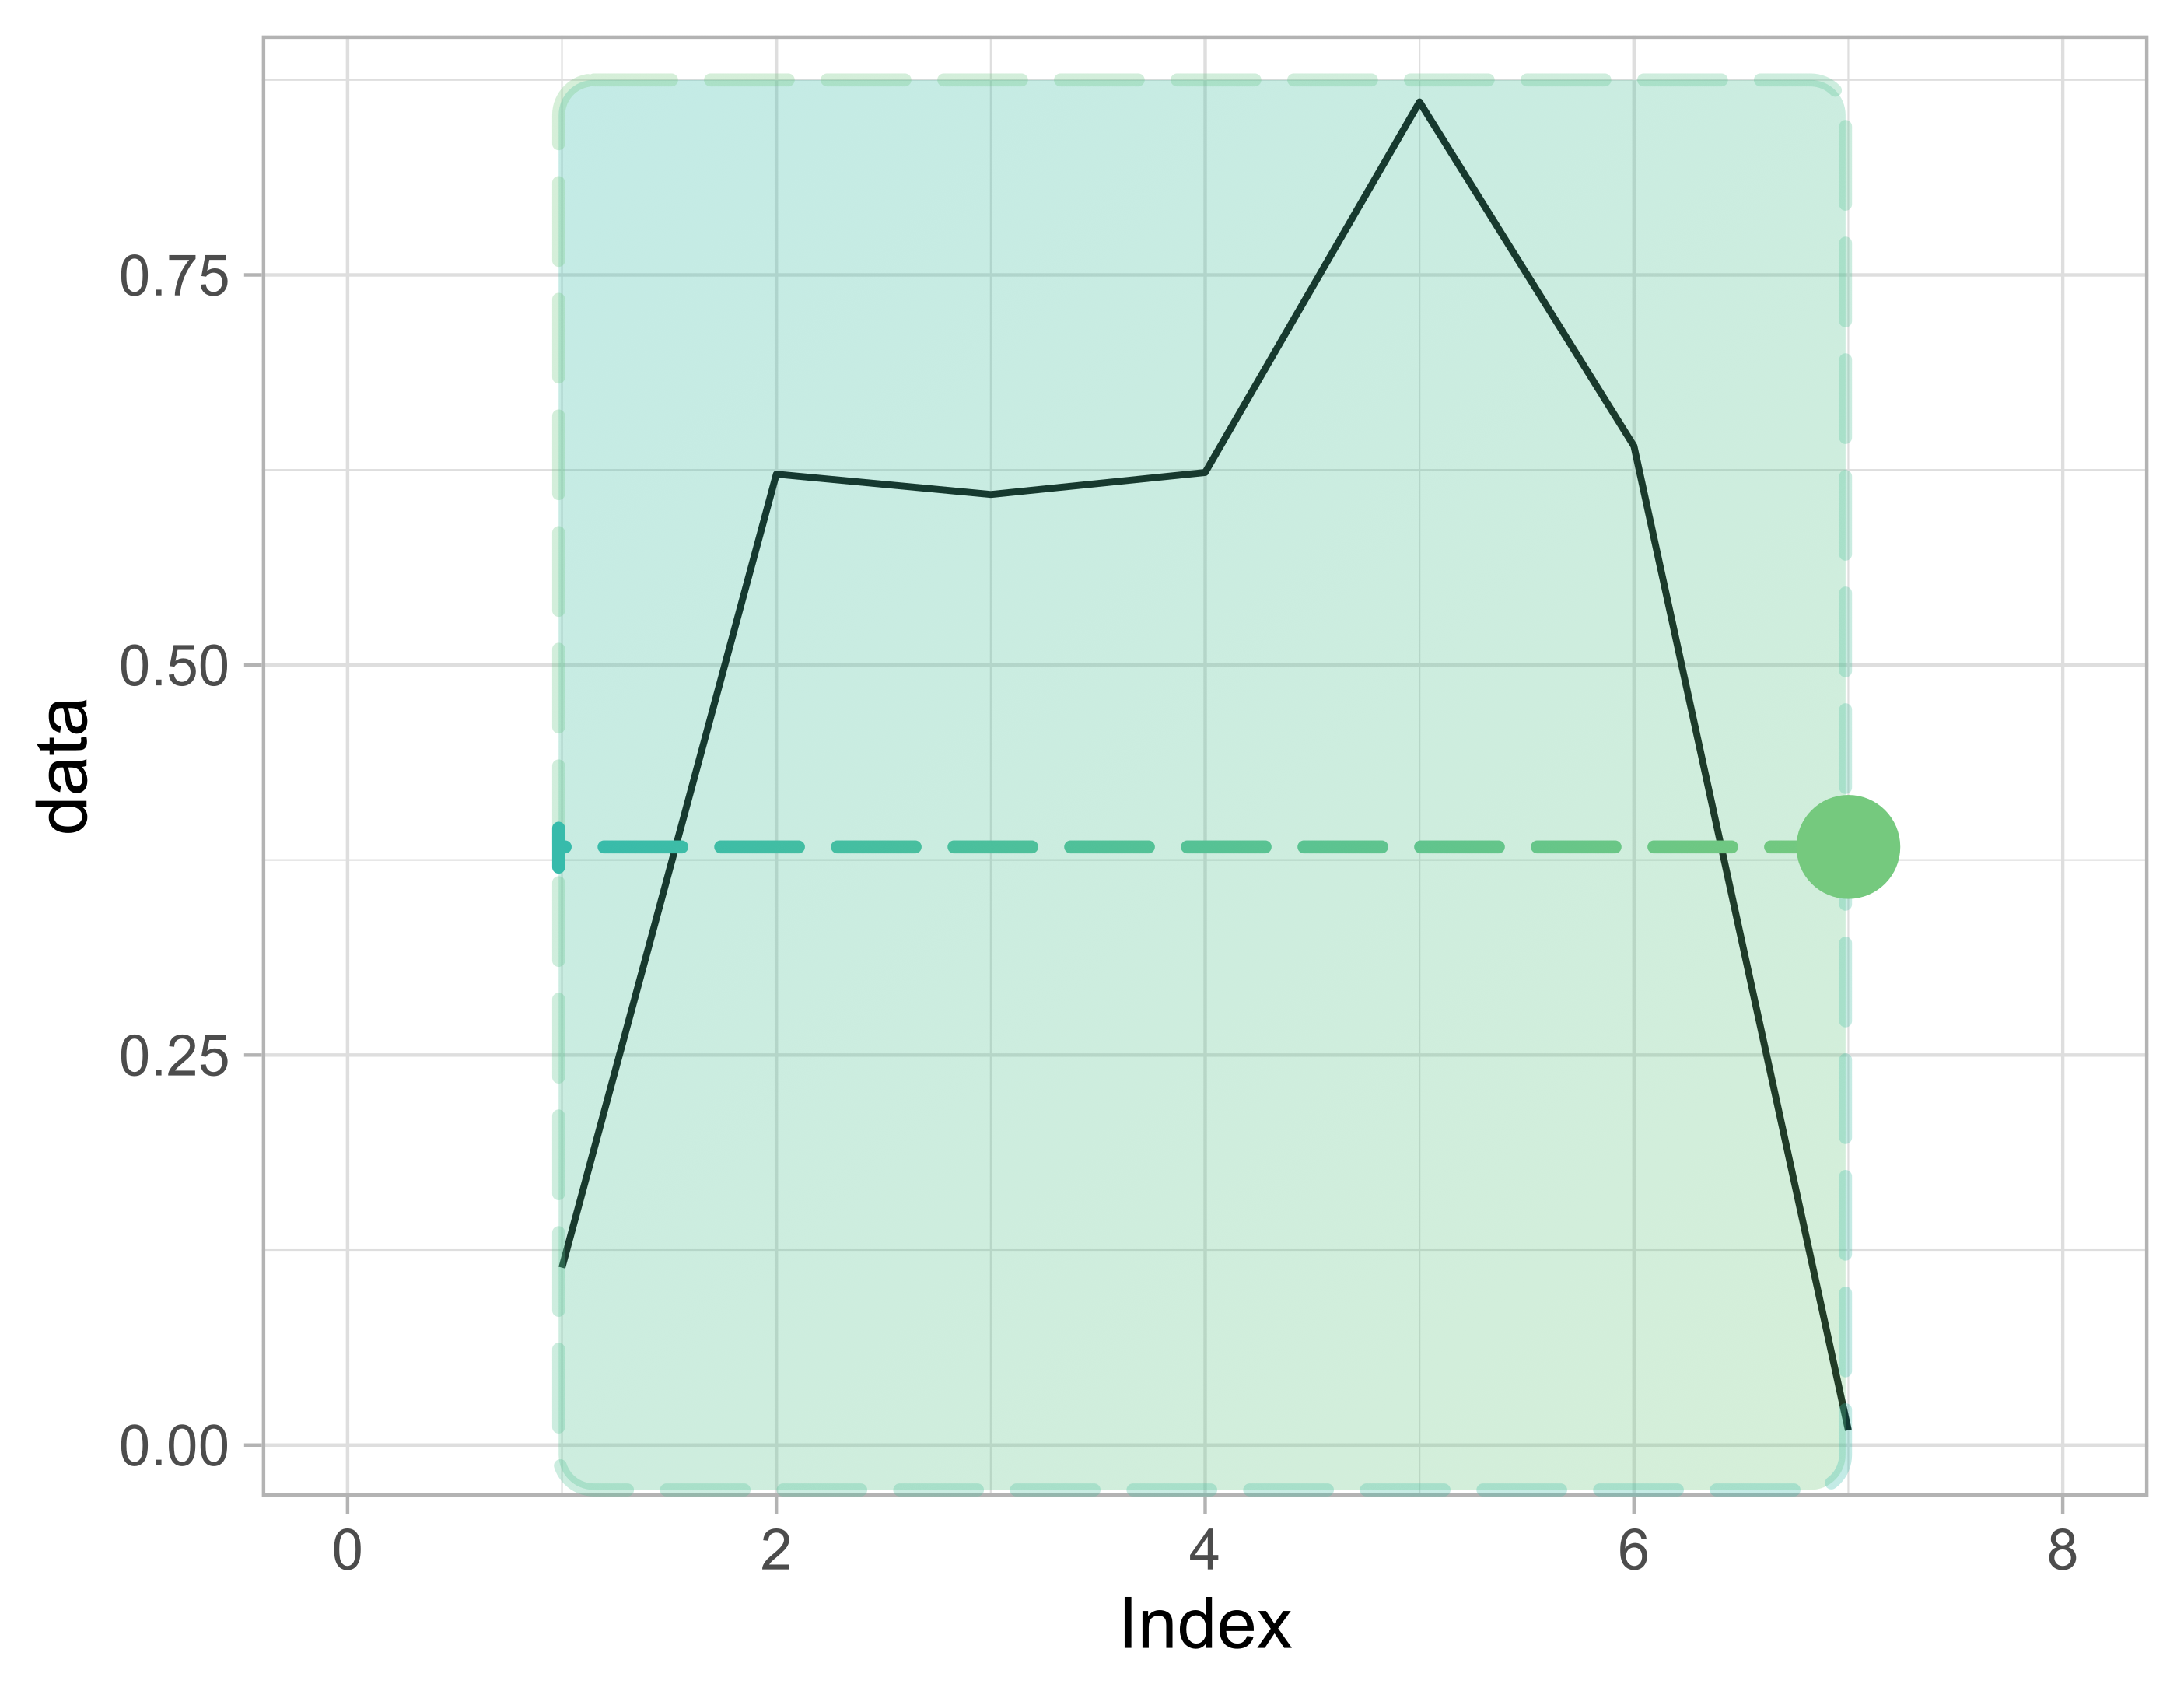
Original data:
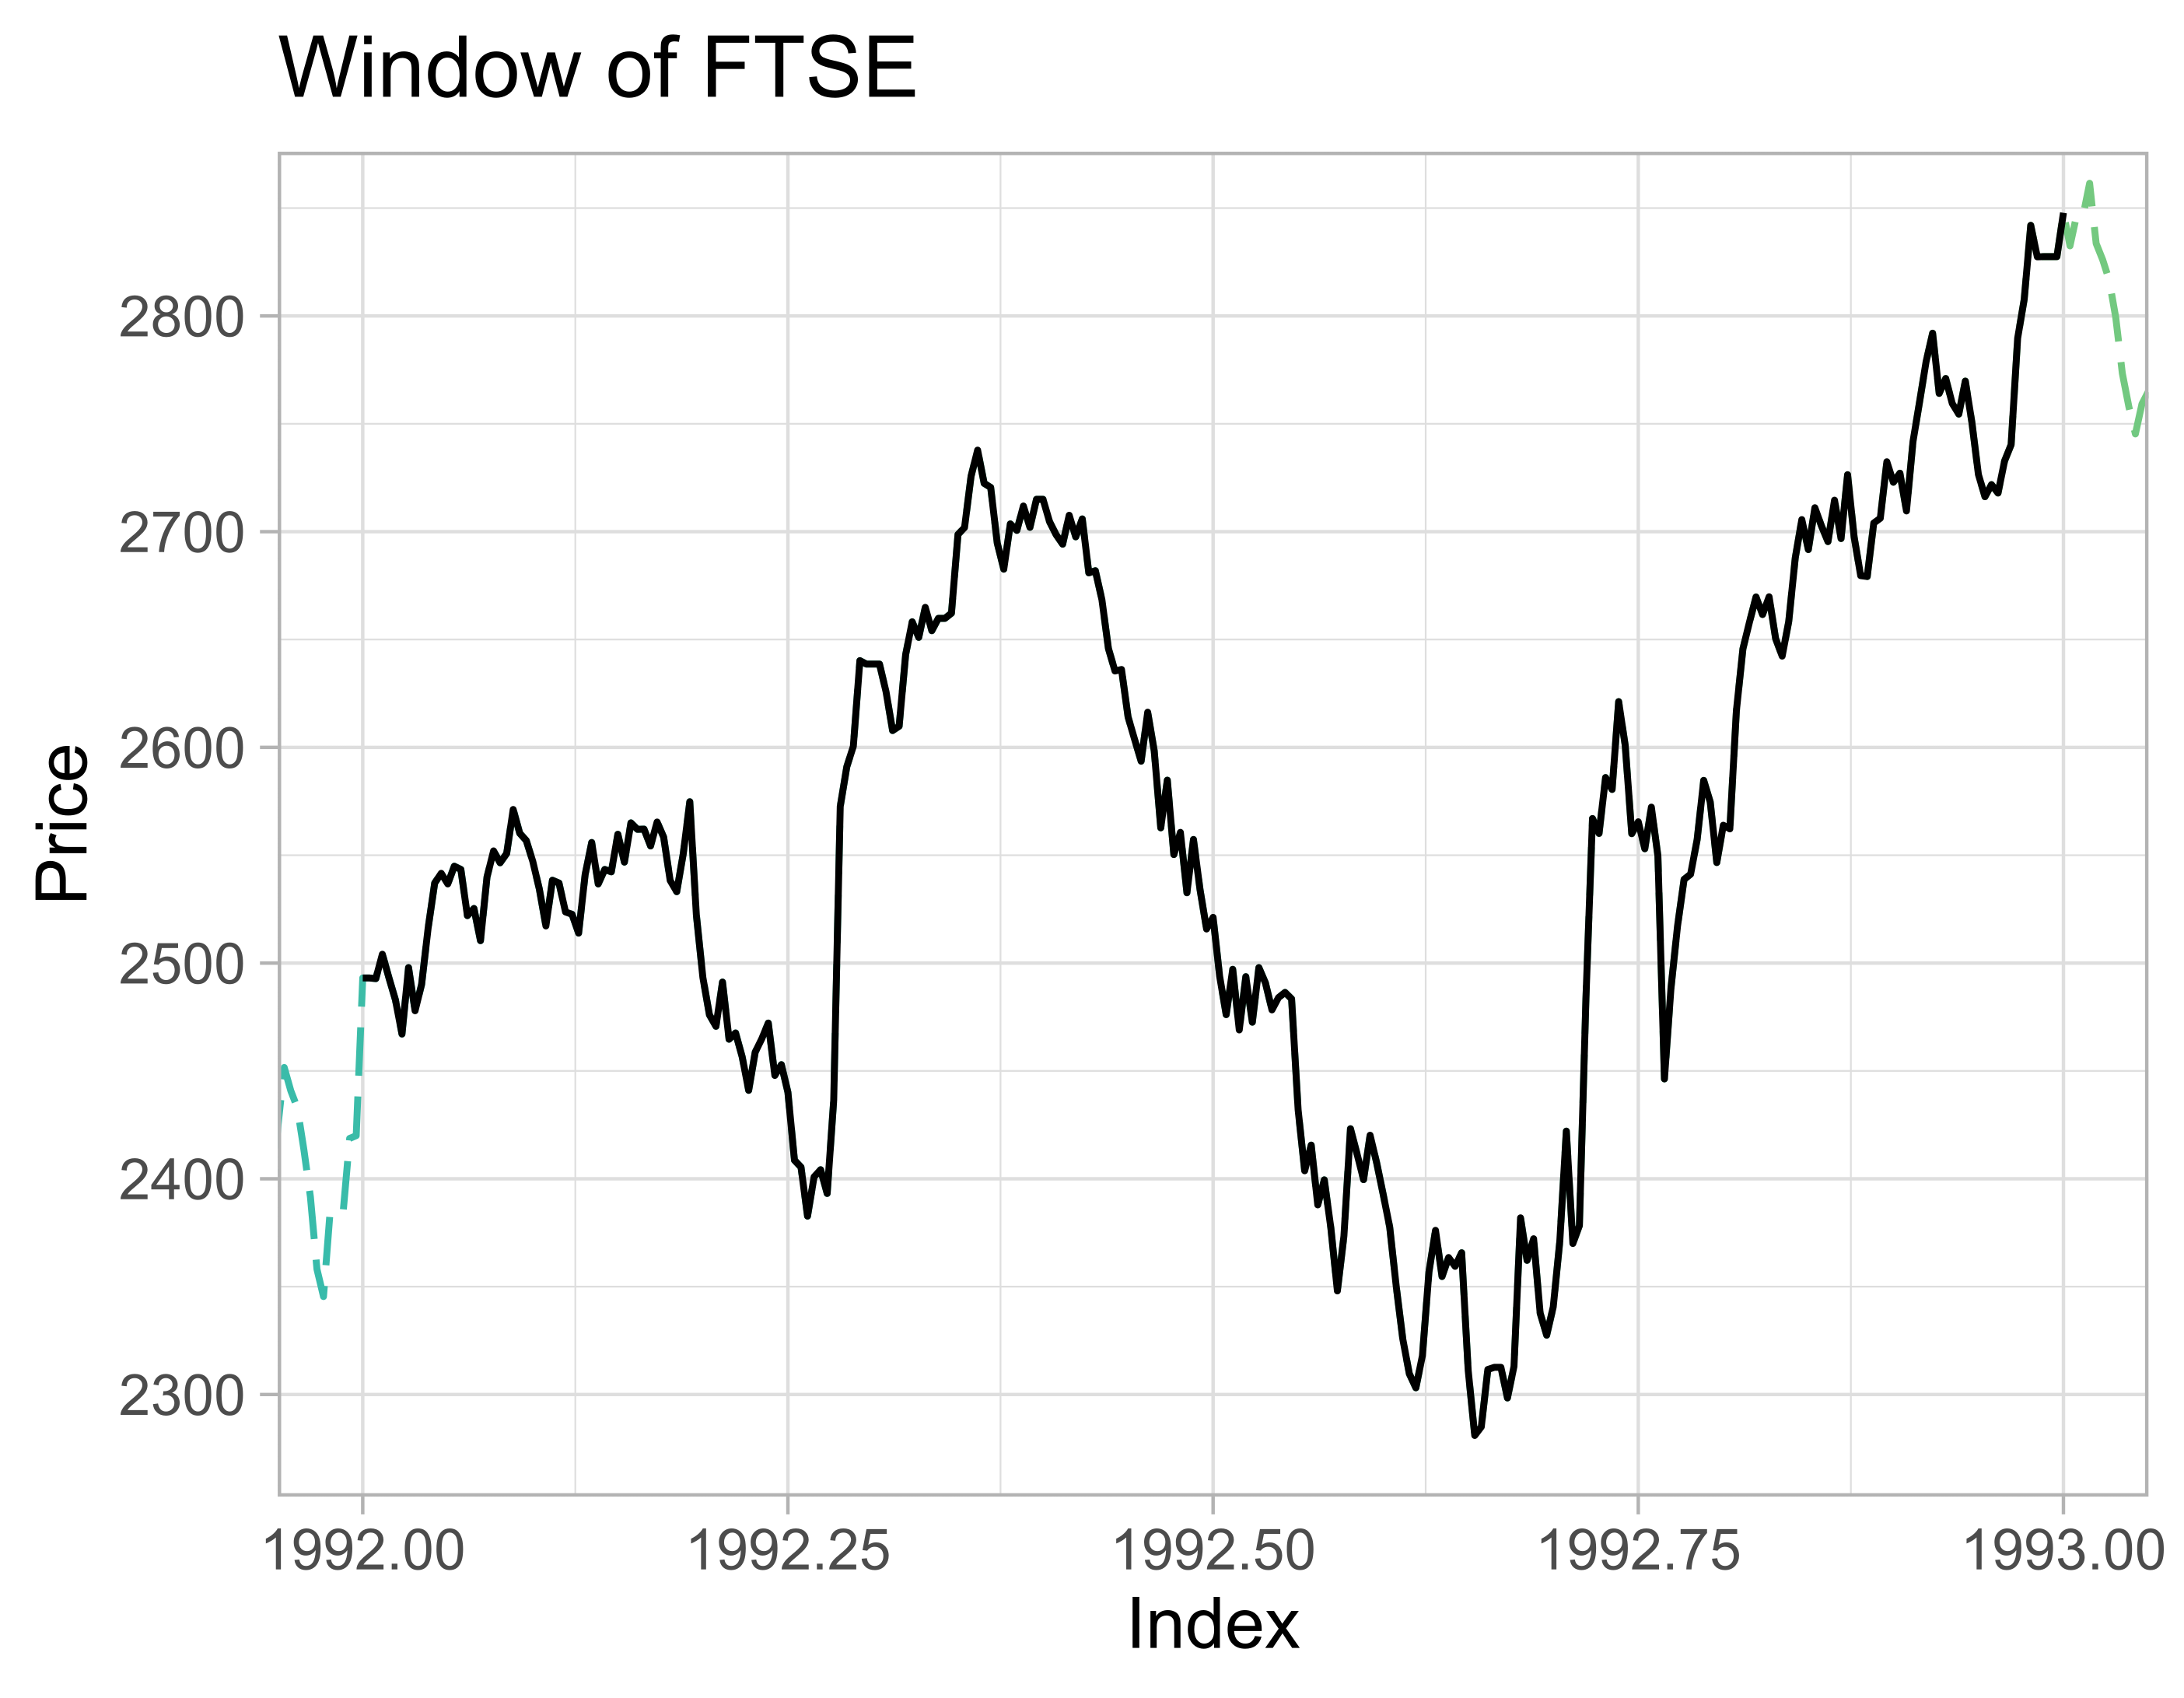
Window:
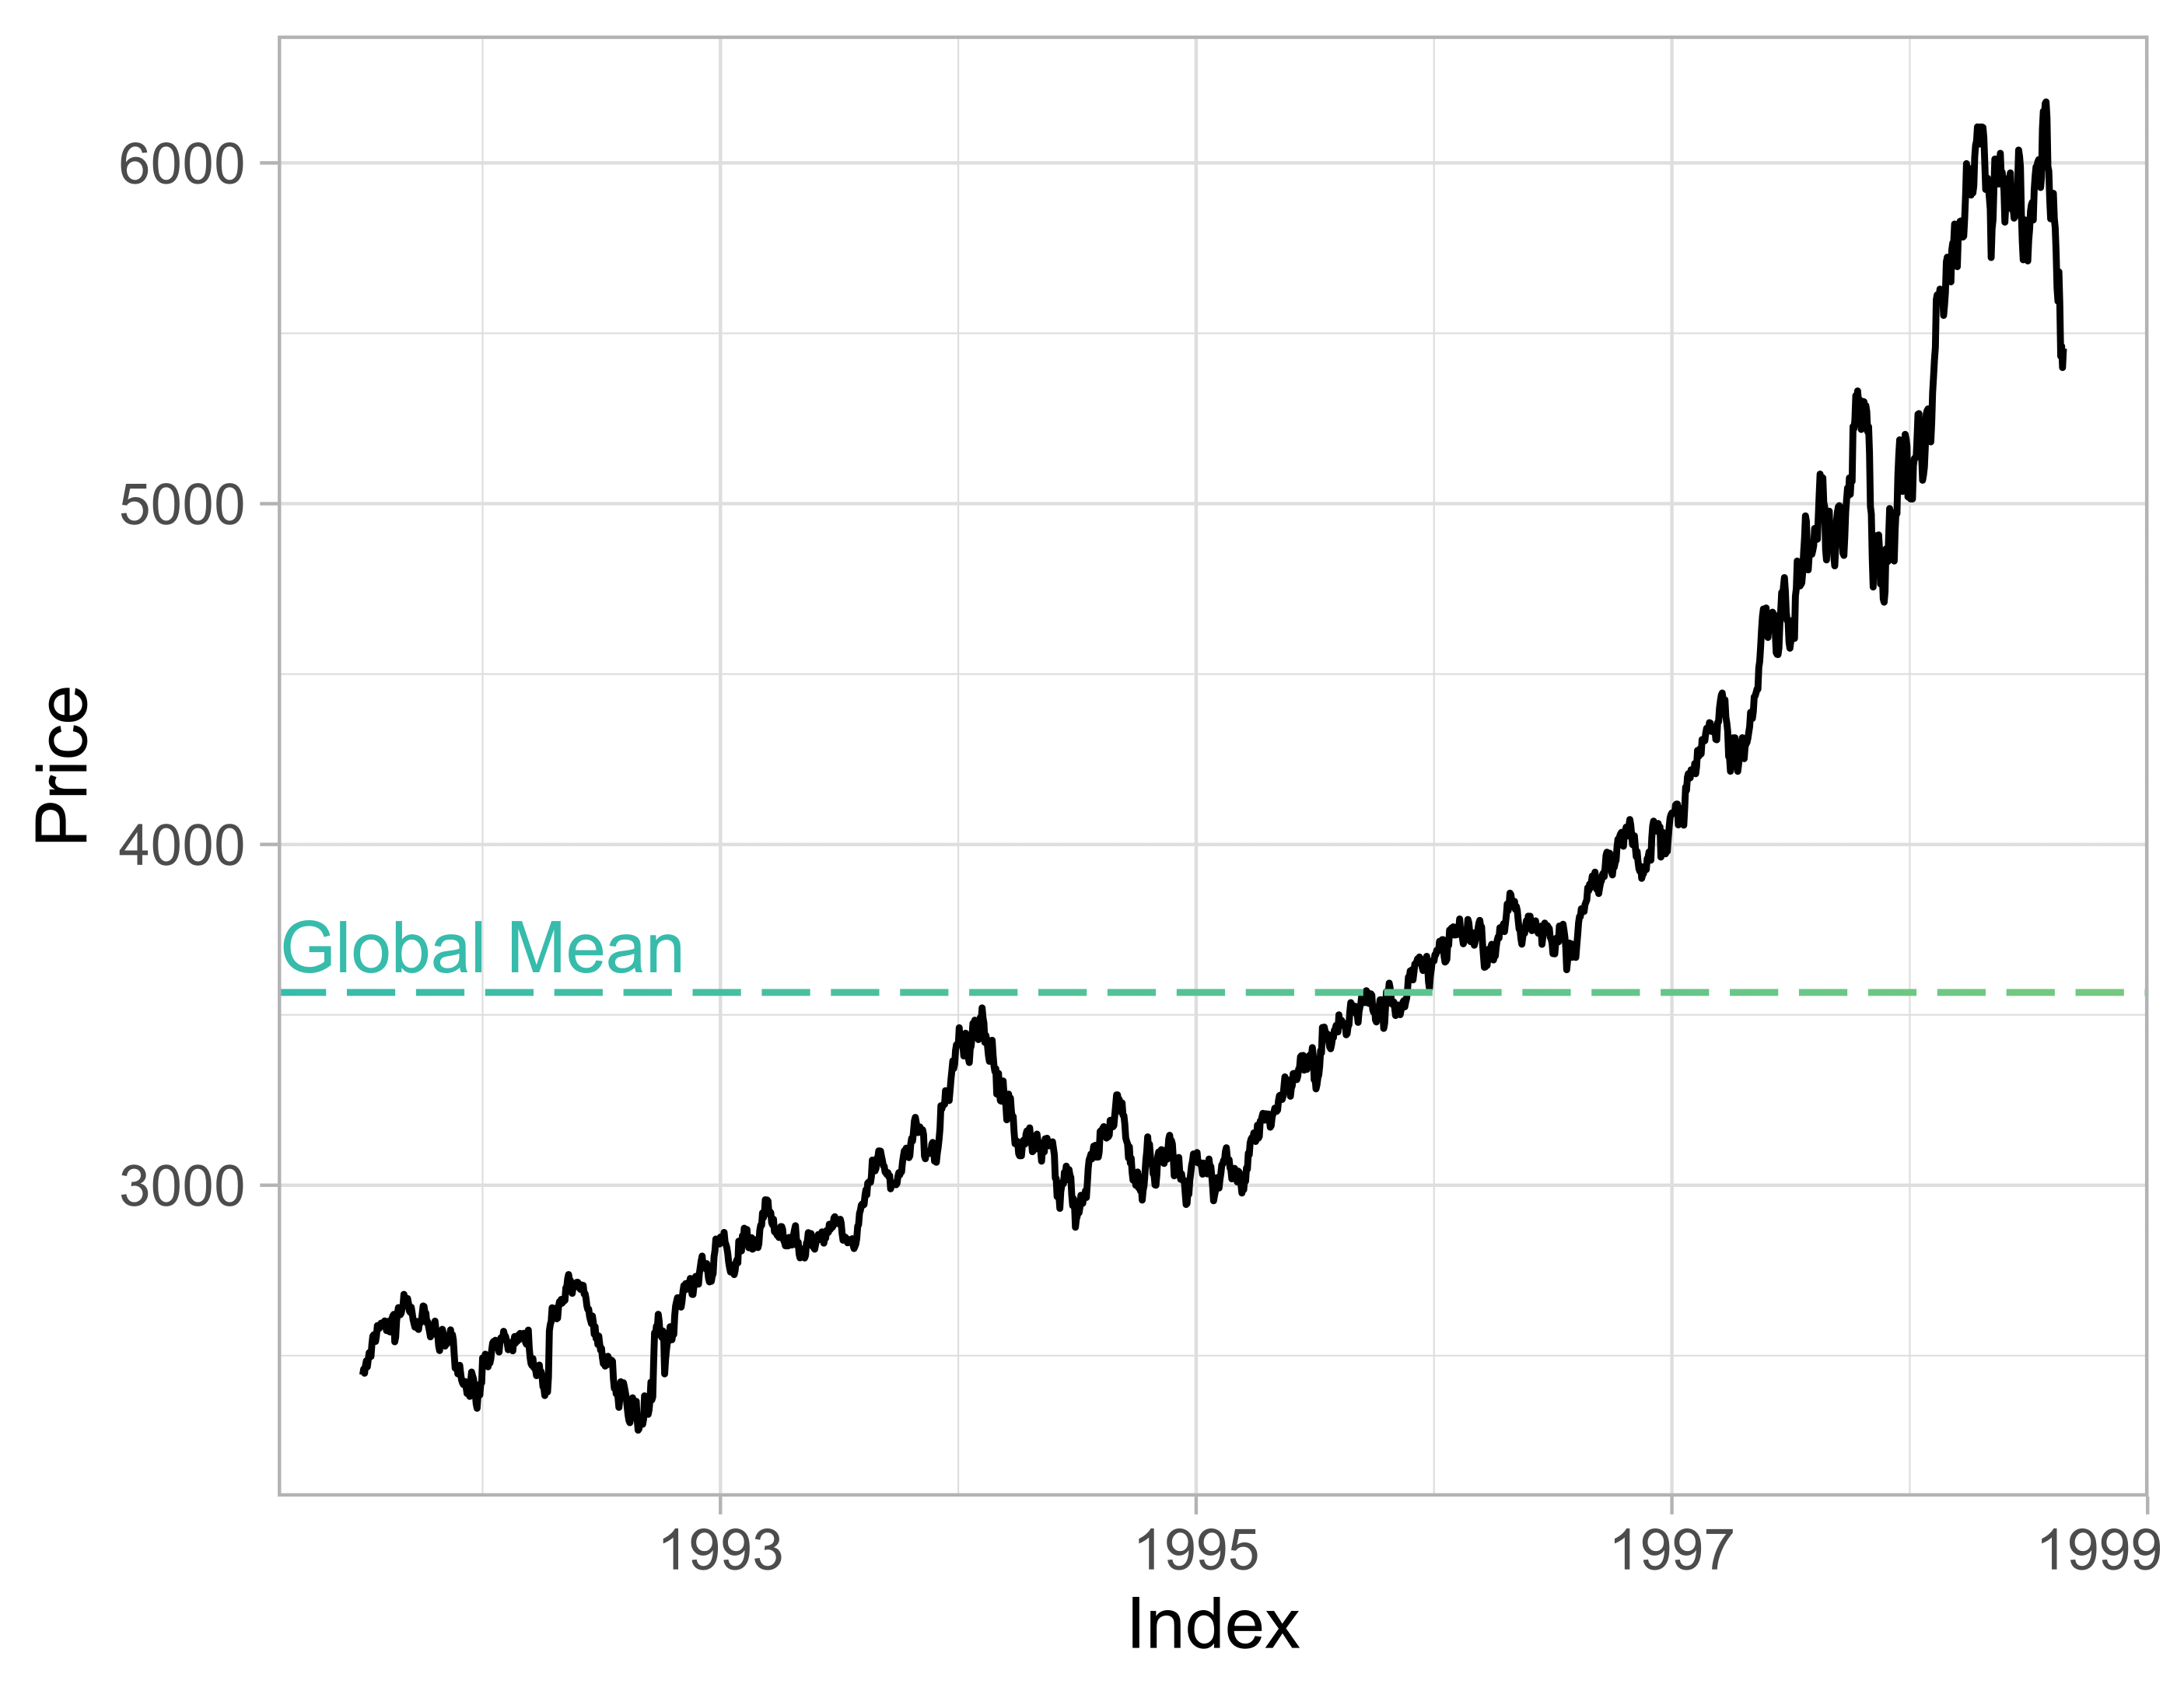
Global summary statistics
Global mean:
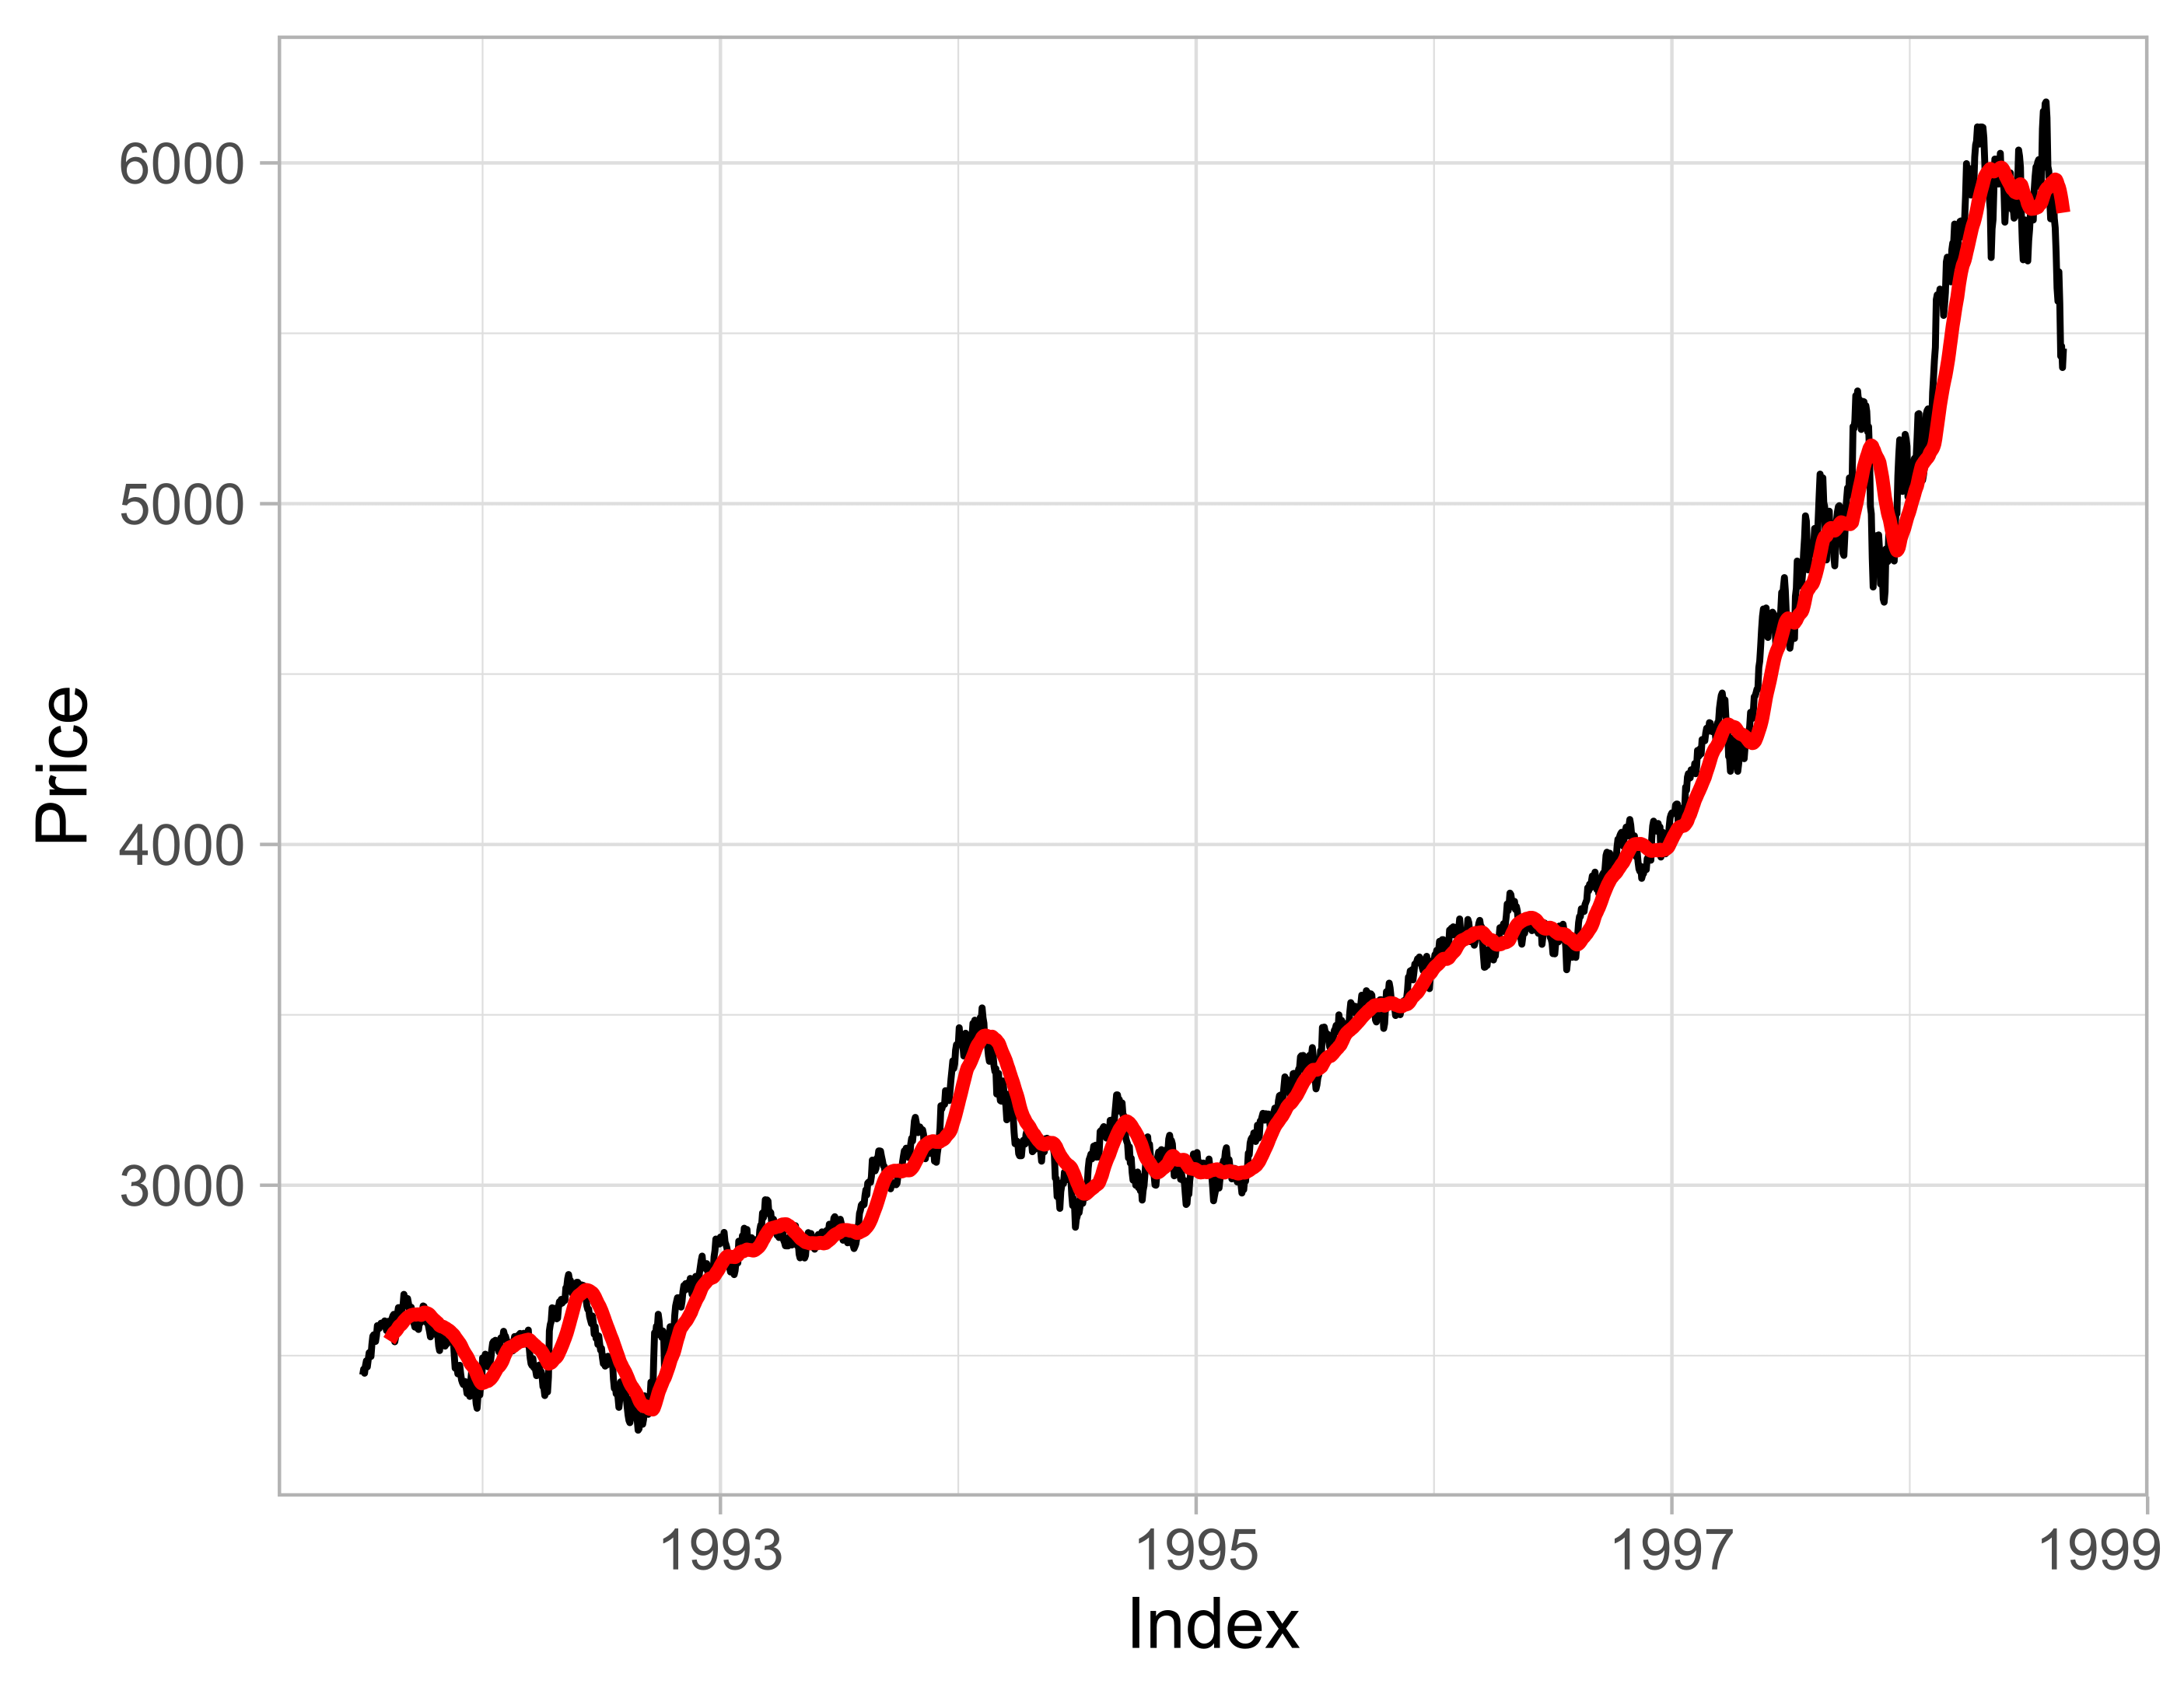
Rolling window
- Measure of how statistics change as the data moves in time
- Rolling average plotted in red, on top of original data
Window alignment
Window alignment
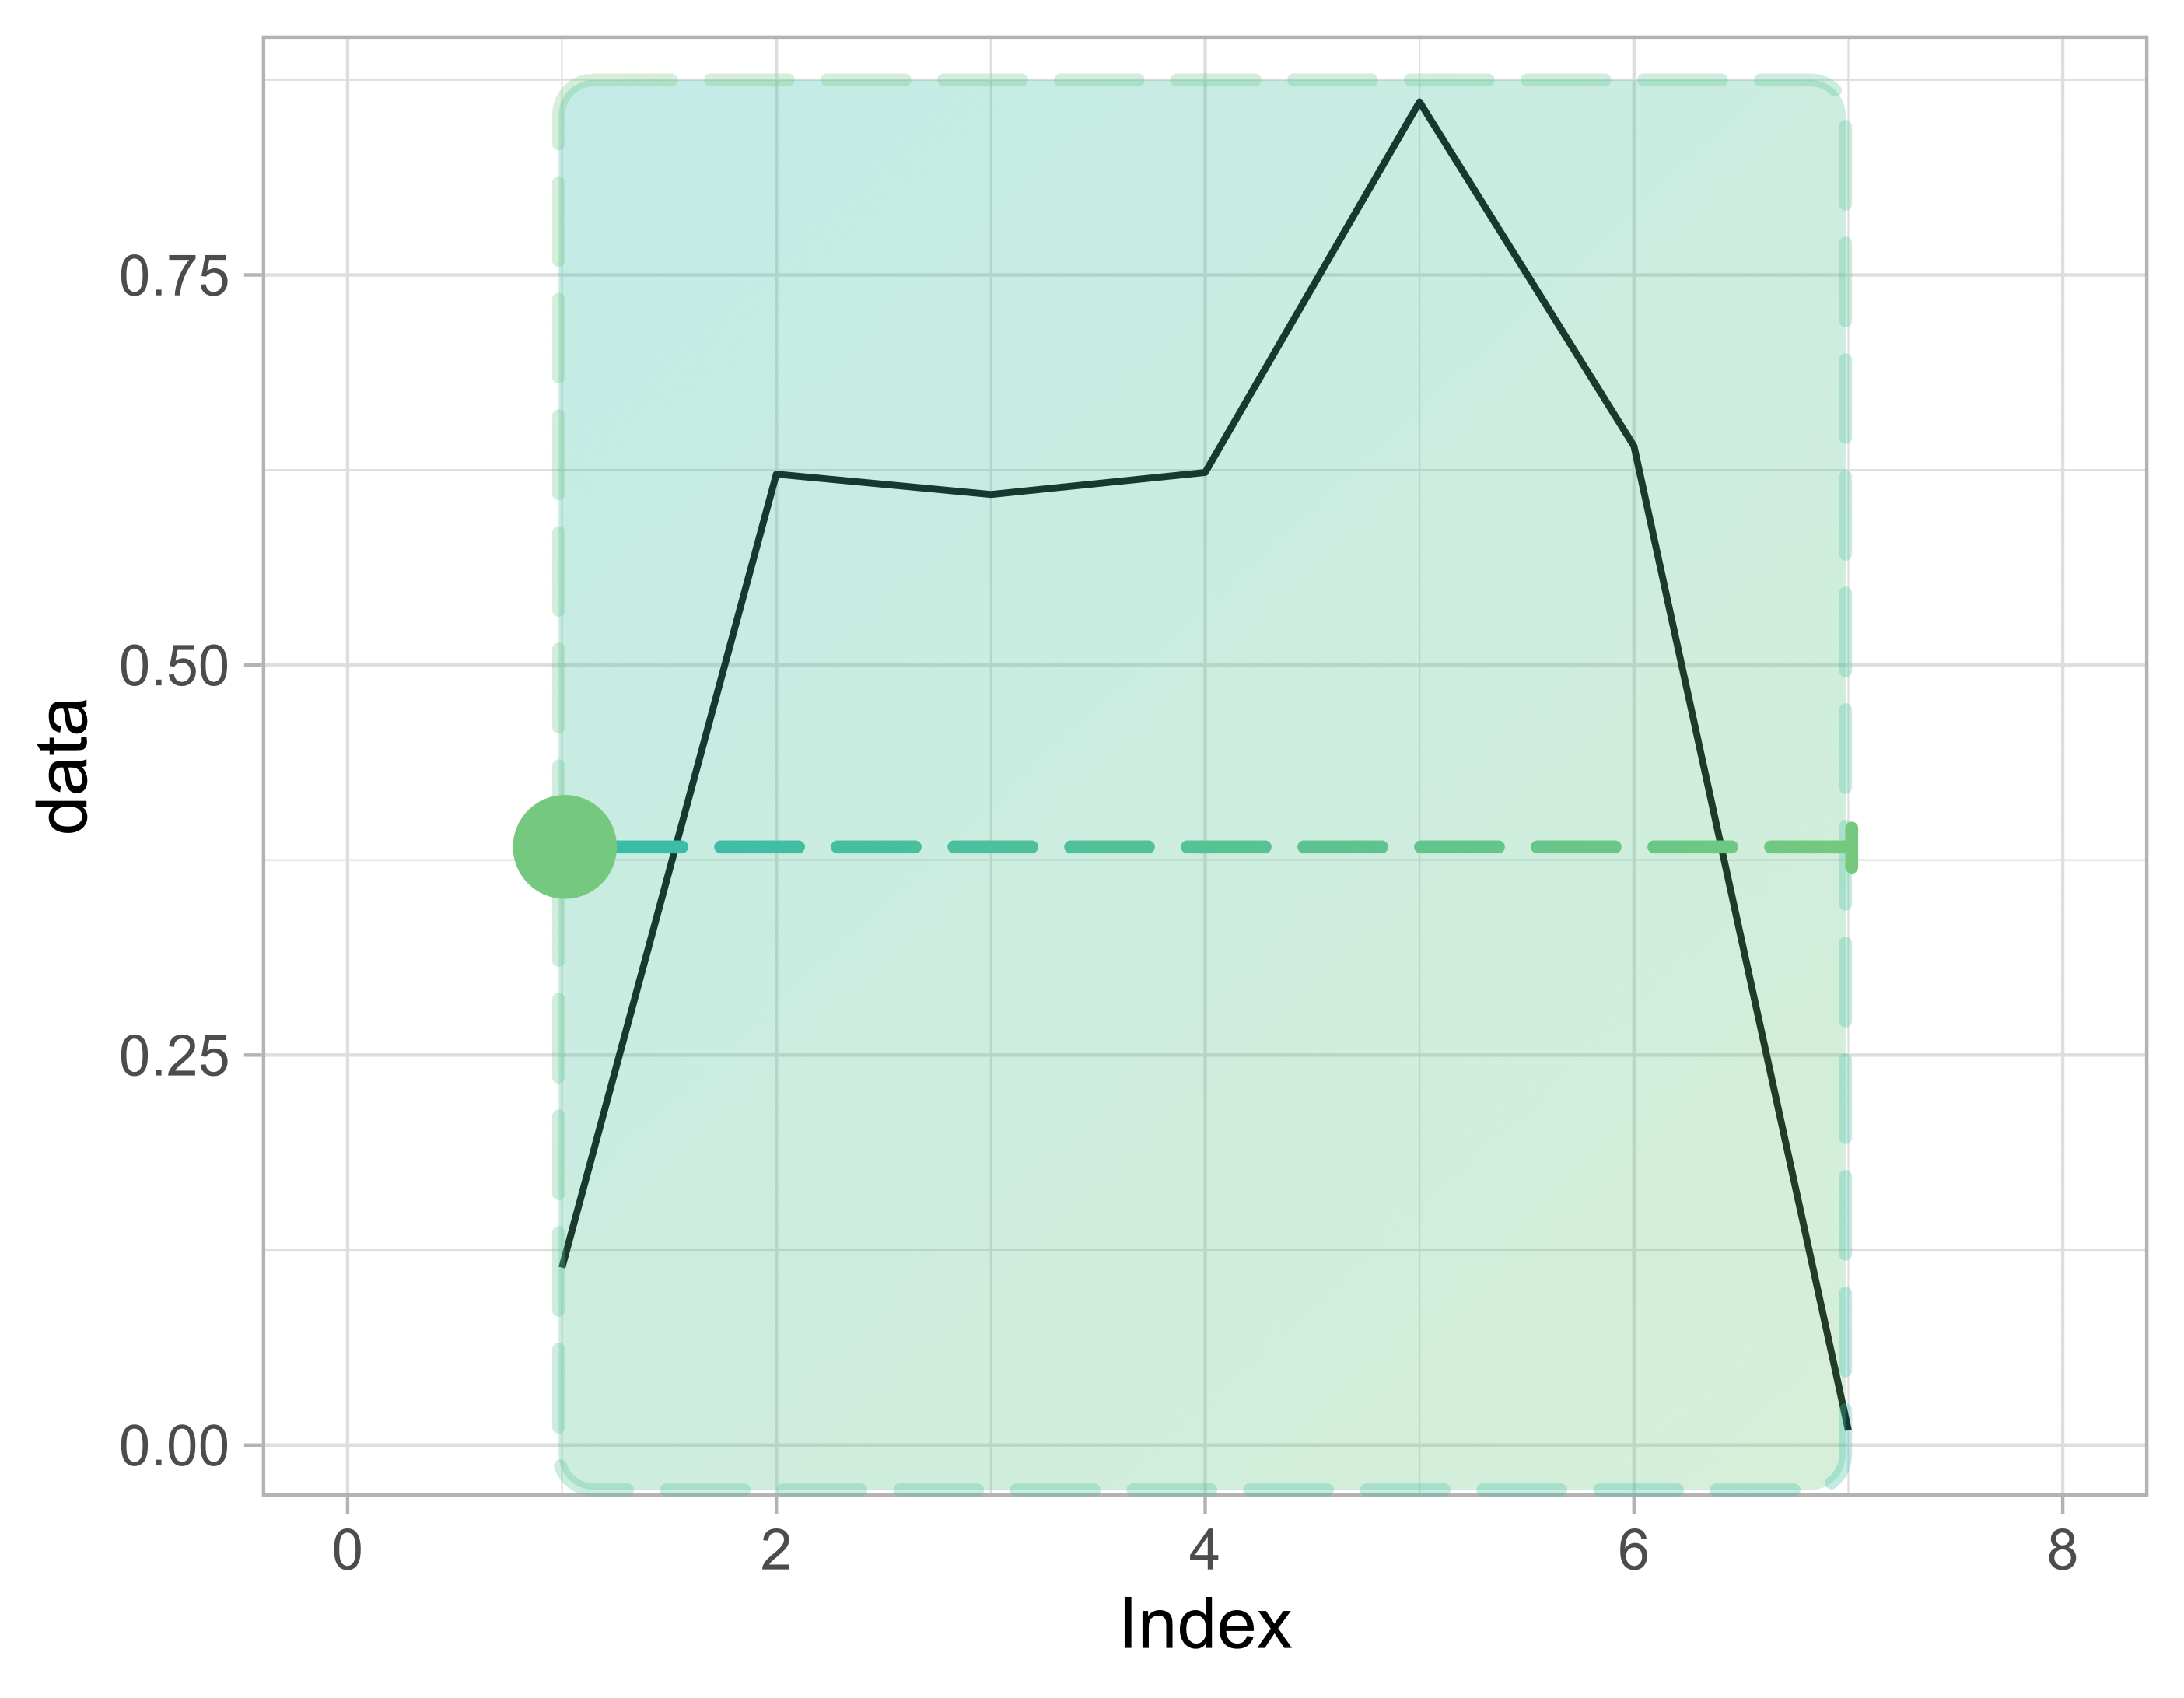
Window alignment


