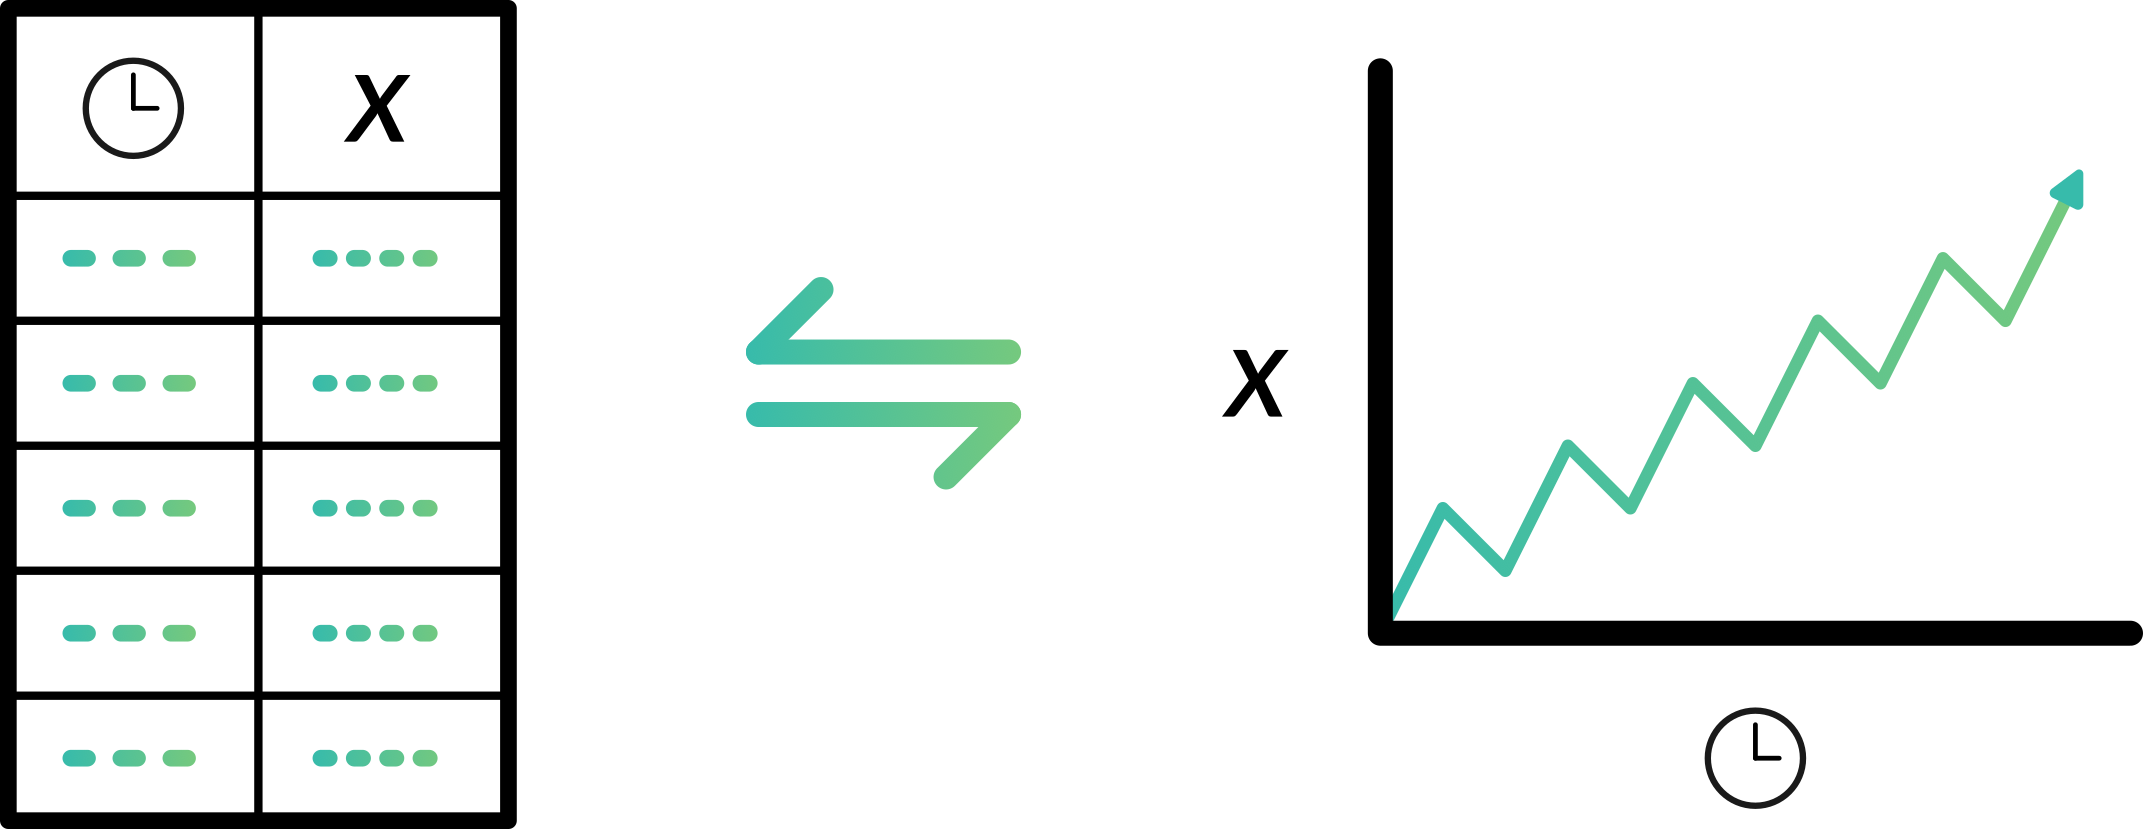
Manipulating Time Series Data in R
Harrison Brown
Graduate Researcher in Geography
data.frame
:
data$dates
geom_*()
only:ggplot(example_dataframe,
aes(x = dates, y = values)) +
geom_line()
zoo
:
index(data)
geom_*()
and autoplot()
:ggplot(maunaloa,
aes(x = Index, y = maunaloa)) +
geom_line()
# Or...
autoplot(maunaloa)
head(prices)
date value
1 2013-01-01 4.88
2 2013-01-02 5.03
3 2013-01-03 5.11
4 2013-01-04 4.77
5 2013-01-05 5.04
6 2013-01-06 5.05
my_dataframe$my_column
prices_zoo <-
zoo(x = prices$value,
order.by = prices$date)
prices_zoo
2013-01-01 4.88
2013-01-02 5.03
2013-01-03 5.11
2013-01-04 4.77
2013-01-05 5.04
2013-01-06 5.05
data_df <-
data.frame(index(my_zoo),
coredata(my_zoo))
zoo::fortify.zoo()
fortify.zoo(my_zoo)
Index var1 var2 var3 var4
1 1 1628.75 1678.1 1772.8 2443.6
2 2 1613.63 1688.5 1750.5 2460.2
3 3 1606.51 1678.6 1718.0 2448.2
4 4 1621.04 1684.1 1708.1 2470.4
5 5 1618.16 1686.6 1723.1 2484.7
6 6 1610.61 1671.6 1714.3 2466.8
...
Manipulating Time Series Data in R