Imputing missing values
Manipulating Time Series Data in R

Harrison Brown
Graduate Researcher in Geography
Imputation
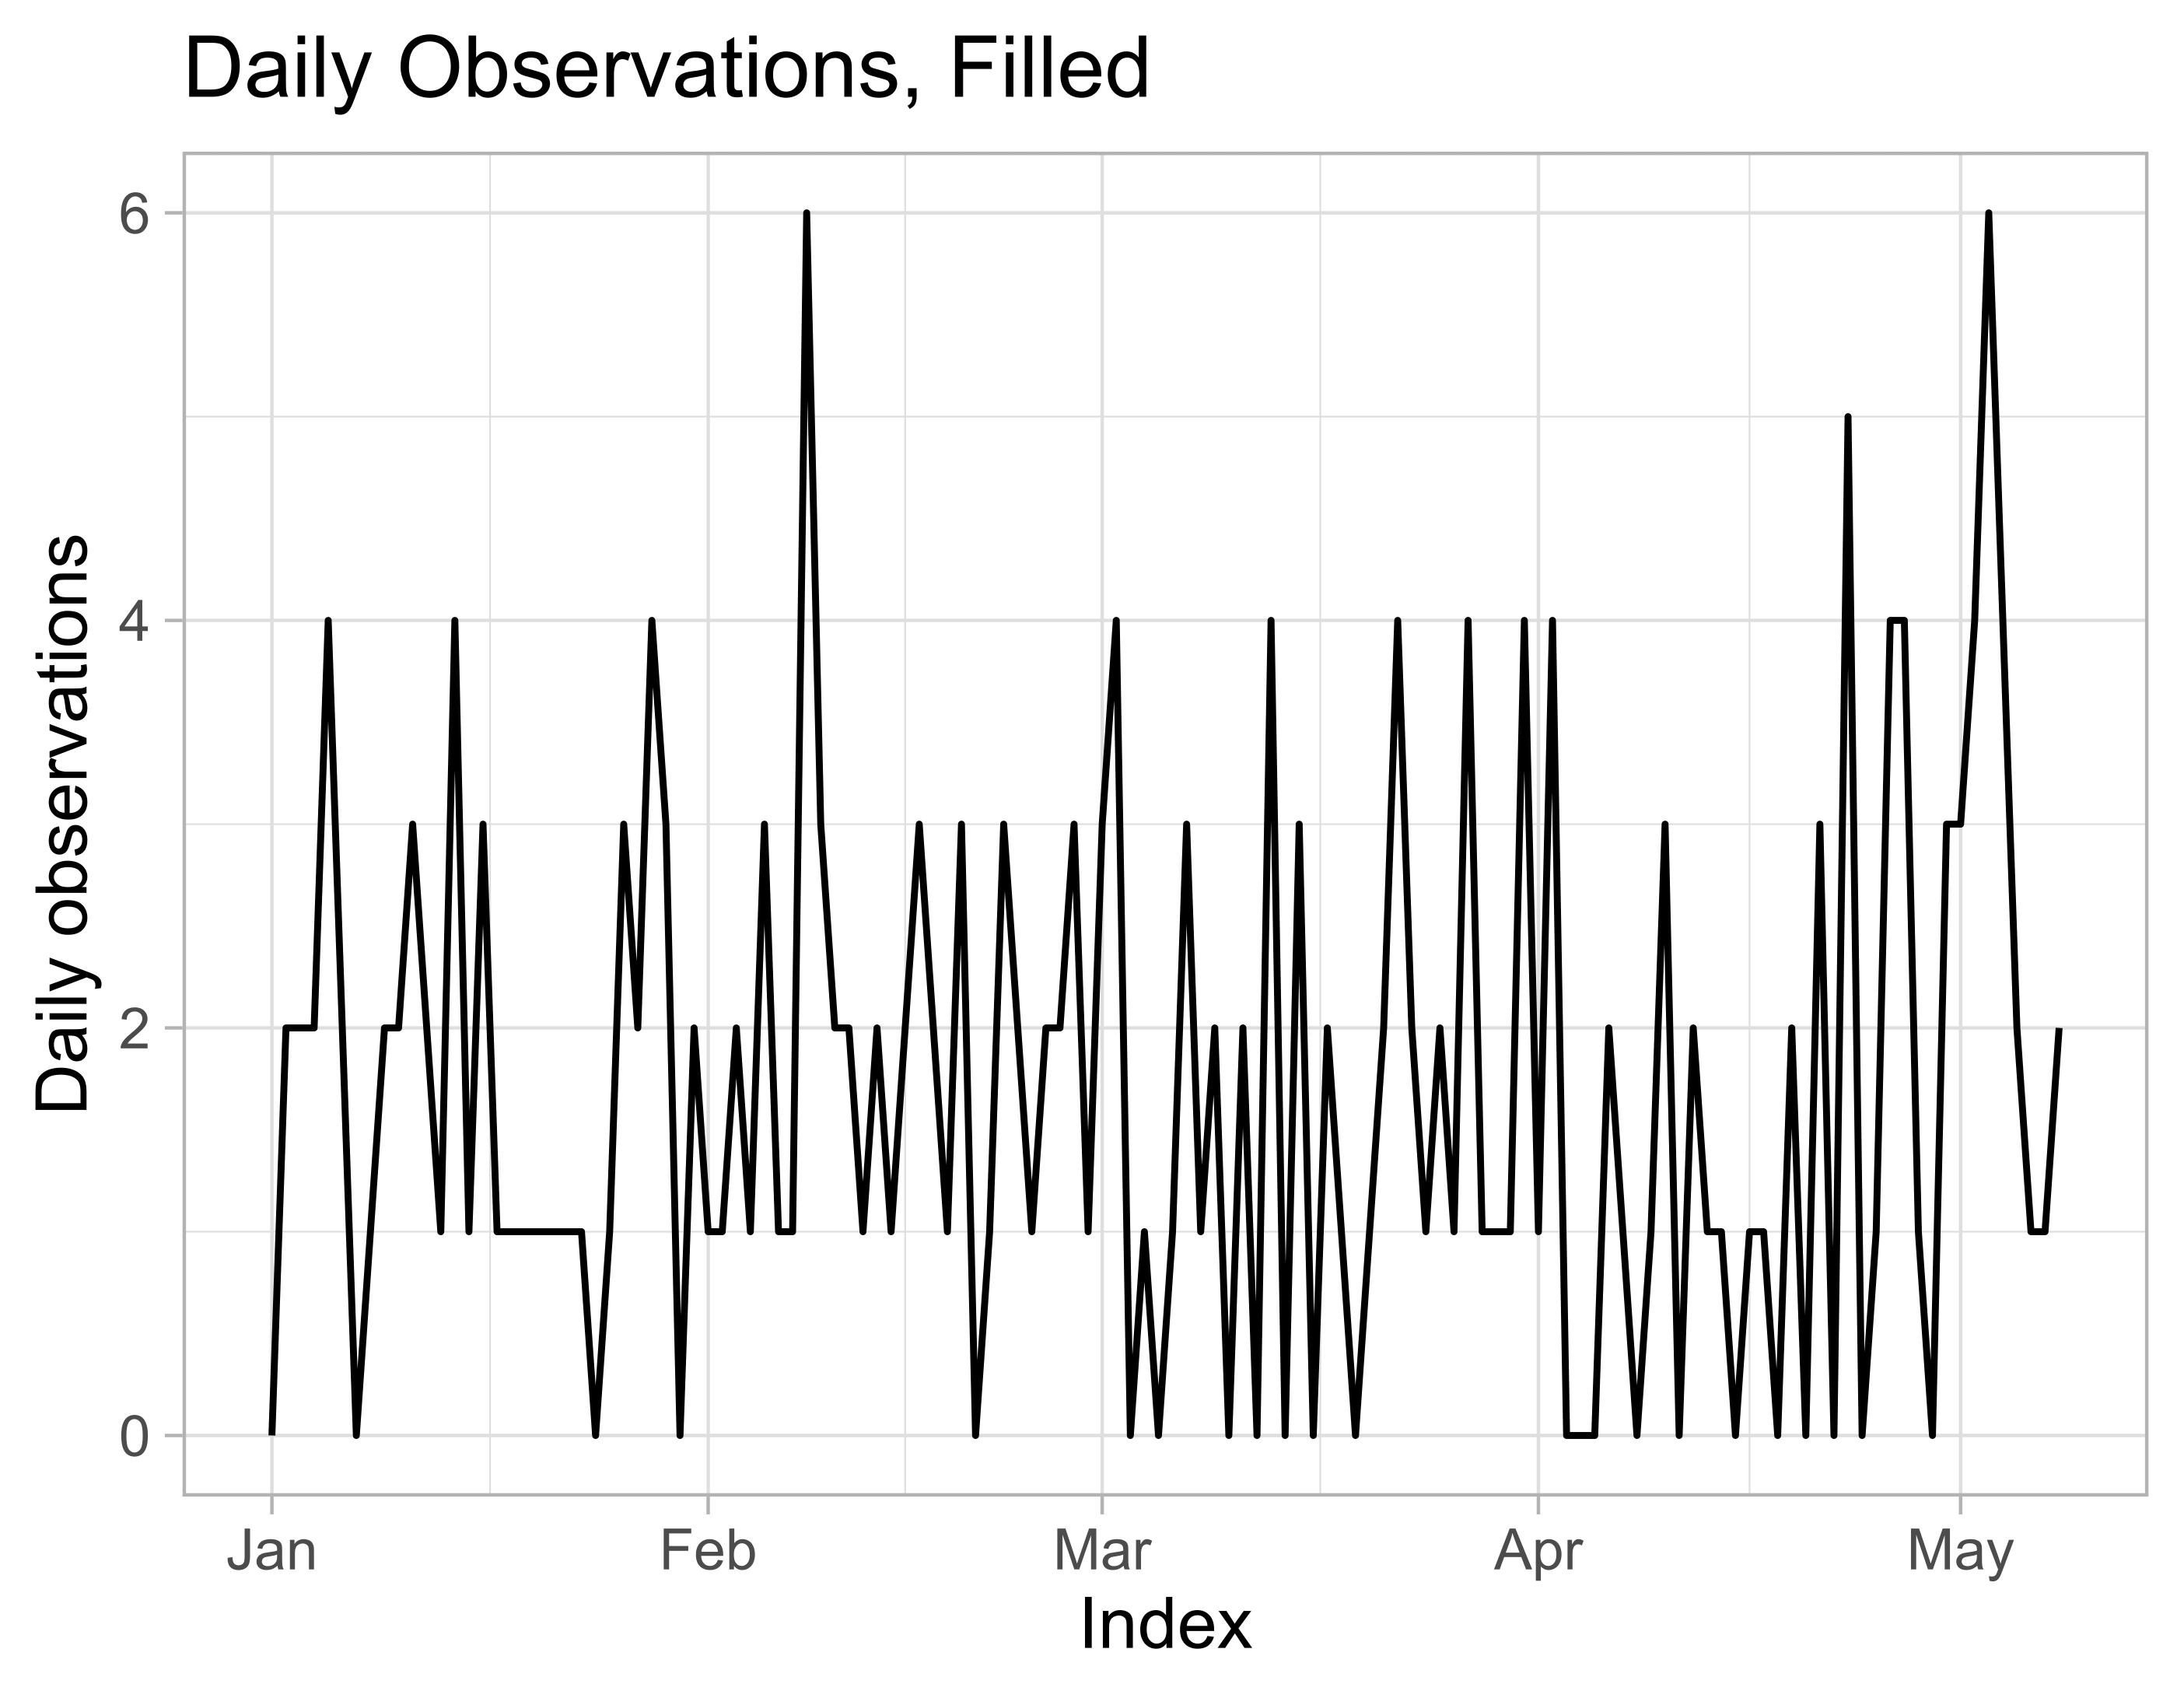
na.fill
na.fill
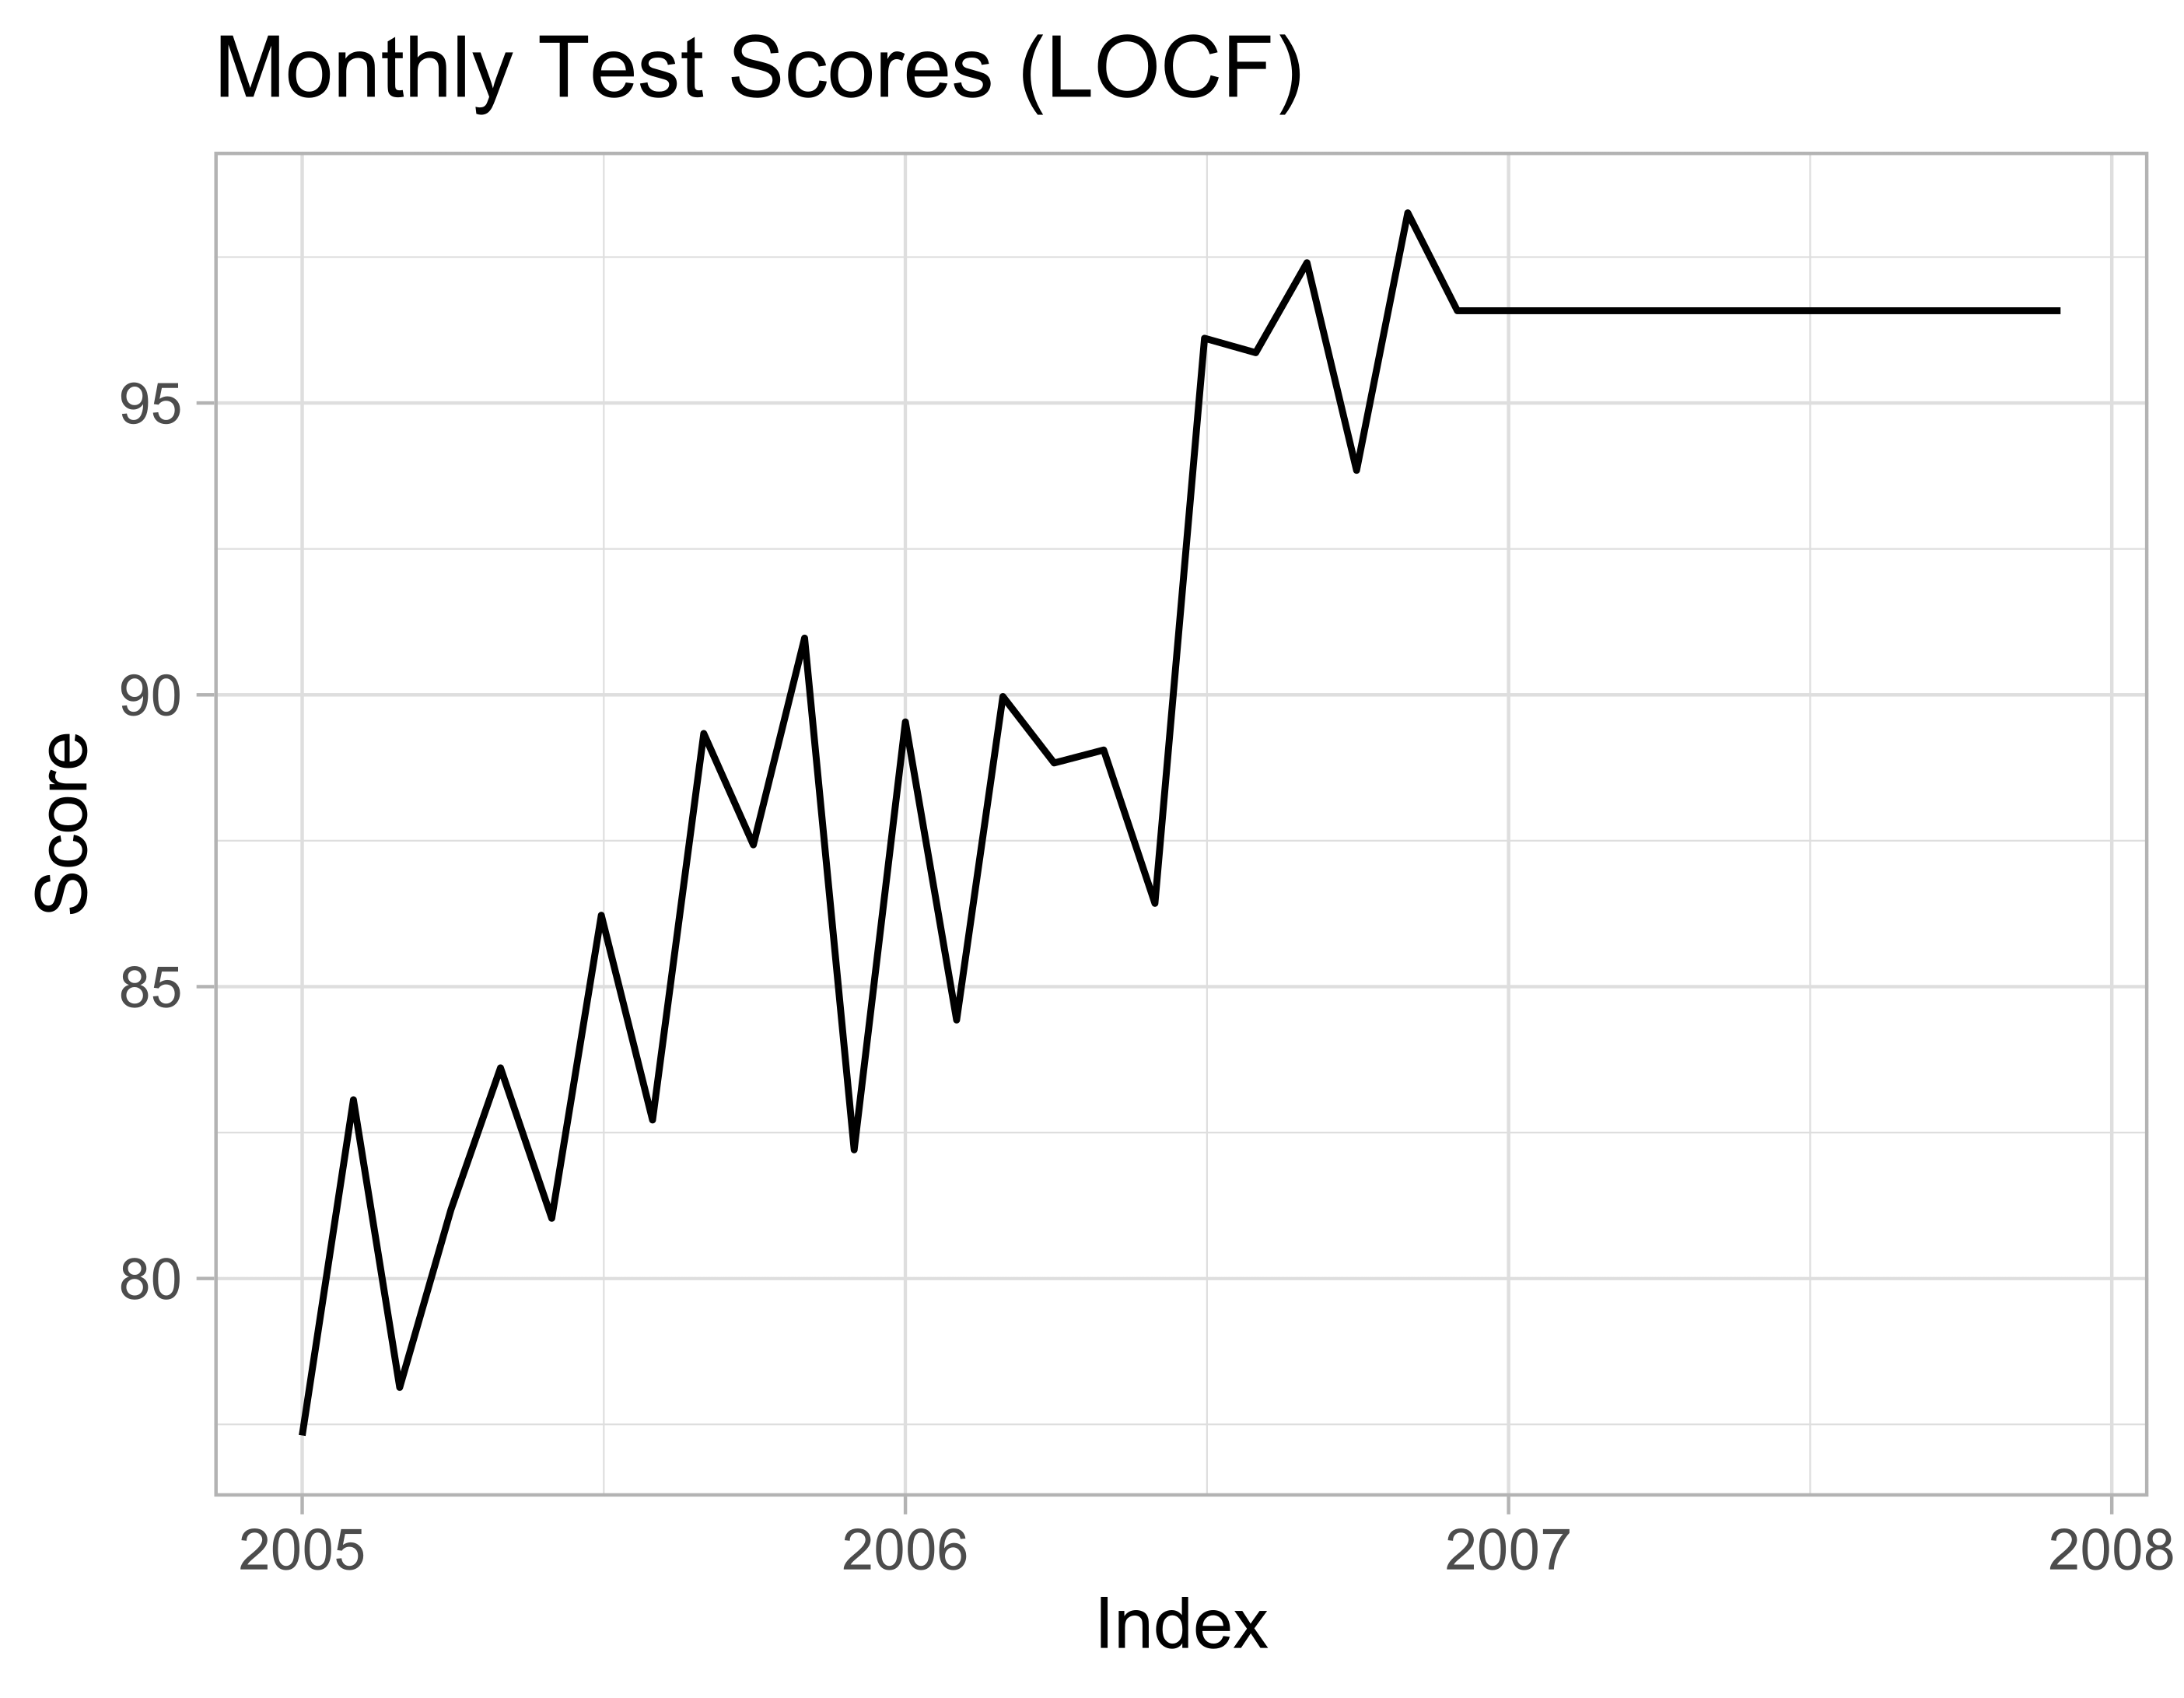
na.locf
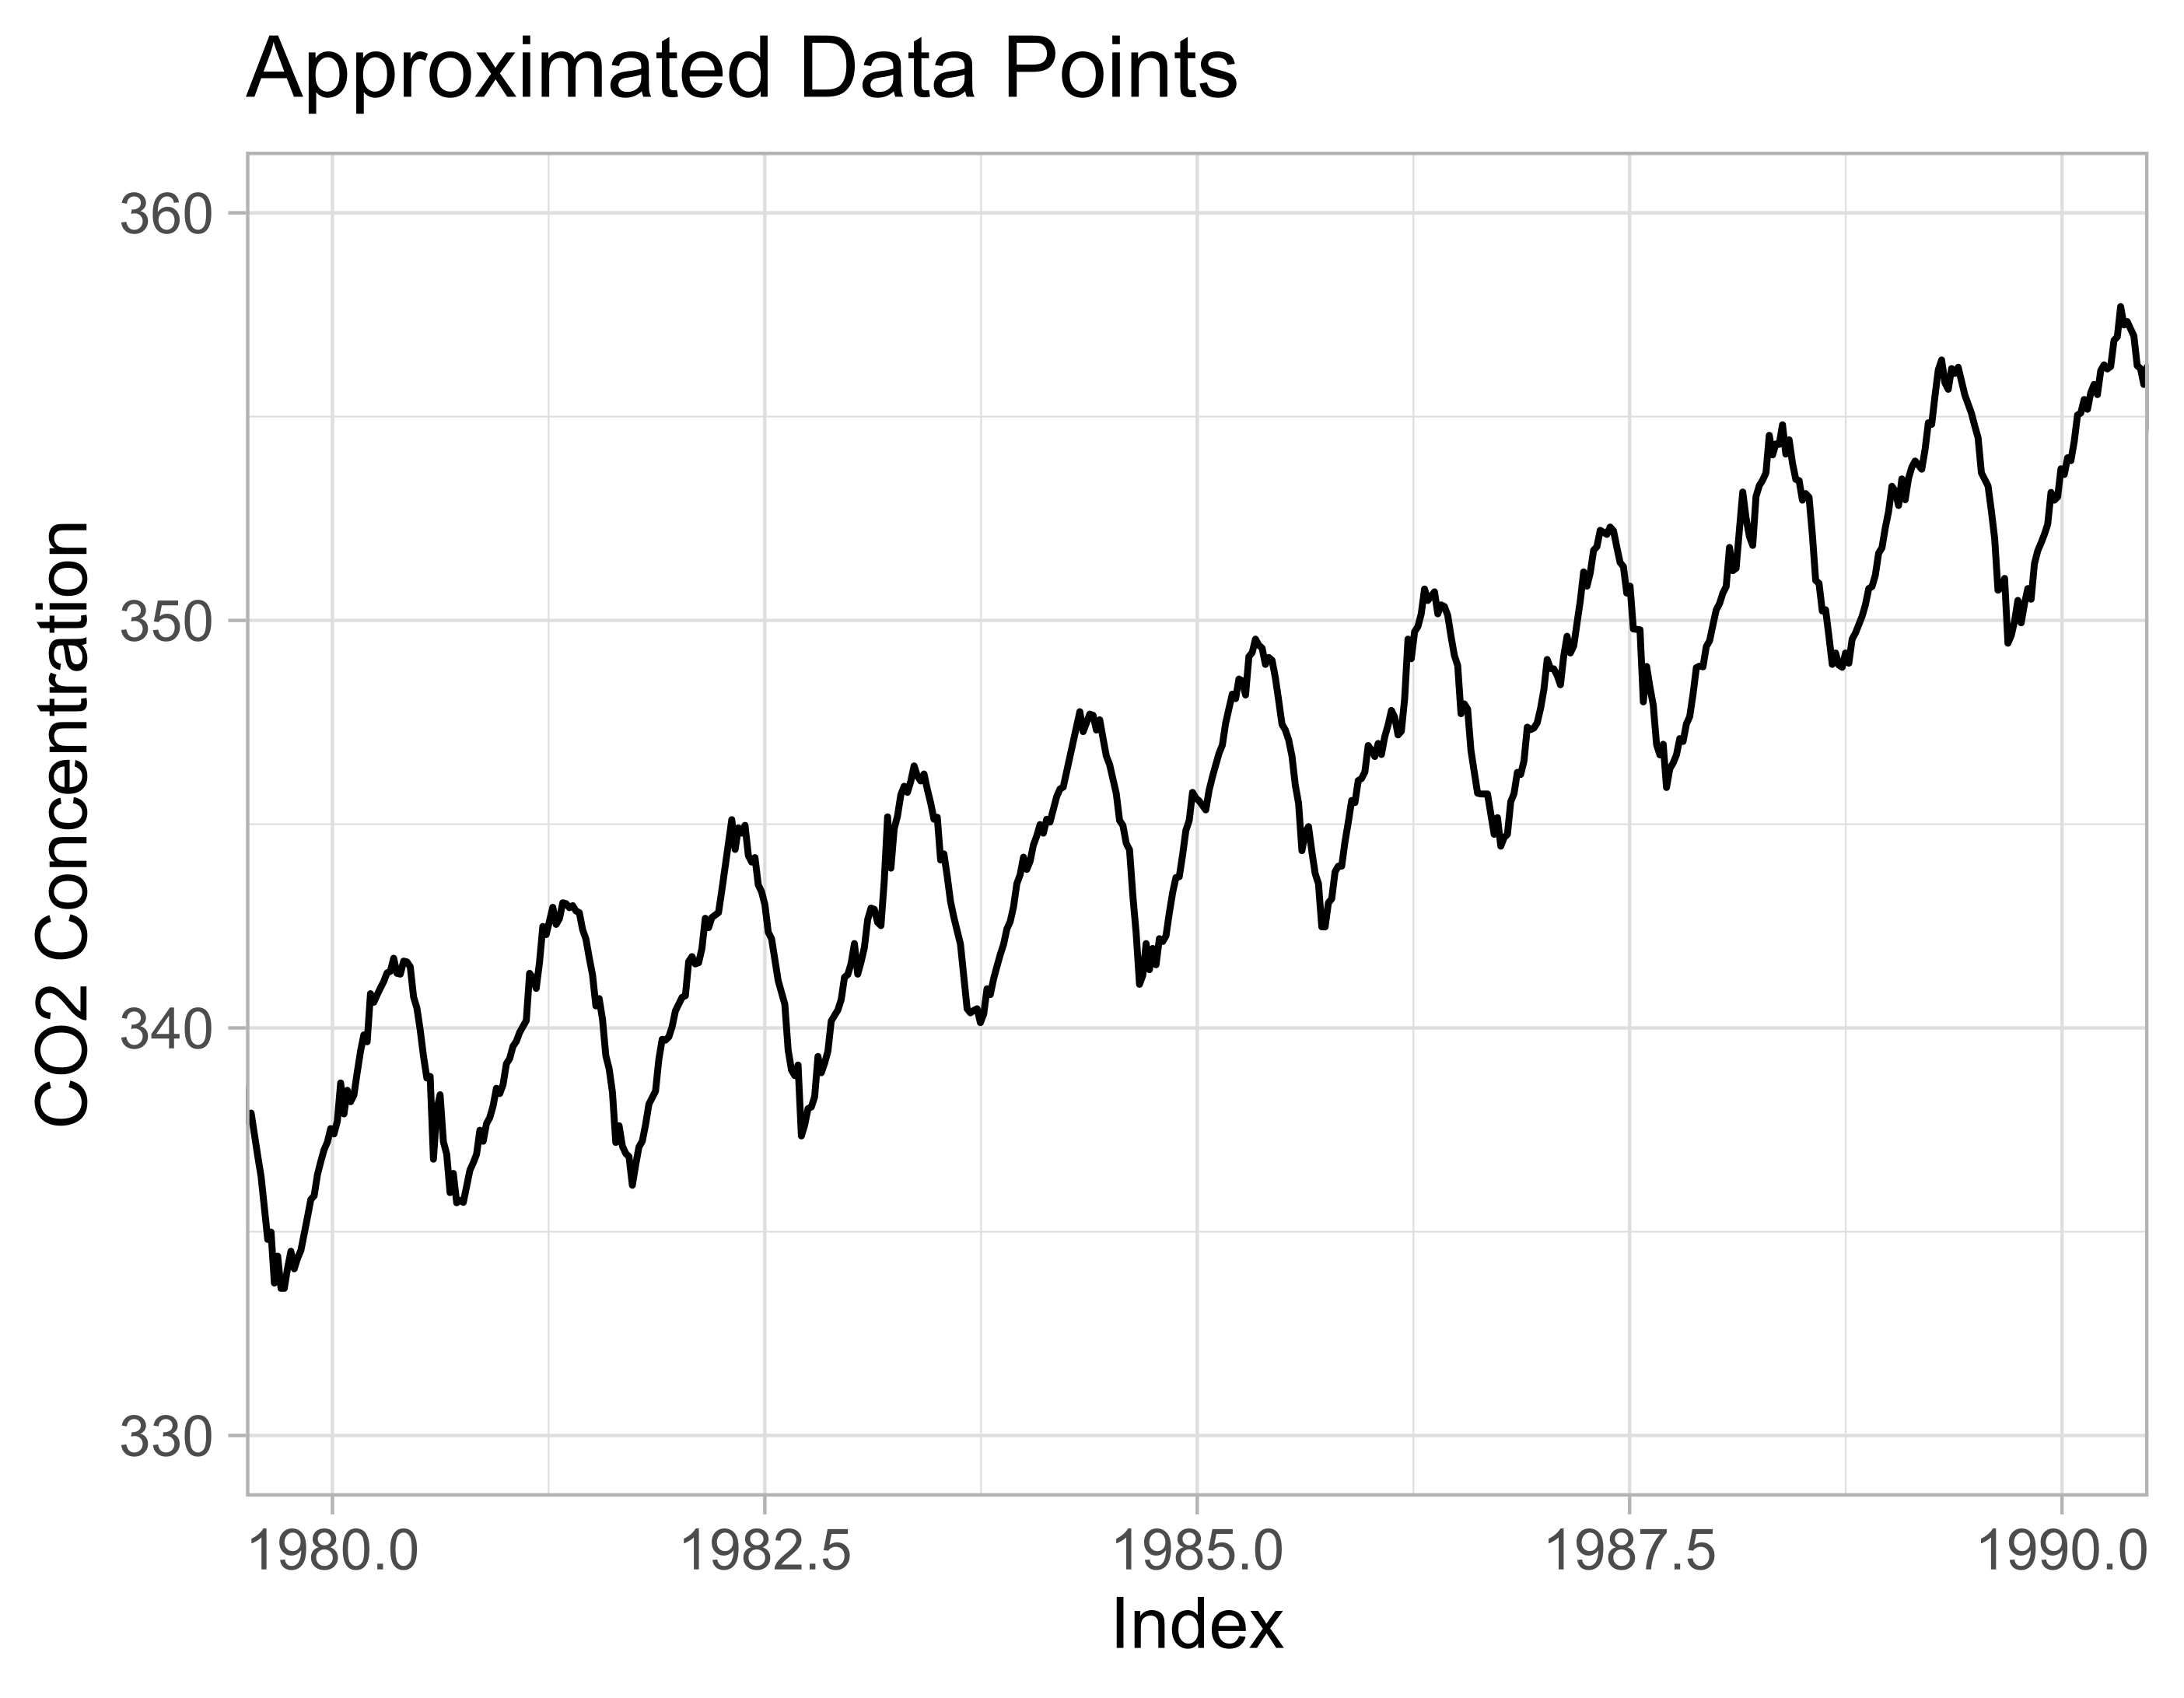
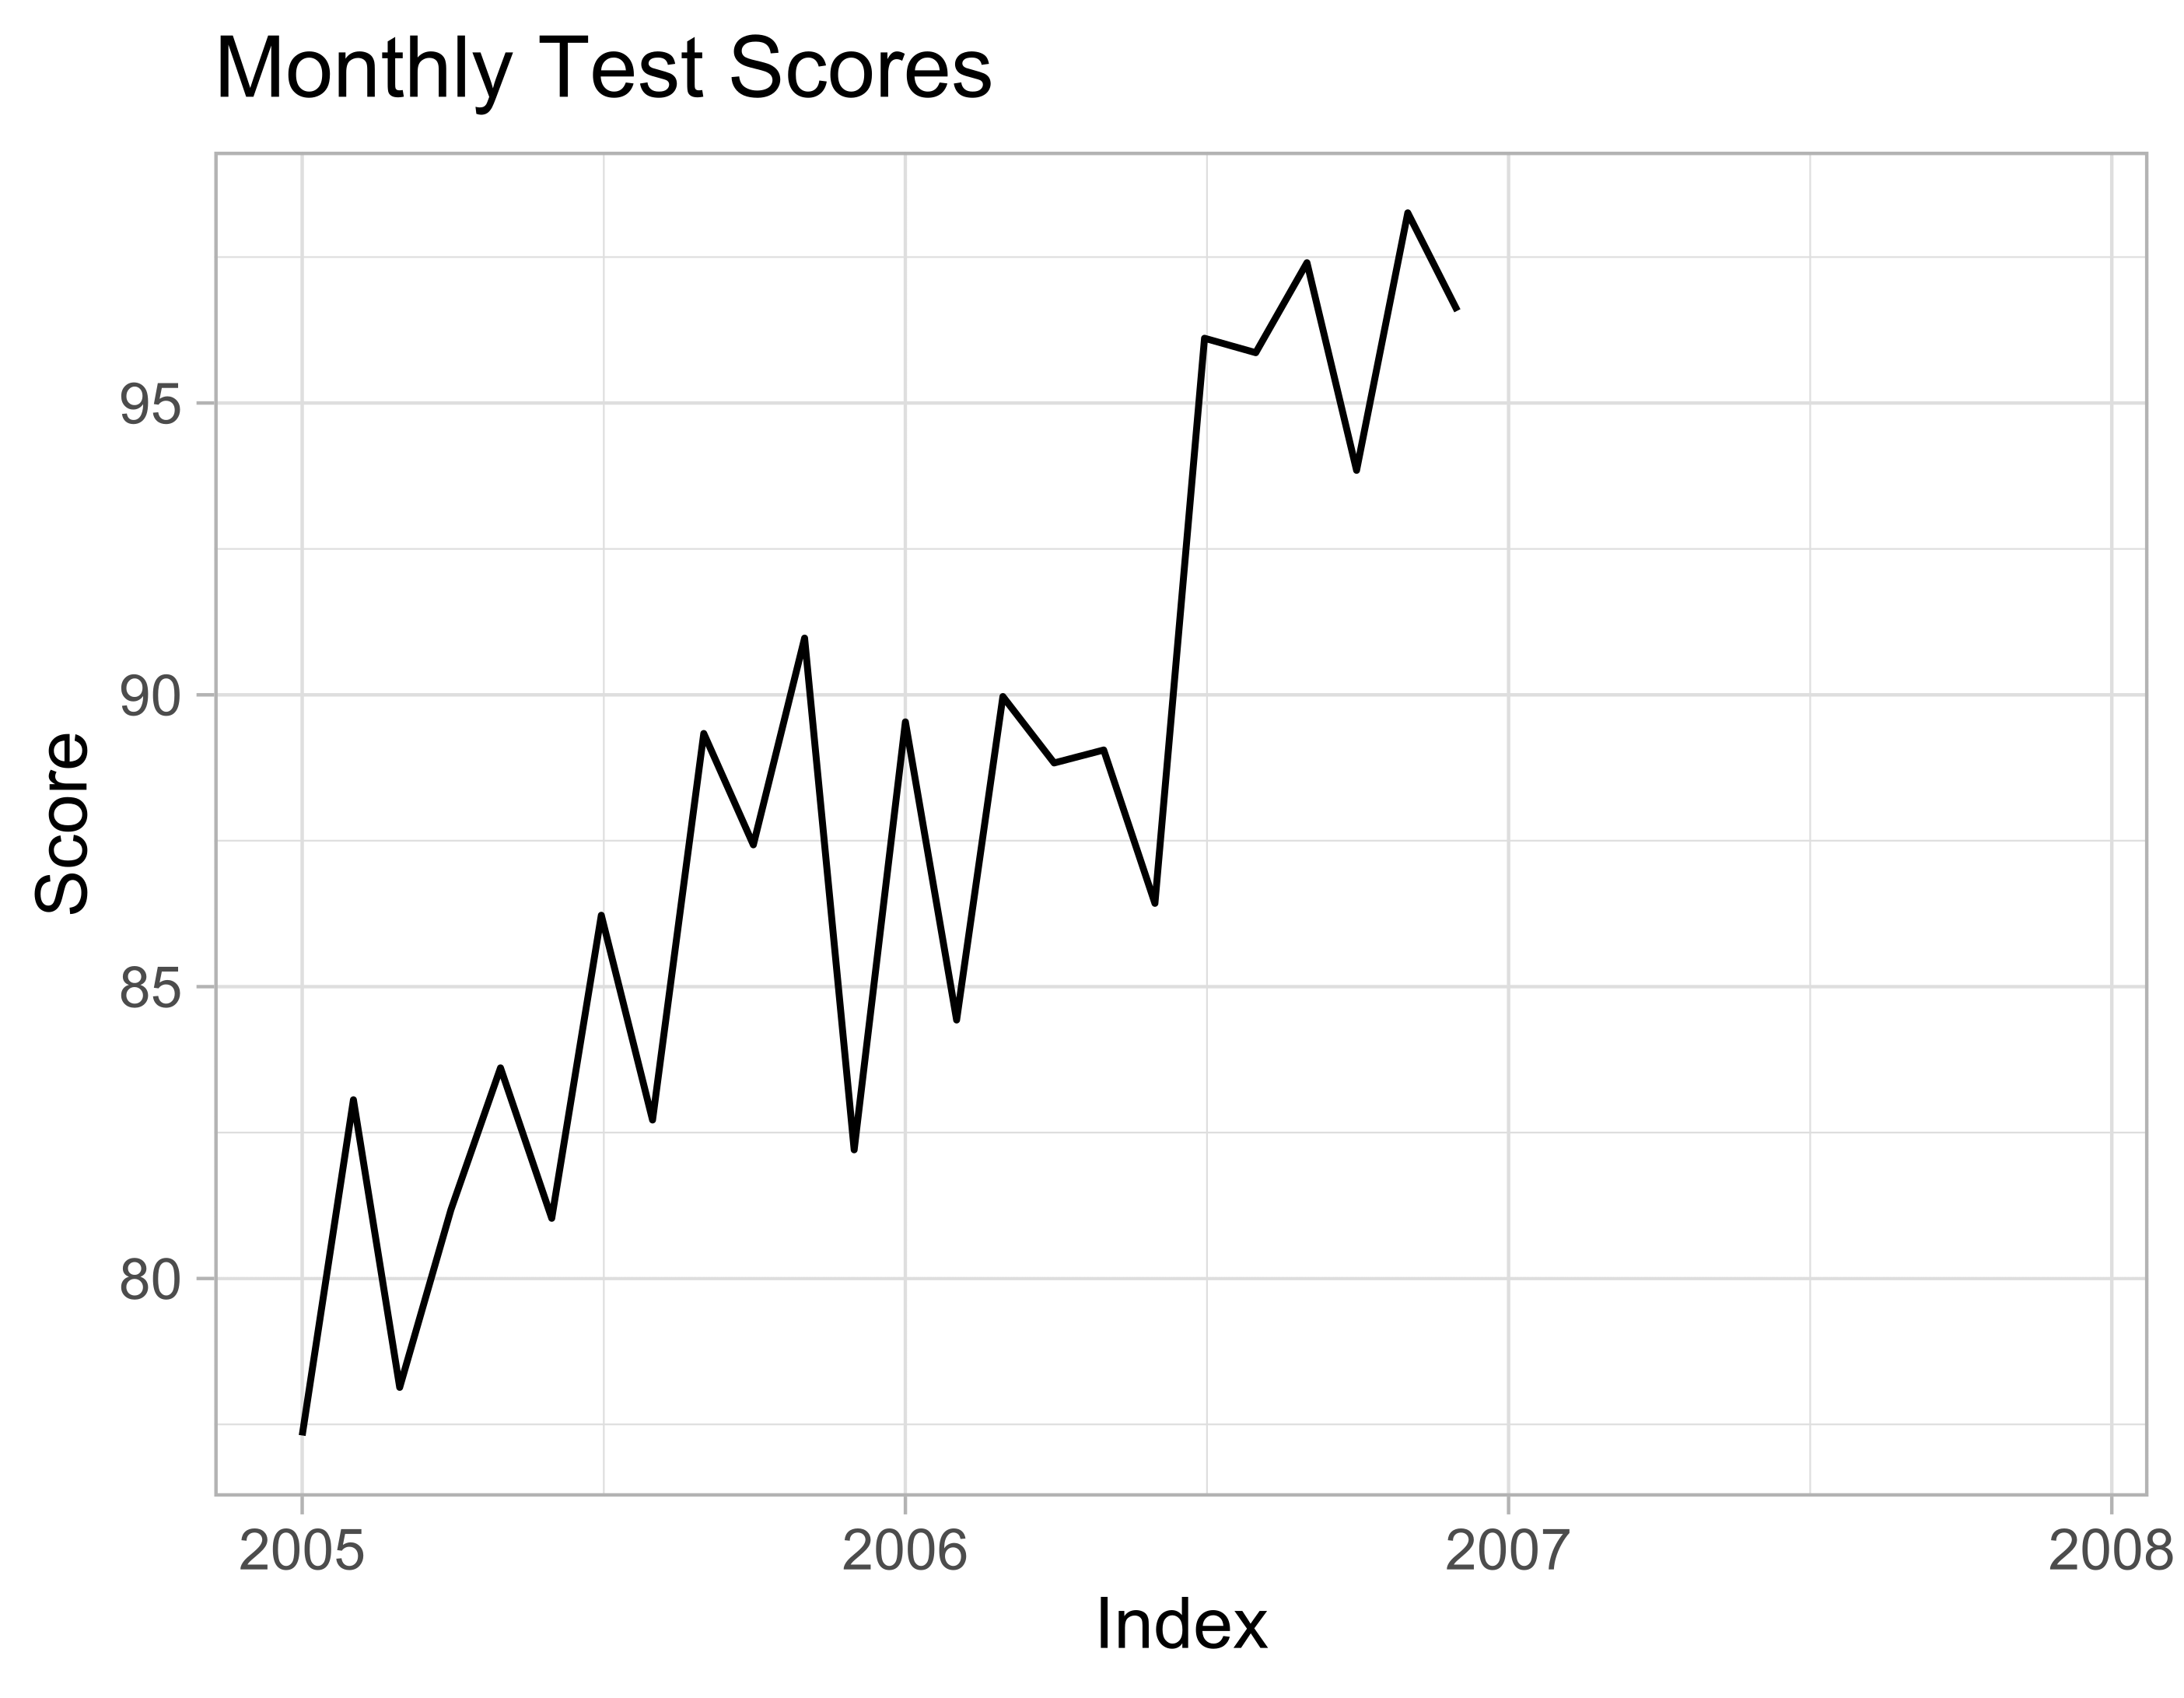
autoplot(scores)
Warning message:
Removed 12 row(s) containing
missing values (geom_path).
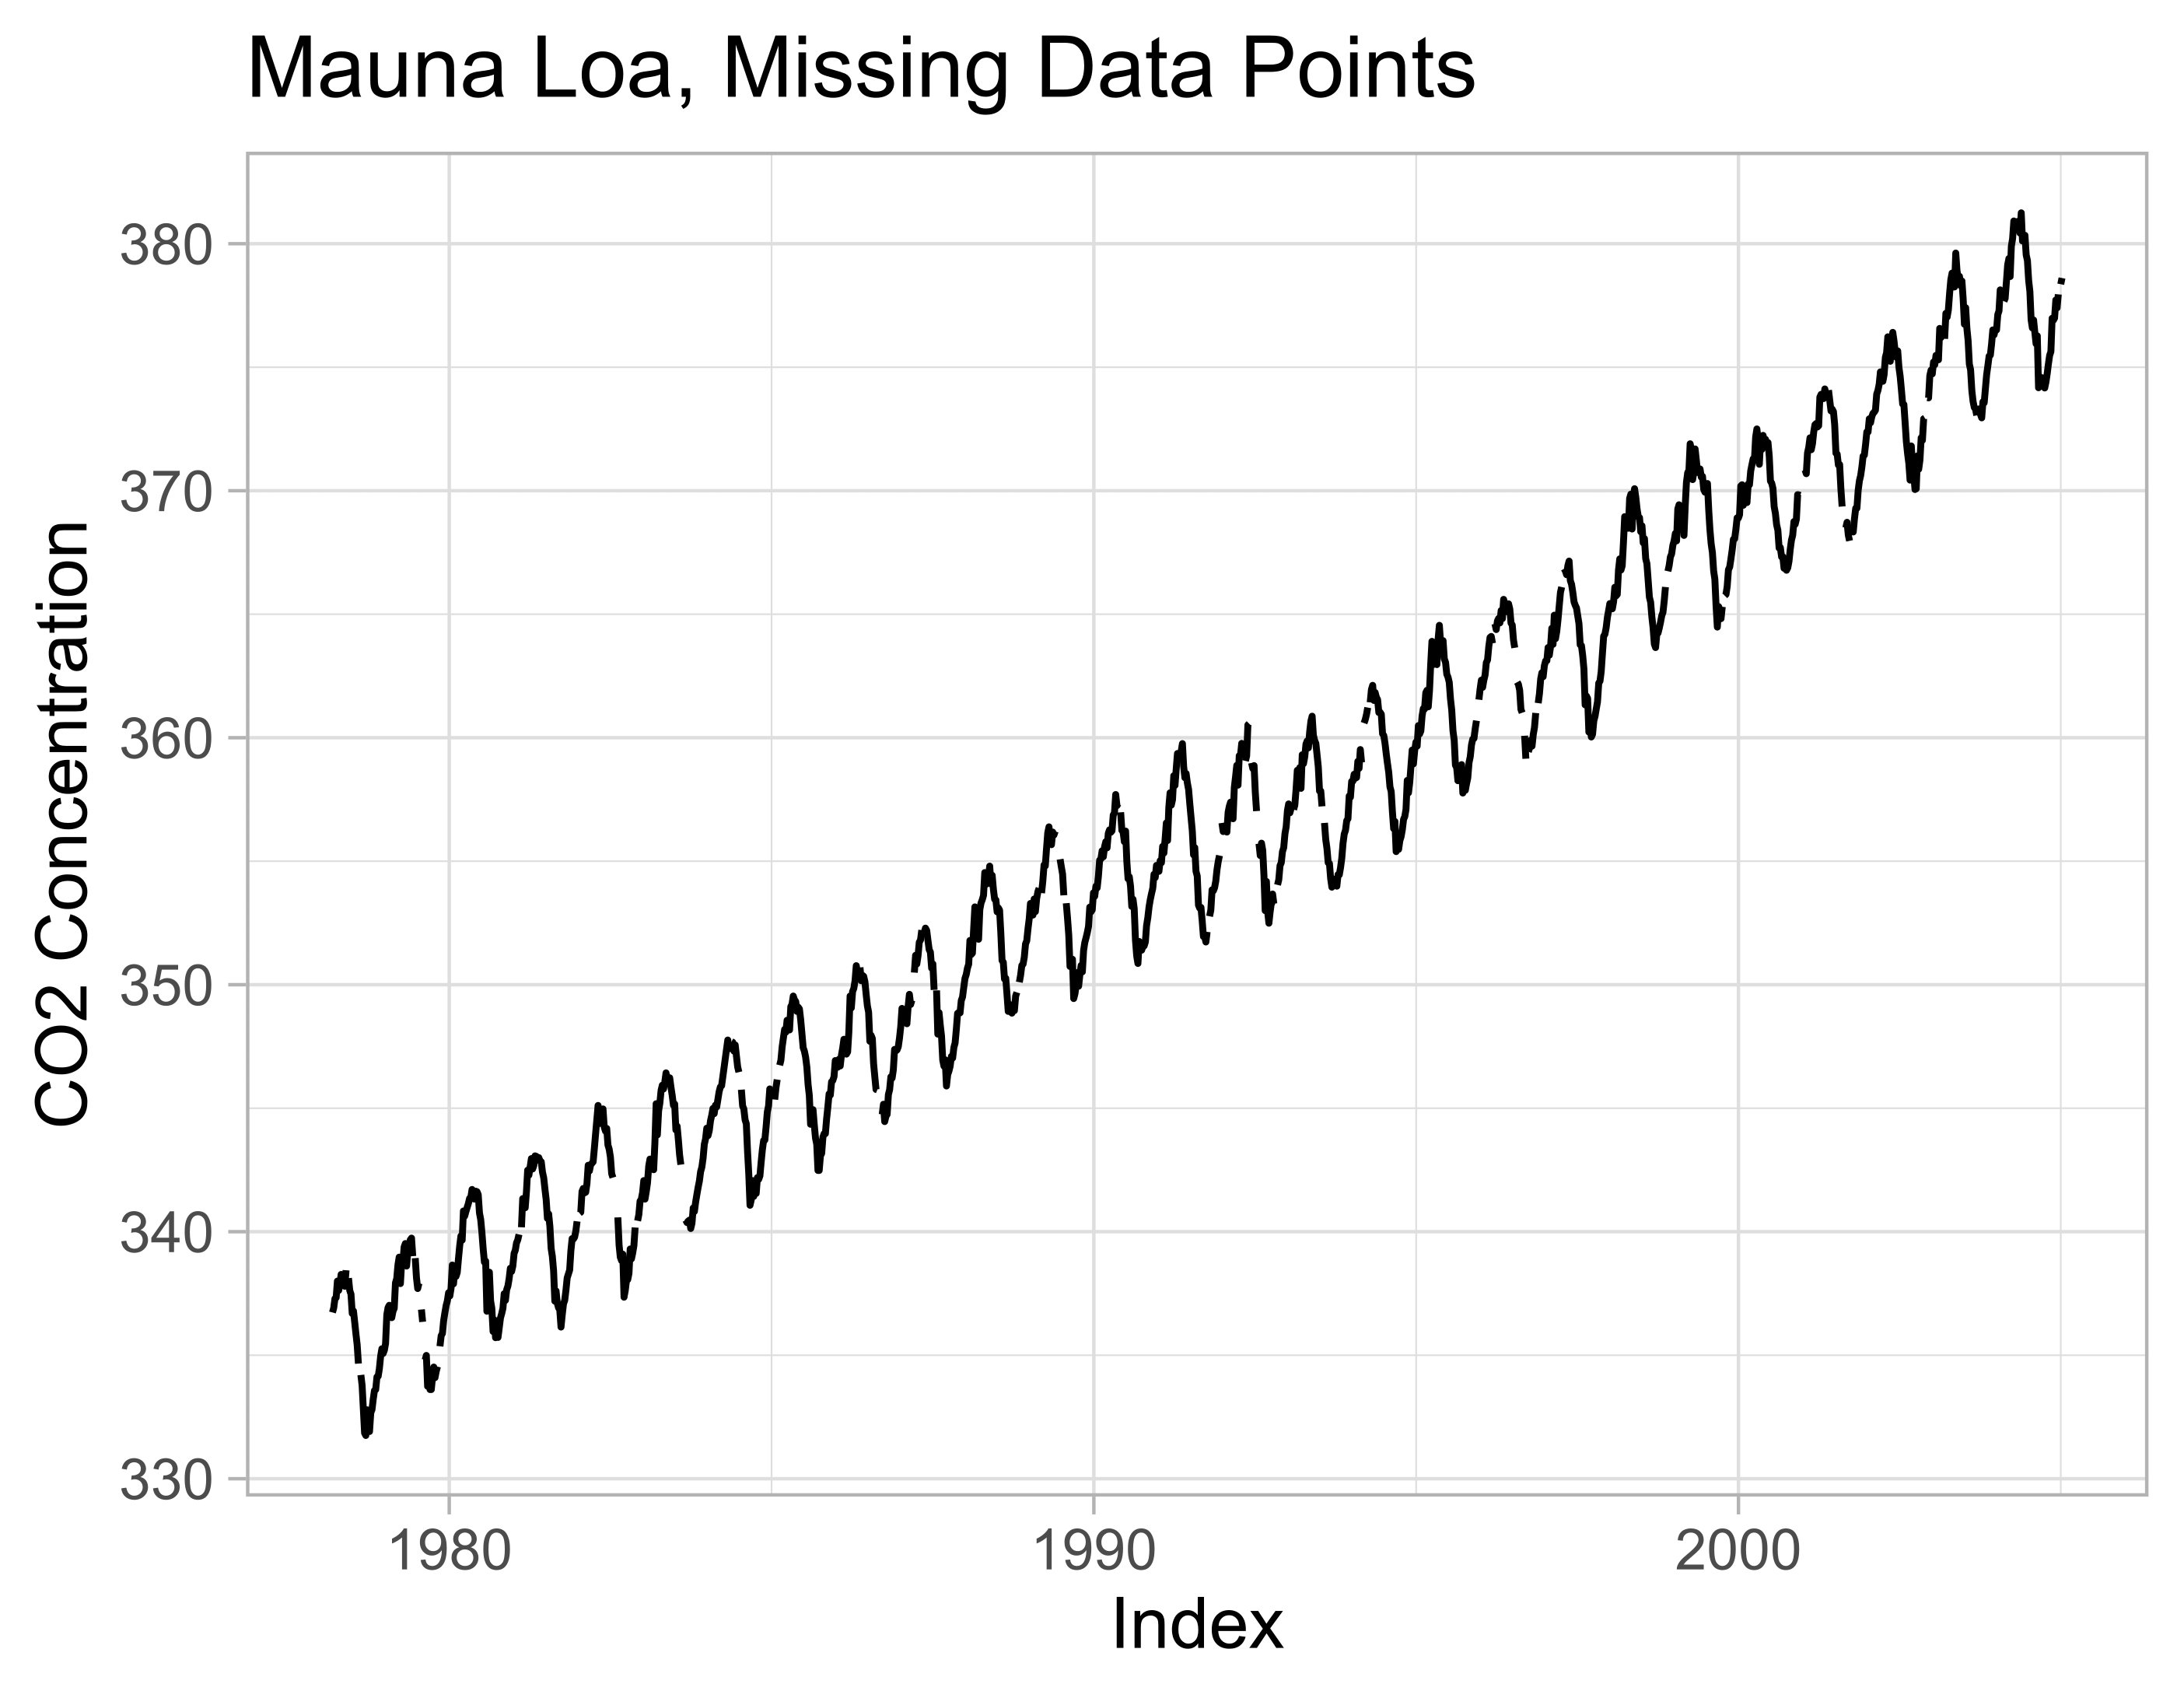
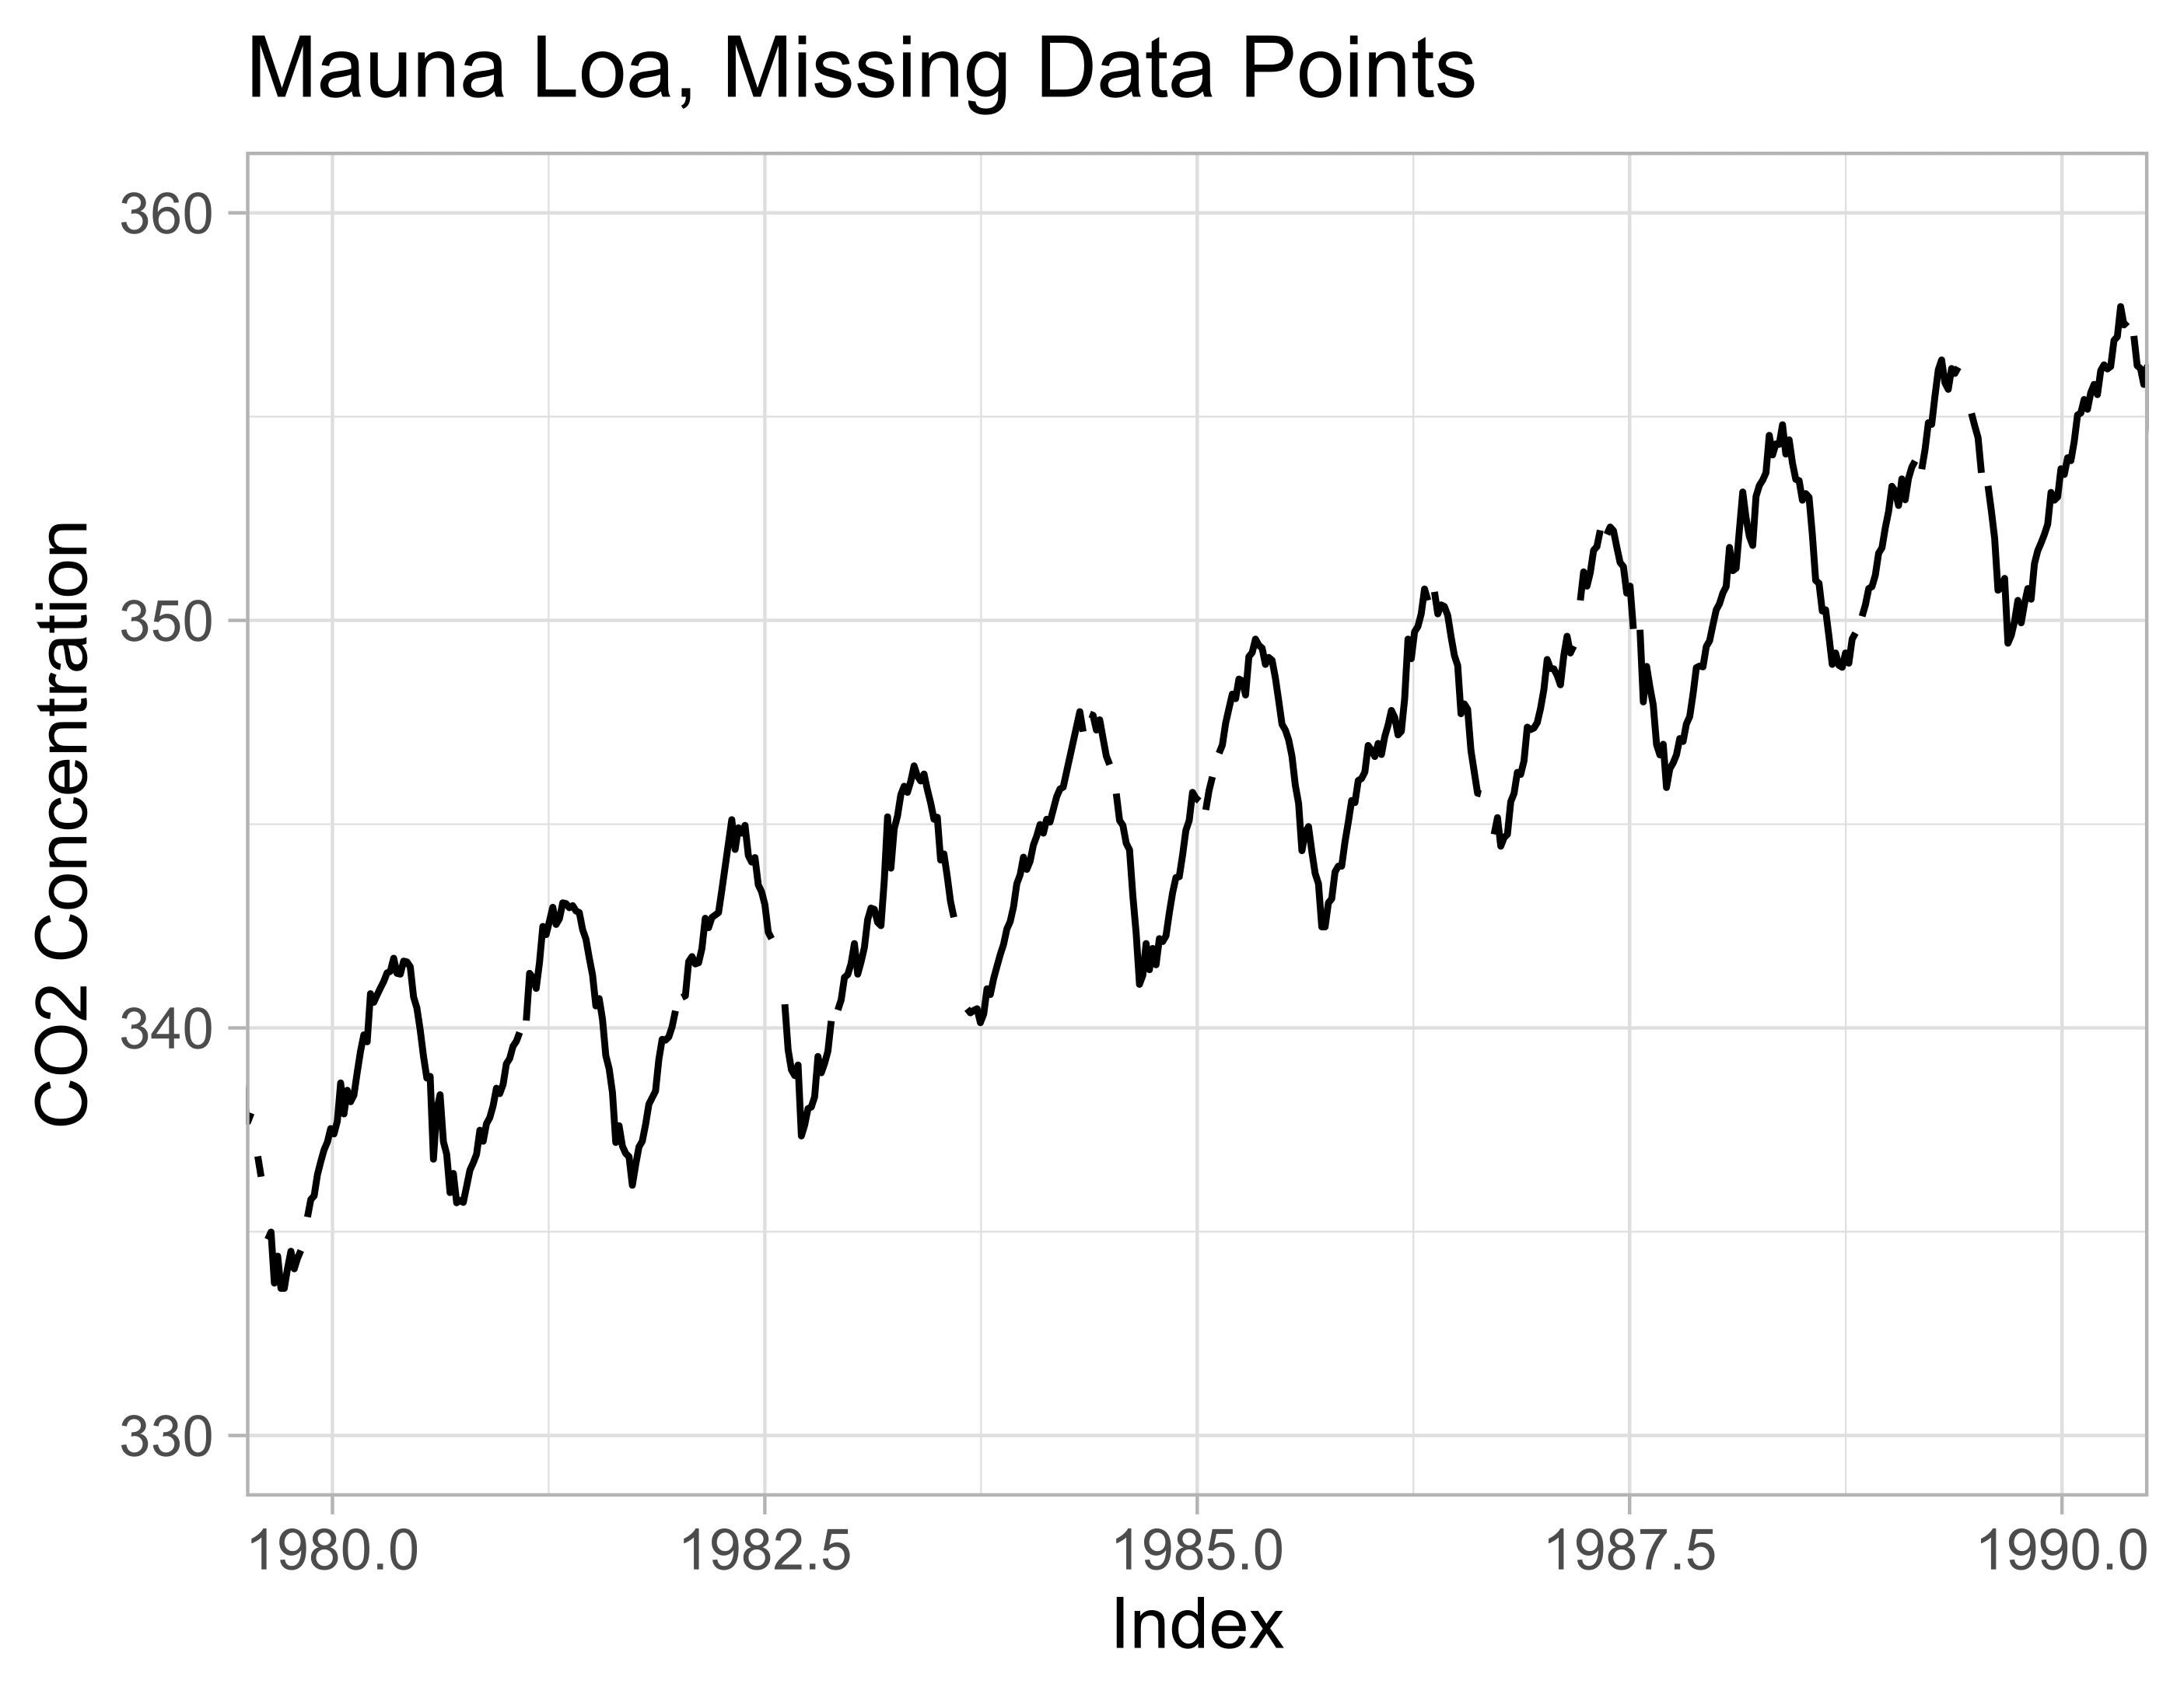
scores_locf <- na.locf(scores)
autoplot(scores_locf)
Linear interpolation
na.approx()

Linear interpolation
na.approx()

Linear interpolation
na.approx()

na.approx