Time series objects with the zoo package
Manipulating Time Series Data in R

Harrison Brown
Graduate Researcher in Geography
The zoo package
zoo
- Provides
zooclass of objects - Functions for manipulating and visualizing time series data
zoo versus base R
base R:
stats::tsclass- Only regularly-spaced intervals
- Can be tedious to create data frames
zoo:
zooclass- Regular or irregular intervals
- Methods for converting to data frame
Creating a zoo object
sample_values
[1] 4.224 5.495 6.156
[4] 6.397 6.291 6.262
...
sample_dates
[1] "2022-01-20" "2022-01-21"
[3] "2022-01-22" "2022-01-23"
[5] "2022-01-24" "2022-01-25"
...
Creating a zoo object
library(zoo)
my_zoo <- zoo(x = sample_values,
              order.by = sample_dates)
my_zoo
2022-01-20 4.224
2022-01-21 5.495
2022-01-22 6.156
2022-01-23 6.397
2022-01-24 6.291
2022-01-25 6.262
...
Converting to zoo from ts
class(AirPassengers)
[1] "ts"
AP_zoo <- zoo::as.zoo(AirPassengers)
class(AP_zoo)
[1] "zoo"
zoo versus ts
print(AirPassengers)
     Jan Feb Mar Apr May Jun Jul ...
1949 112 118 132 129 121 135 148 ...
1950 115 126 141 135 125 149 170 ...
1951 145 150 178 163 172 178 199 ...
1952 171 180 193 181 183 218 230 ...
1953 196 196 236 235 229 243 264 ...
...
print(AP_zoo)
Jan 1949 112
Feb 1949 118
Mar 1949 132
Apr 1949 129
May 1949 121
Jun 1949 135
Jul 1949 148
Aug 1949 148
Sep 1949 136
...
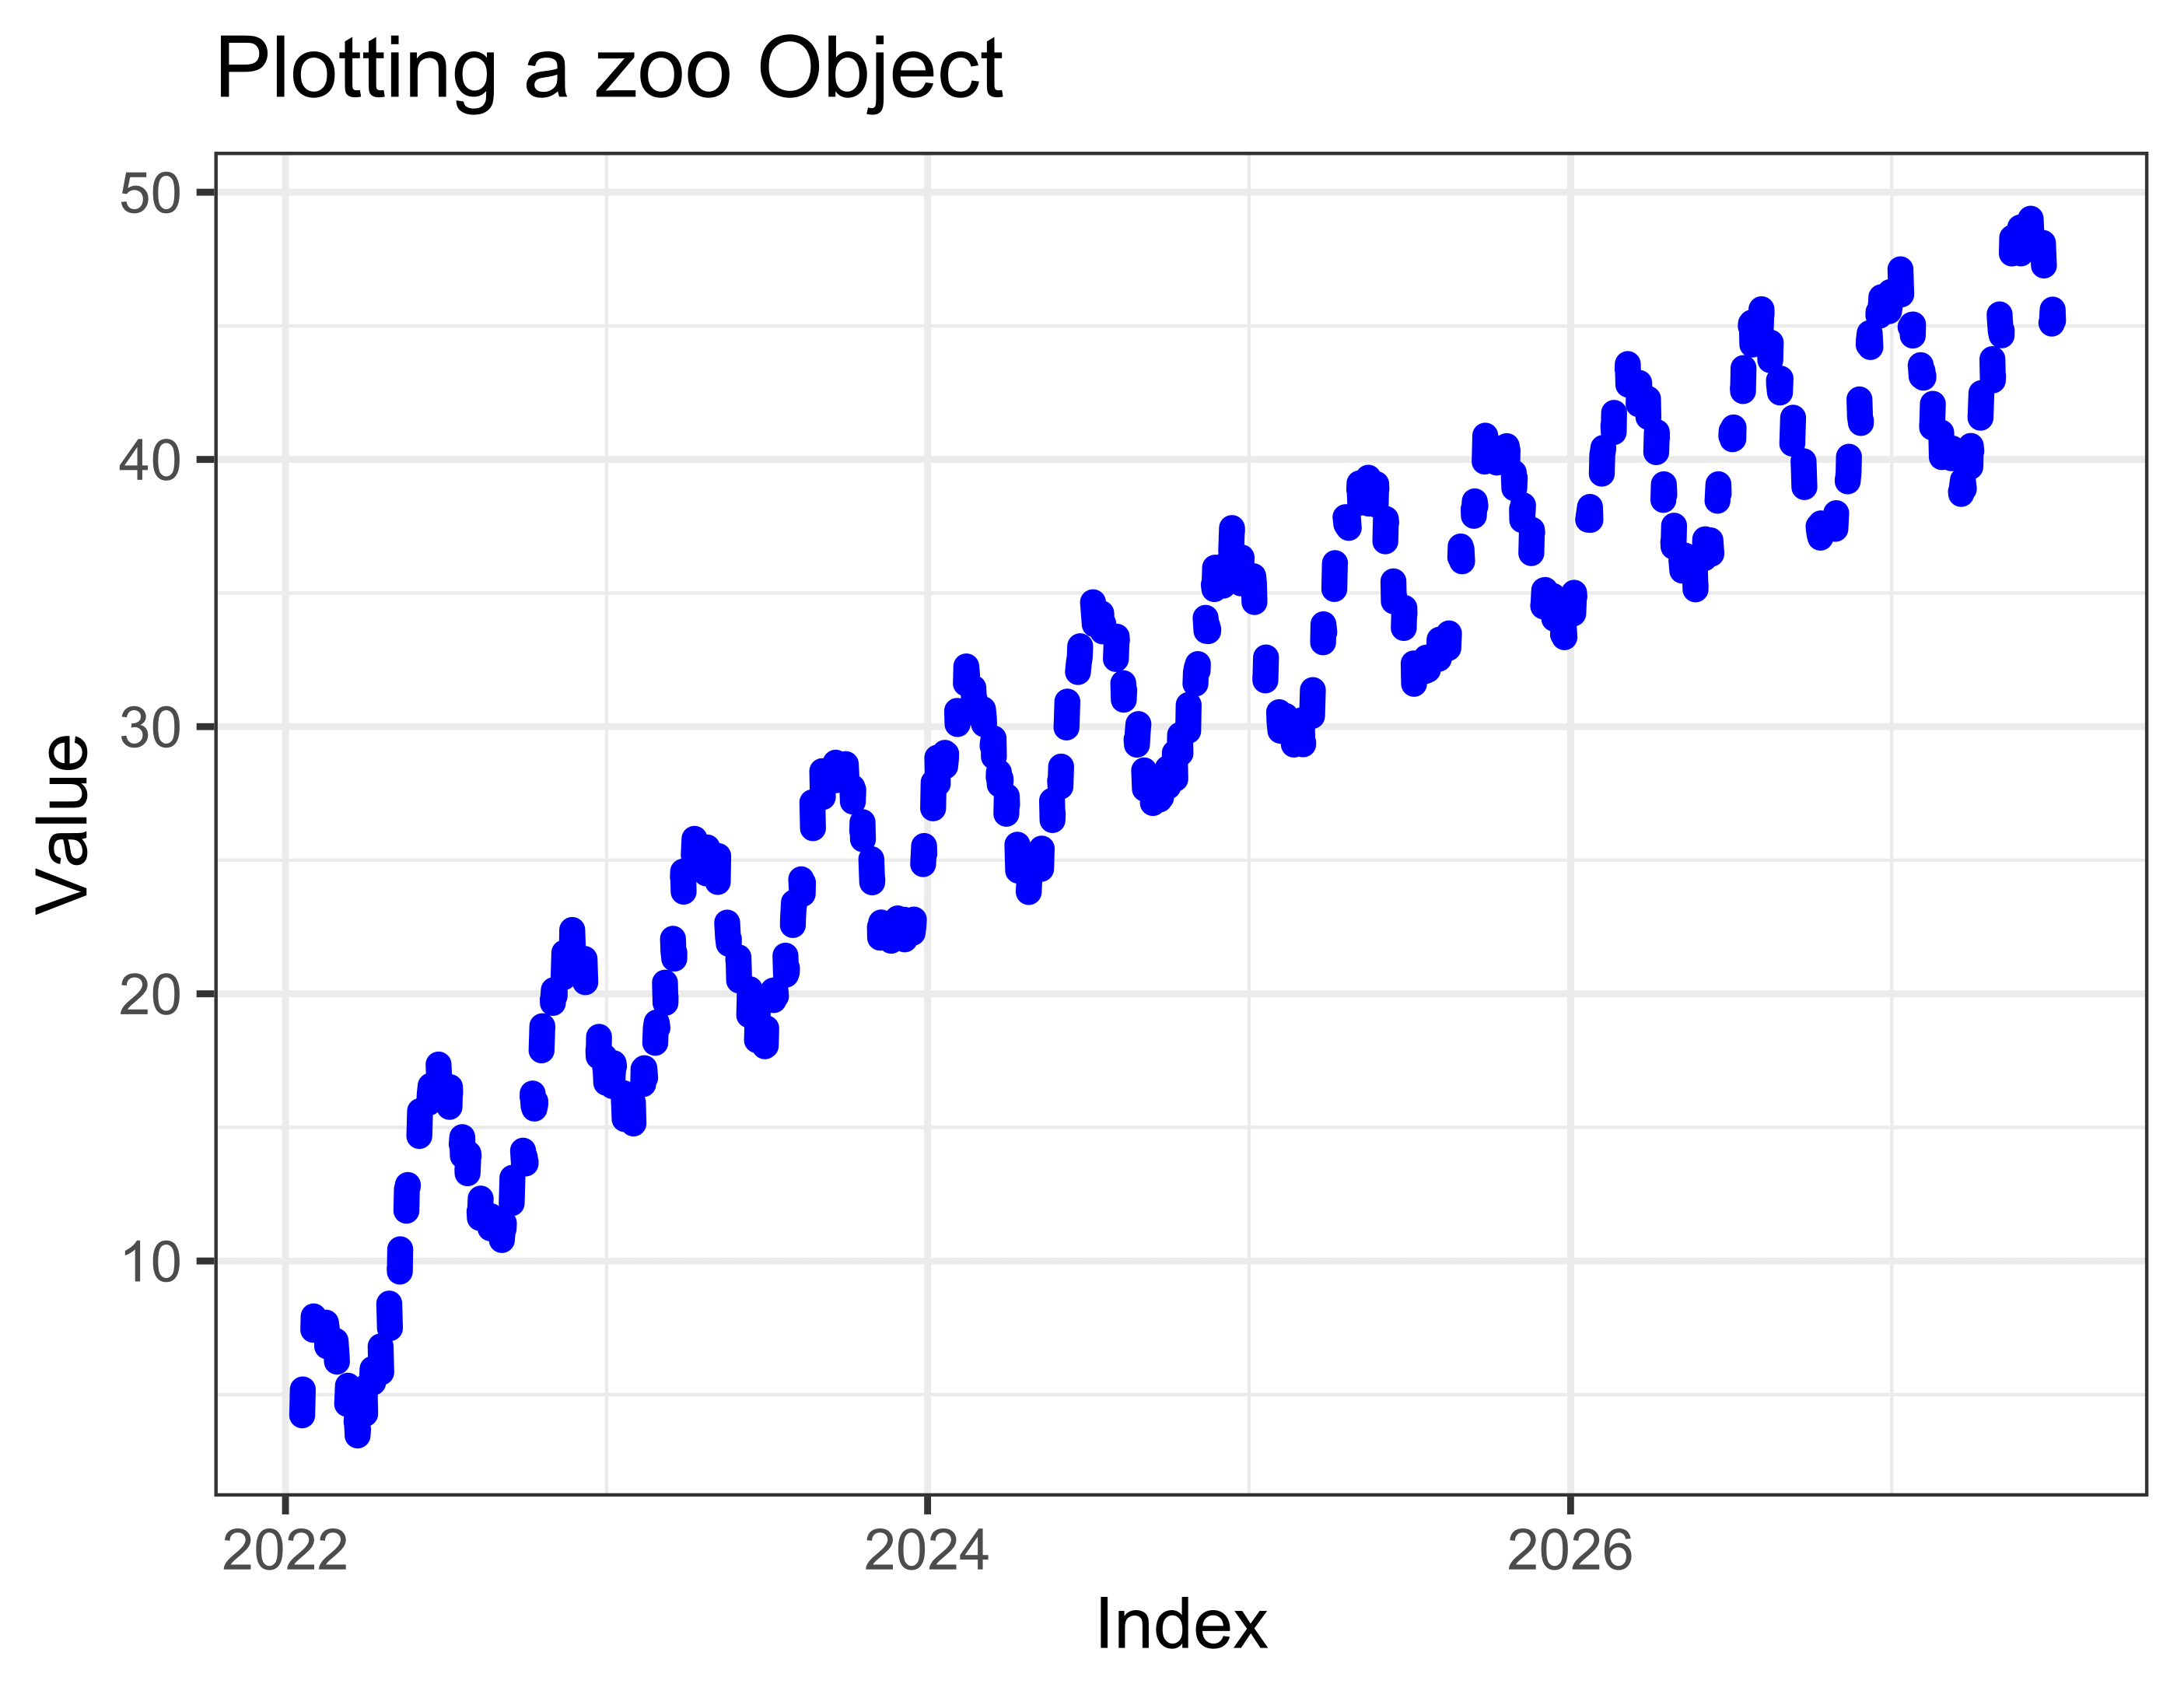
zoo and ggplot2
library(ggplot2) ggplot(data = my_zoo, aes(x = Index, y = my_zoo)) +geom_line(color = "blue", size = 2, linetype = "dotted") +scale_y_continuous() +theme_bw() + labs(x = "Index", y = "Value", title = "Plotting a zoo Object")
zoo and ggplot2
Let's practice!
Manipulating Time Series Data in R

