Manipulating Time Series Data in R
Harrison Brown
Graduate Researcher in Geography
Dates:
2012-09-25
Aggregation:
Monthly data:
2003-01-01
2003-01-31
2003-01-15
2003-01
laborday_2022 <- as_date('2022-09-05')
laborday_2021 <- as_date('2021-09-06')
lubridate::month(laborday_2022)
[1] 9
lubridate::month(laborday_2021)
zoo::yearmon class:
zoo::yearmon
as.yearmon(laborday_2022)
[1] "Sep 2022"
as.yearmon(laborday_2021)
[1] "Sep 2021"
zoo::as.yearmon()
as.yearmon('2007-10-31')
[1] "Oct 2007"
laborday_2021 <- as_date('2022-09-06')
as.yearmon(laborday_2022)
lunchtime <-
  as.POSIXct('2022-09-21 13:30:00 EDT')
as.yearmon(lunchtime)
as.yearmon(2008.245)
[1] "Mar 2008"
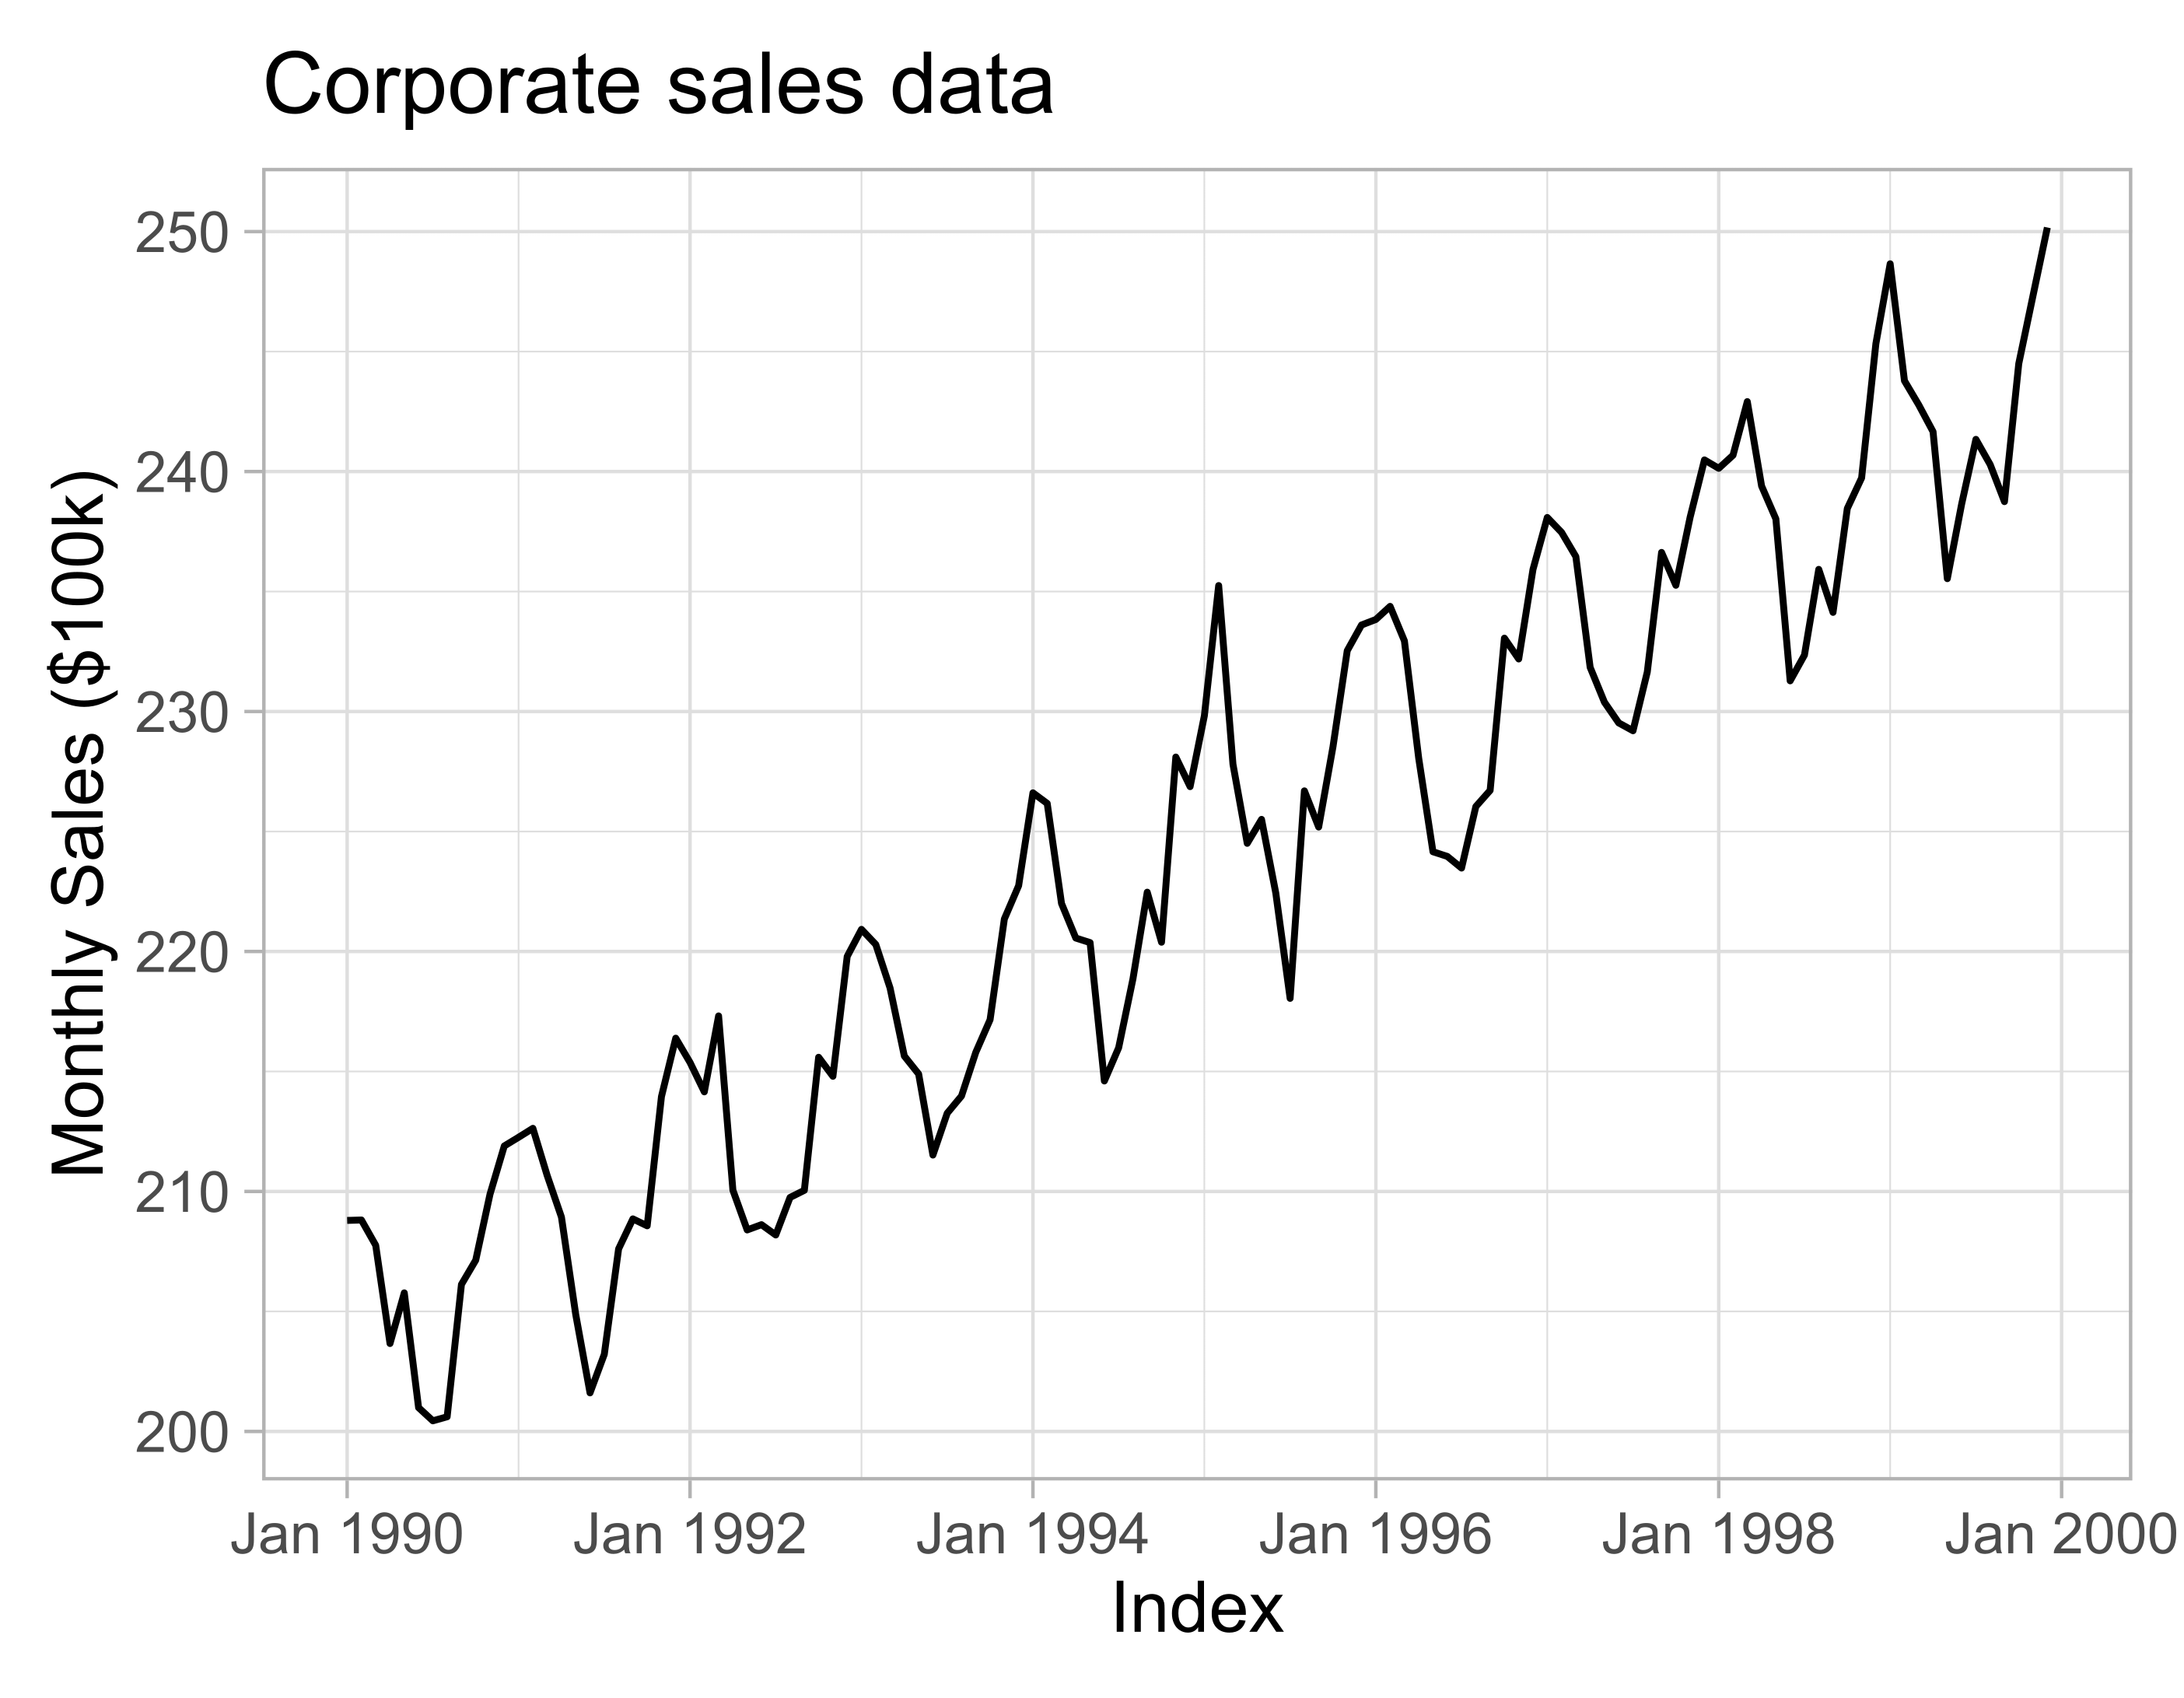
class(index(monthly_sales))
[1] "yearmon"
monthly_sales
Jan 1990 209.8921
Feb 1990 209.1493
Mar 1990 214.5236
Apr 1990 206.0842
May 1990 202.5655
...
zoo::yearqtr class
zoo::yearqtr
as.yearqtr(2018.639)
[1] "2018 Q3"
eid_2022 <- as_date('2022-05-01')
as.yearqtr(eid_2022)
[1] "2022 Q2"
april_2003 <- as.yearmon("Apr 2003")
as.yearqtr(april_2003)
[1] "2003 Q2"
zoo::as.yearqtr('1990-10-30')
[1] NA
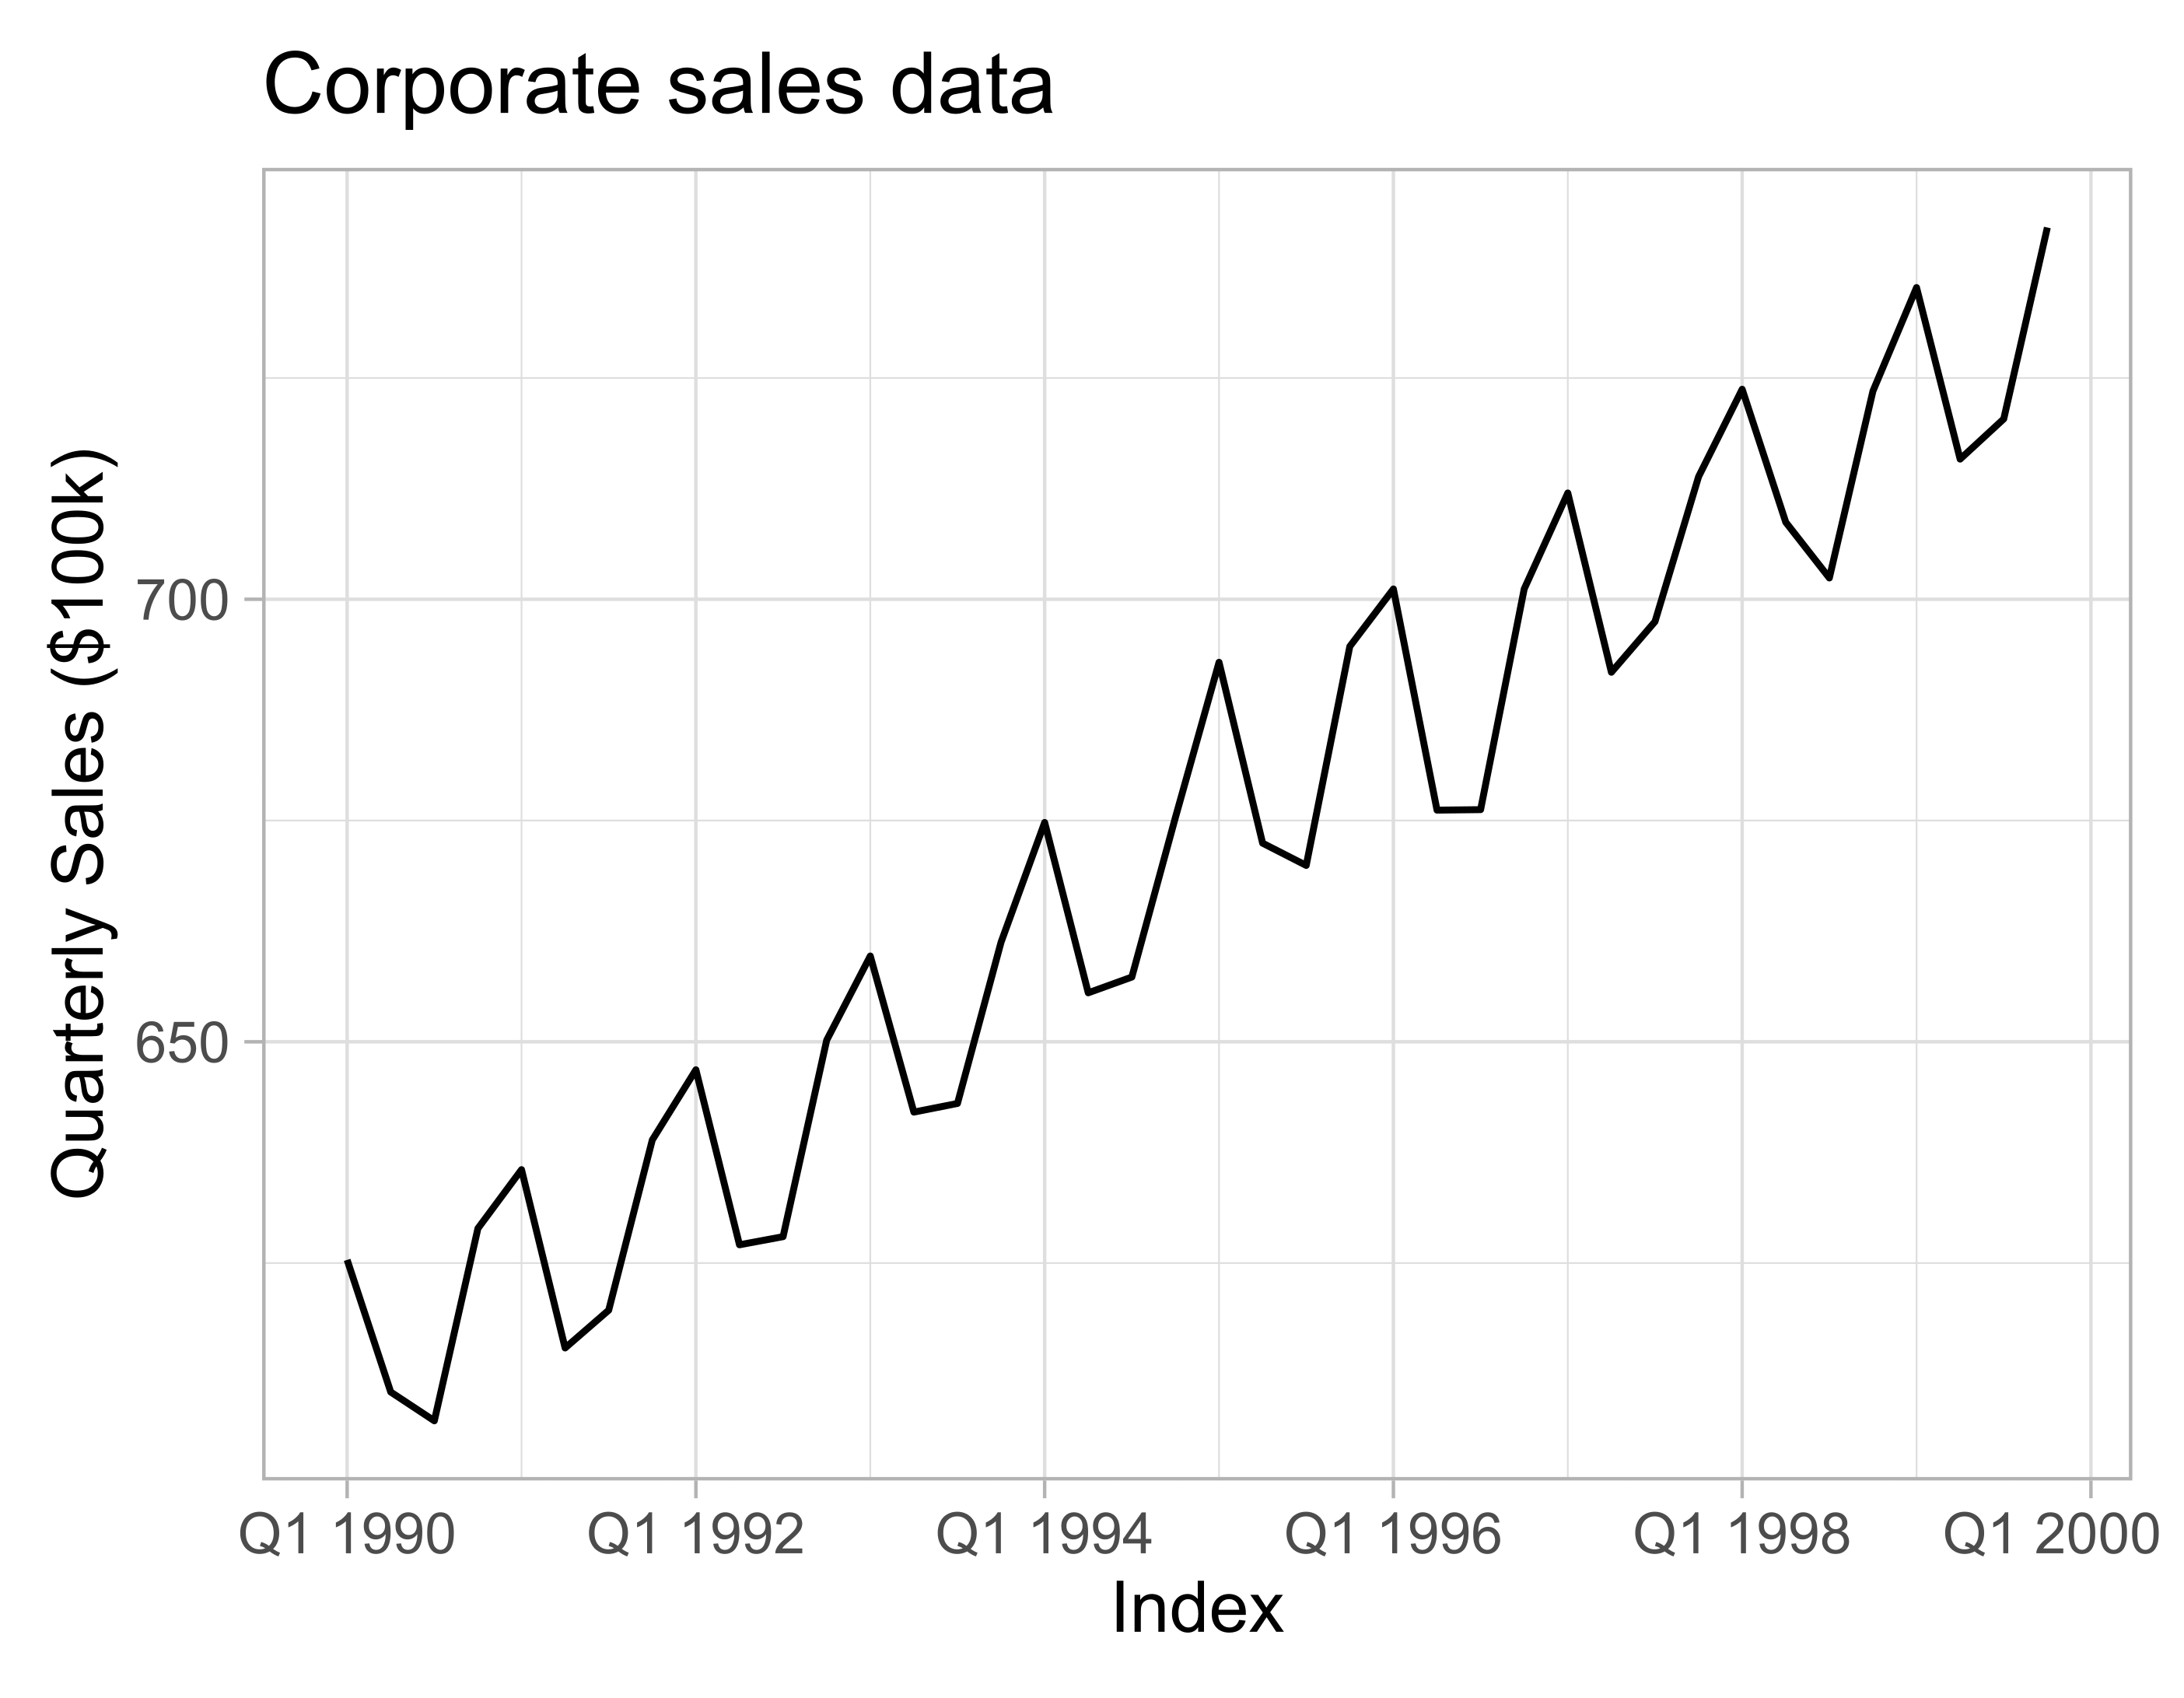
quarterly_sales
1990 Q1 625.3594
1990 Q2 610.4269
1990 Q3 607.1768
1990 Q4 628.9146
1991 Q1 635.5531
...
class(index(quarterly_sales))
[1] "yearqtr"