Expanding windows
Manipulating Time Series Data in R

Harrison Brown
Graduate Researcher in Geography
Expanding window process
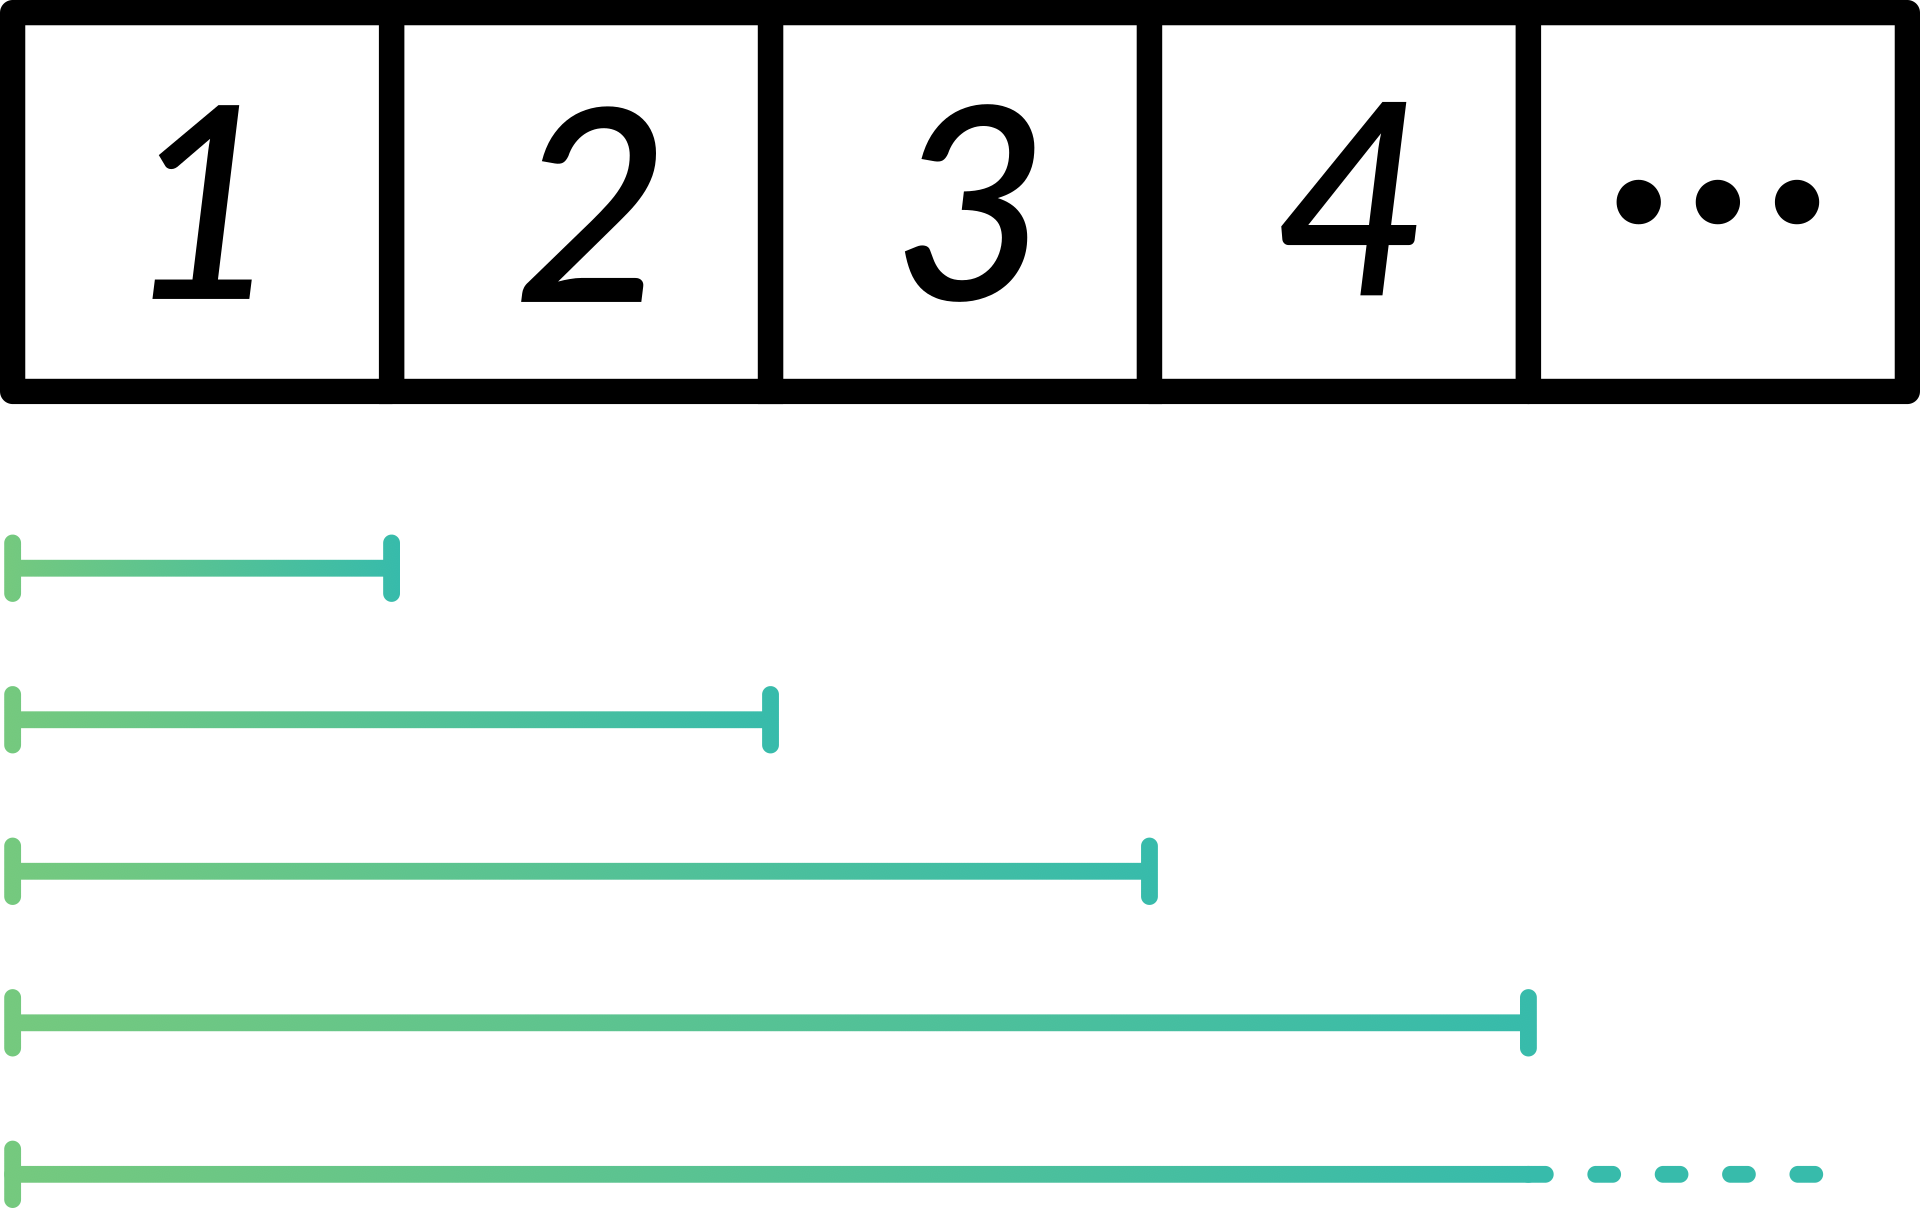
Plotting expanding windows
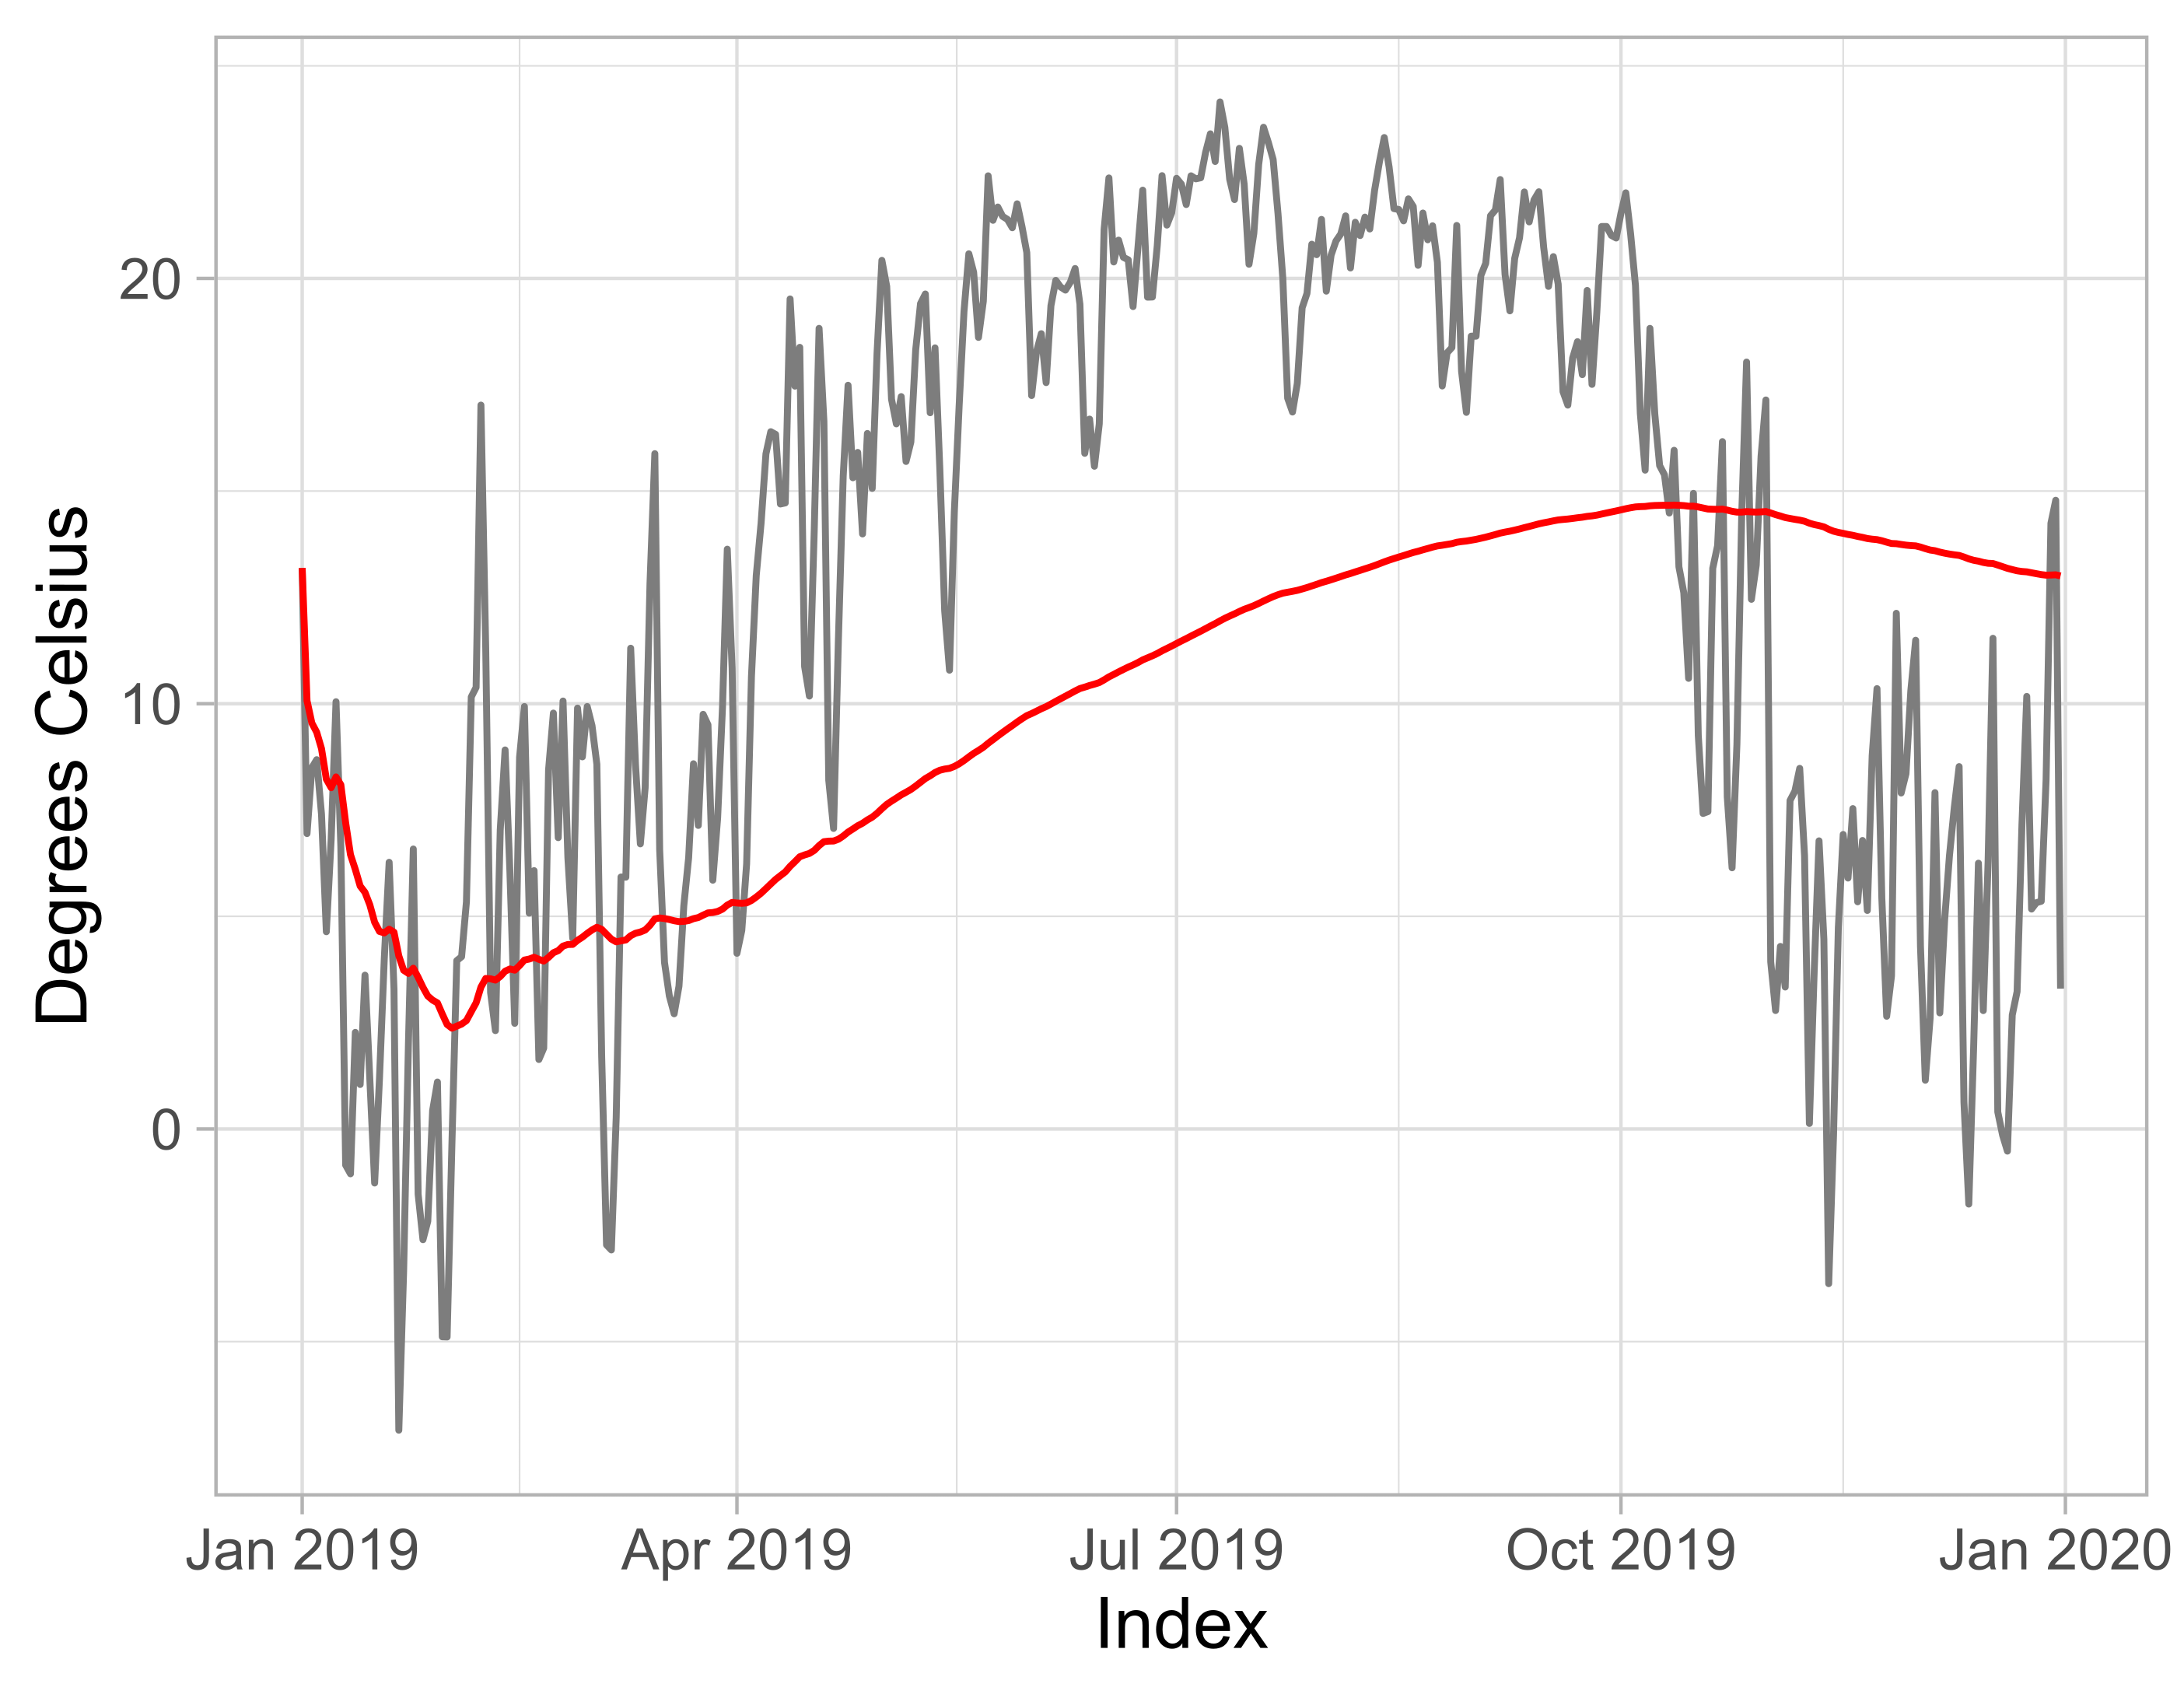
Expanding window inferences
Manipulating Time Series Data in R
Harrison Brown
Graduate Researcher in Geography

