Visualizing Success
Communicating Data Insights

Joe Franklin
Senior Curriculum Manager, DataCamp
Let's play a game
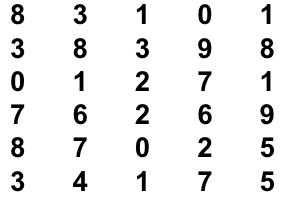
How many zeros are there?
Changing the rules
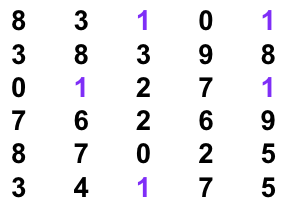
How many 1's are there?
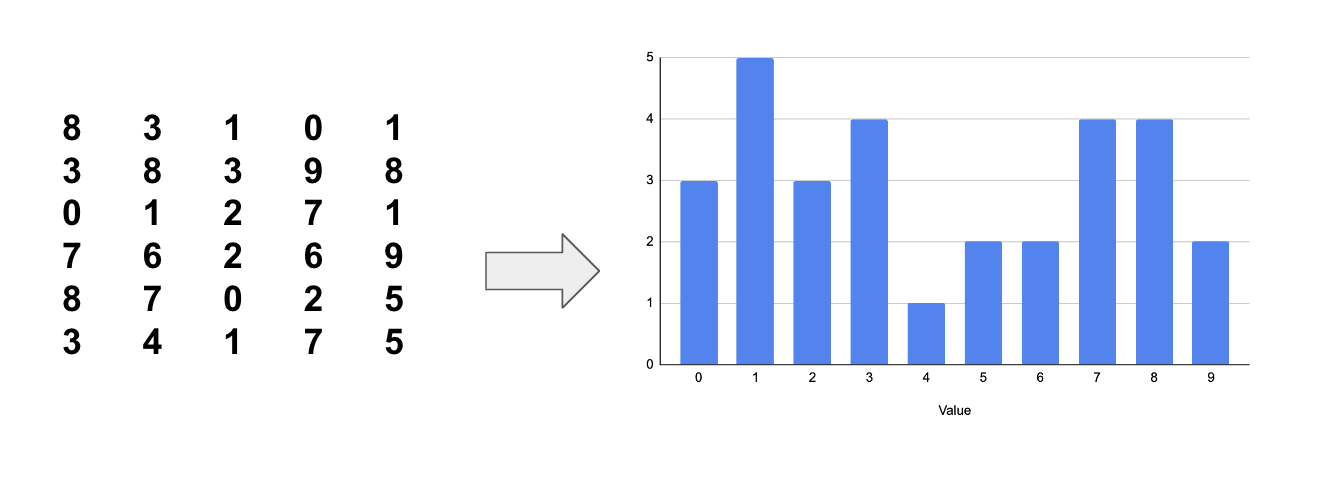
Gateway to understanding

Clearer picture

Visual summary
Positive impact

Looks can be deceiving
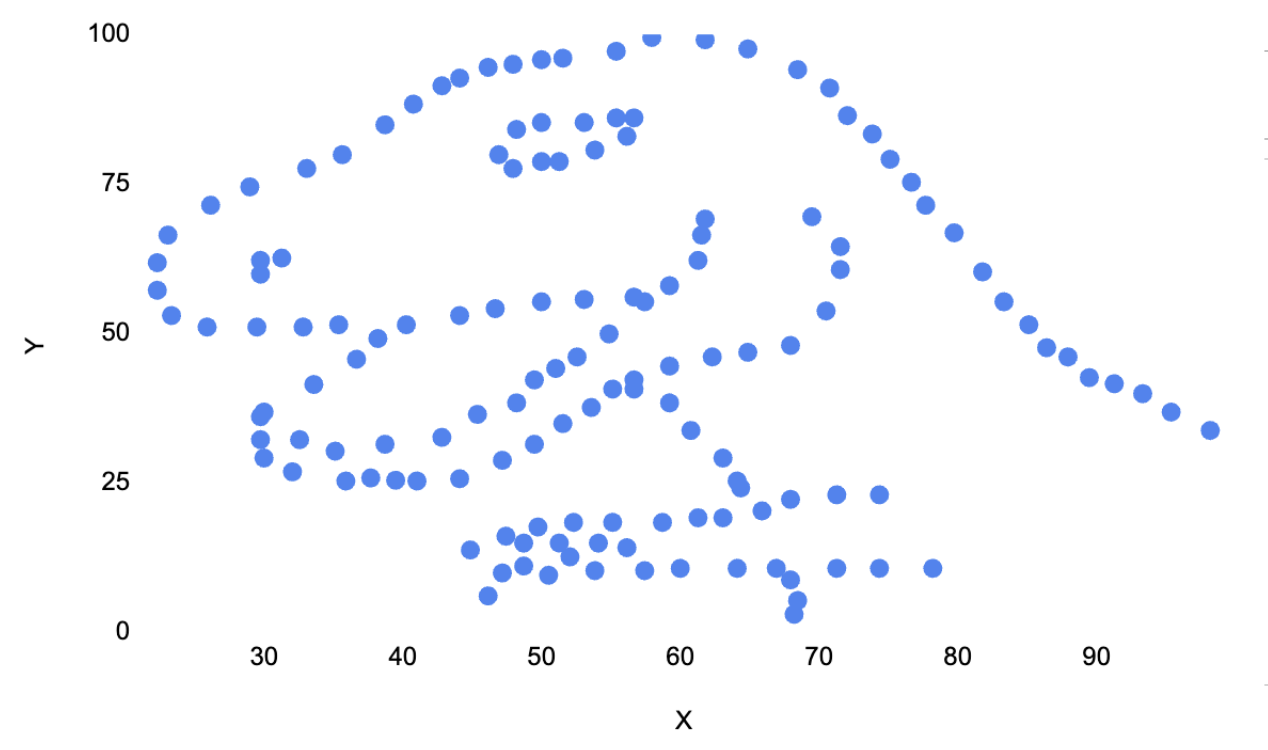
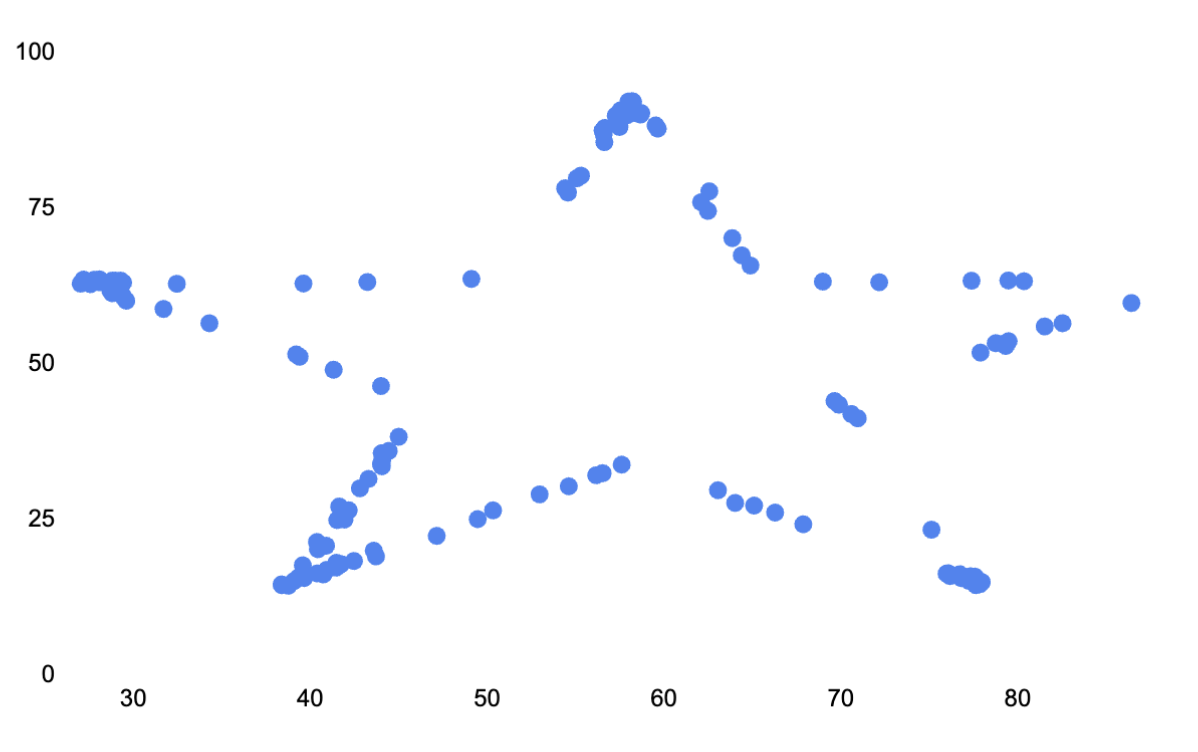
Looks can be deceiving
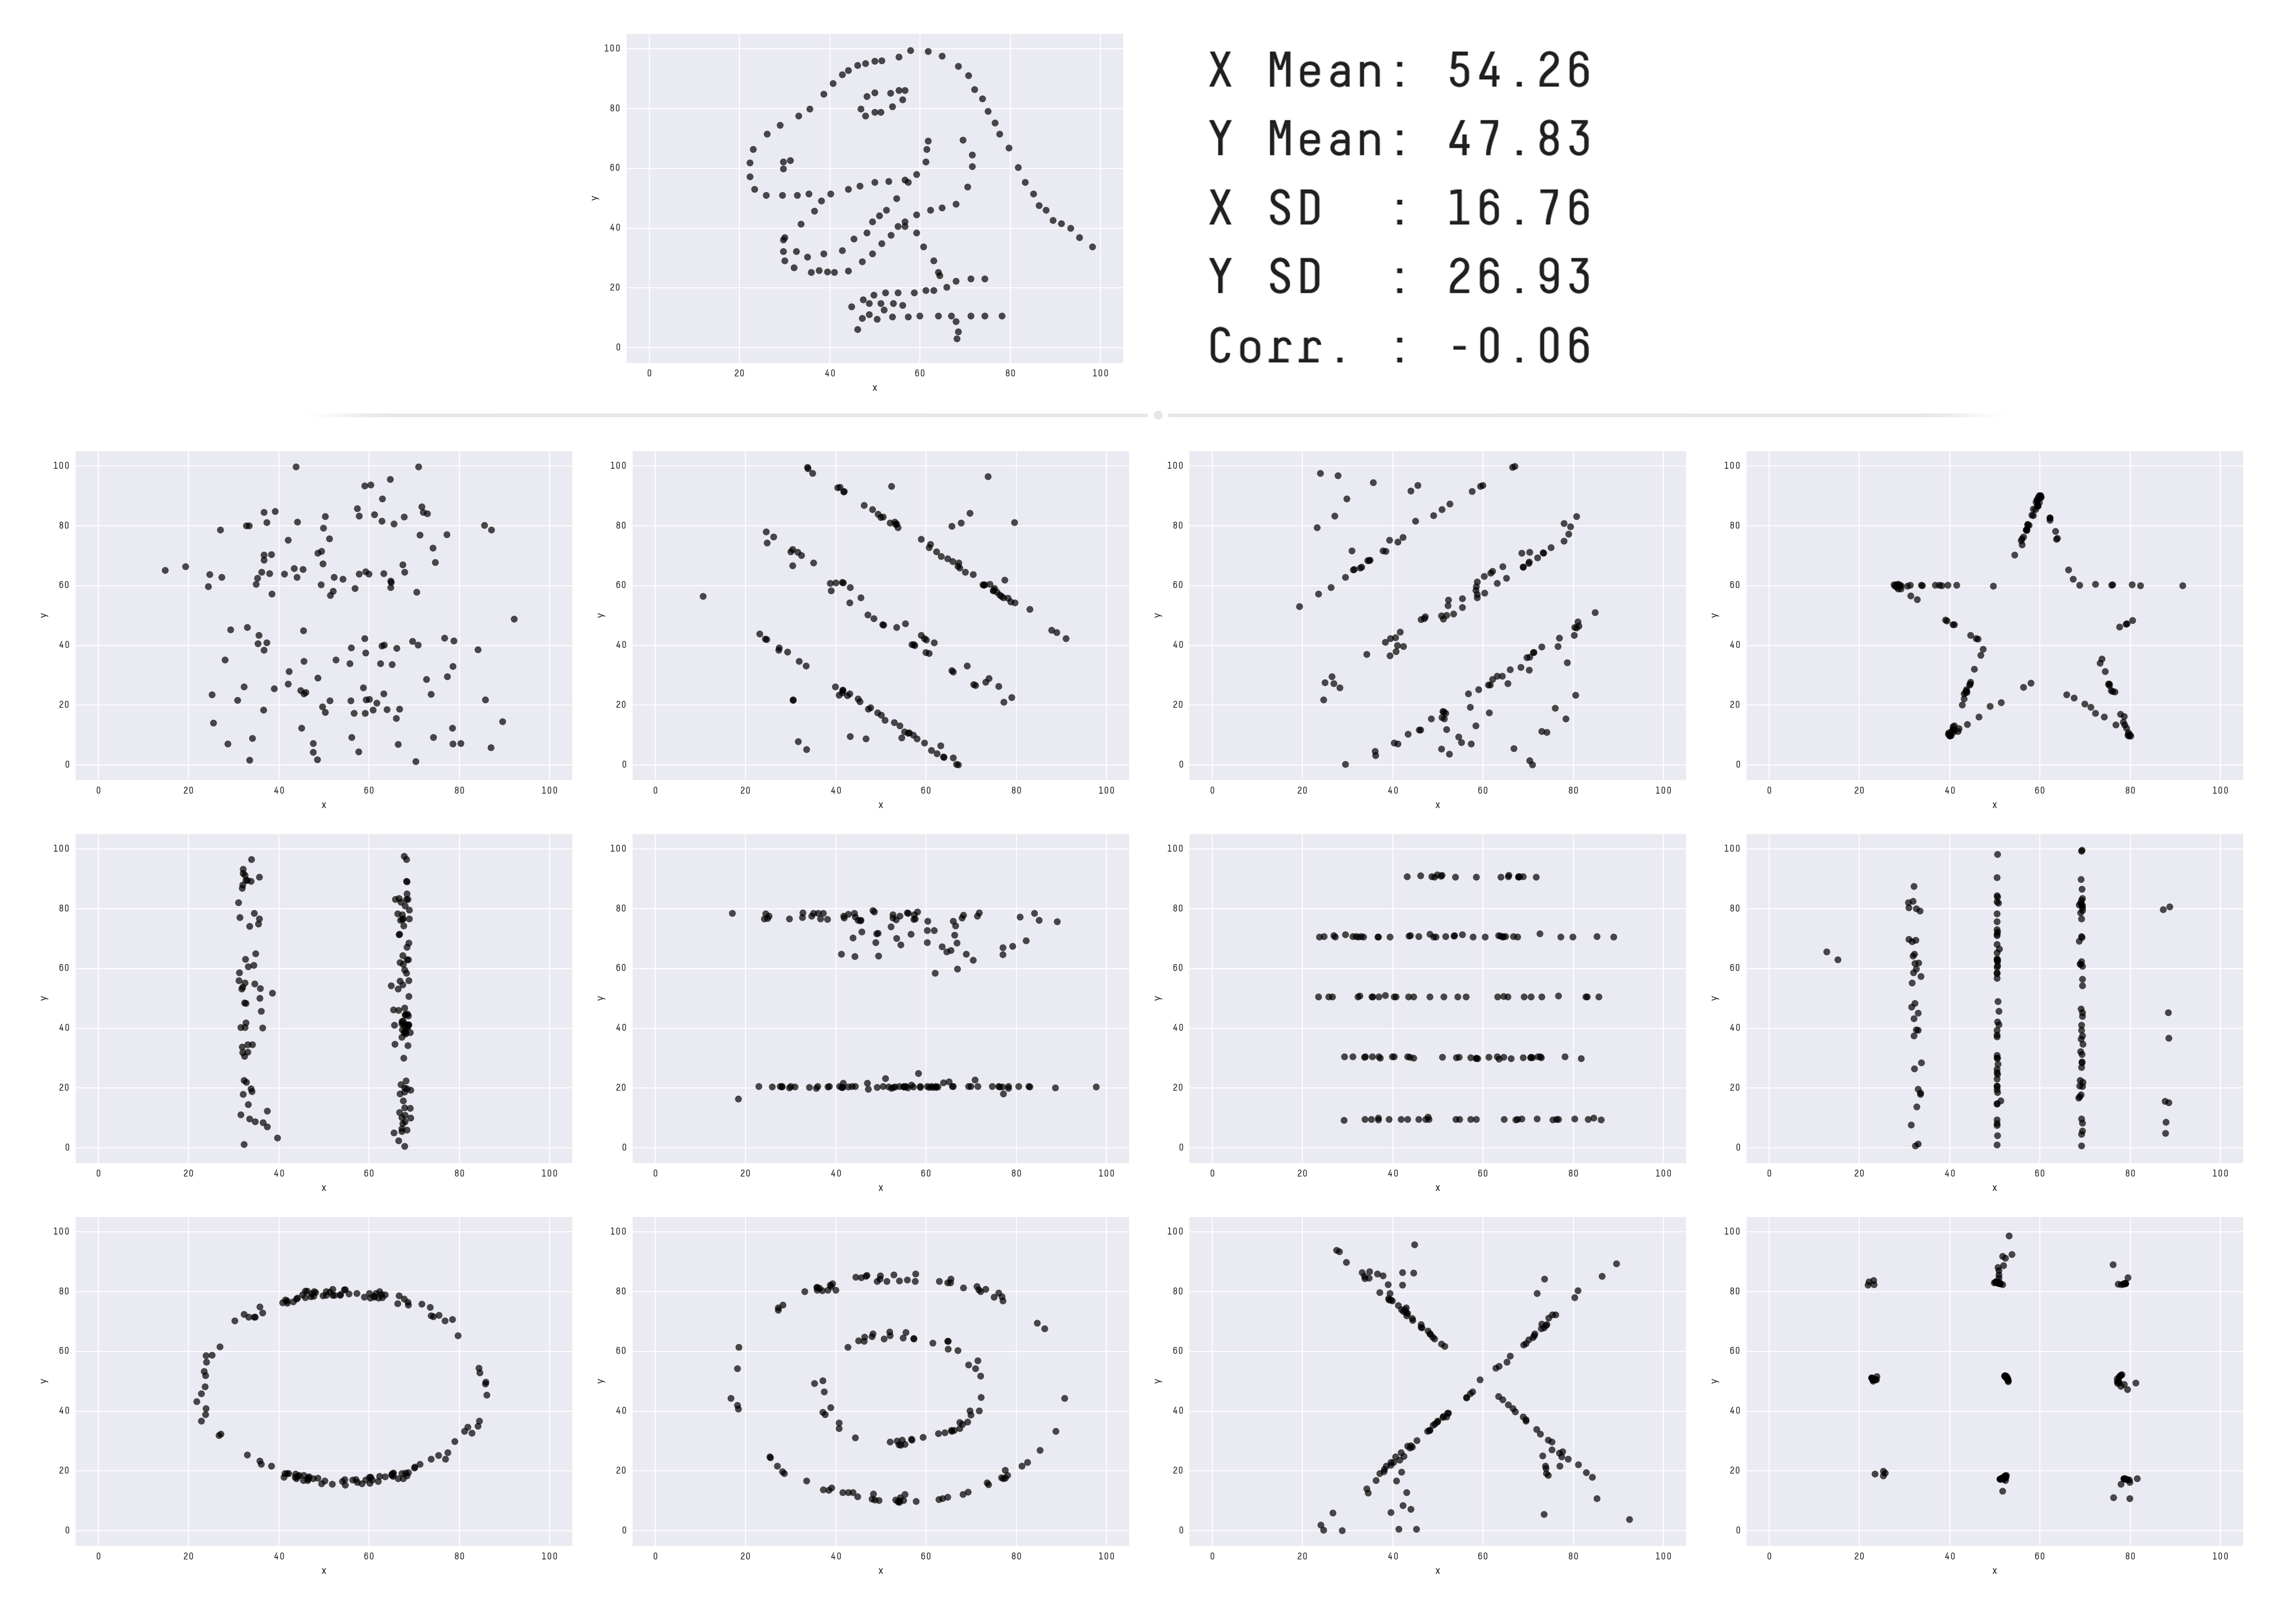
1 https://www.autodesk.com/research/publications/same-stats-different-graphs

