Storytelling in action
Communicating Data Insights

Joe Franklin
Senior Curriculum Manager, DataCamp
Starting line

- What are we trying to say
- What visualization is best to share our message
Buildingsway
| Category | Buildingsway | Competitors |
|---|---|---|
| Exclusive Options | 0.75 | 0.55 |
| Appealing Atmosphere | 0.8 | 0.65 |
| Latest Treehouse Accessories | 0.55 | 0.4 |
| Showroom is arranged nicely | 0.42 | 0.35 |
| Wide Selection | 0.39 | 0.35 |
| Fast sales experience | 0.35 | 0.34 |
| I can find what I'm shopping for | 0.38 | 0.45 |
| Knowledgeable Sales Staff | 0.45 | 0.55 |
| Friendly Associates | 0.45 | 0.6 |
| Quick Builder Feedback | 0.4 | 0.6 |
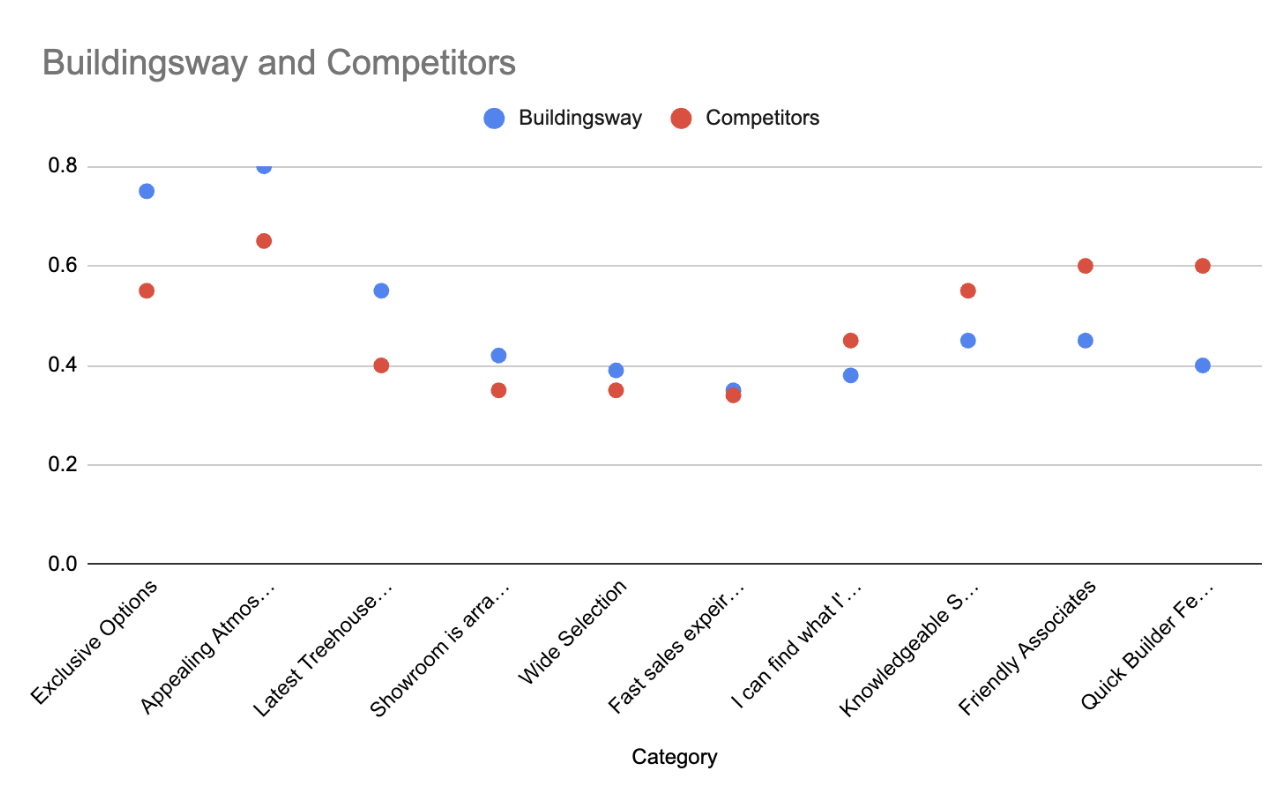
Scatter dud
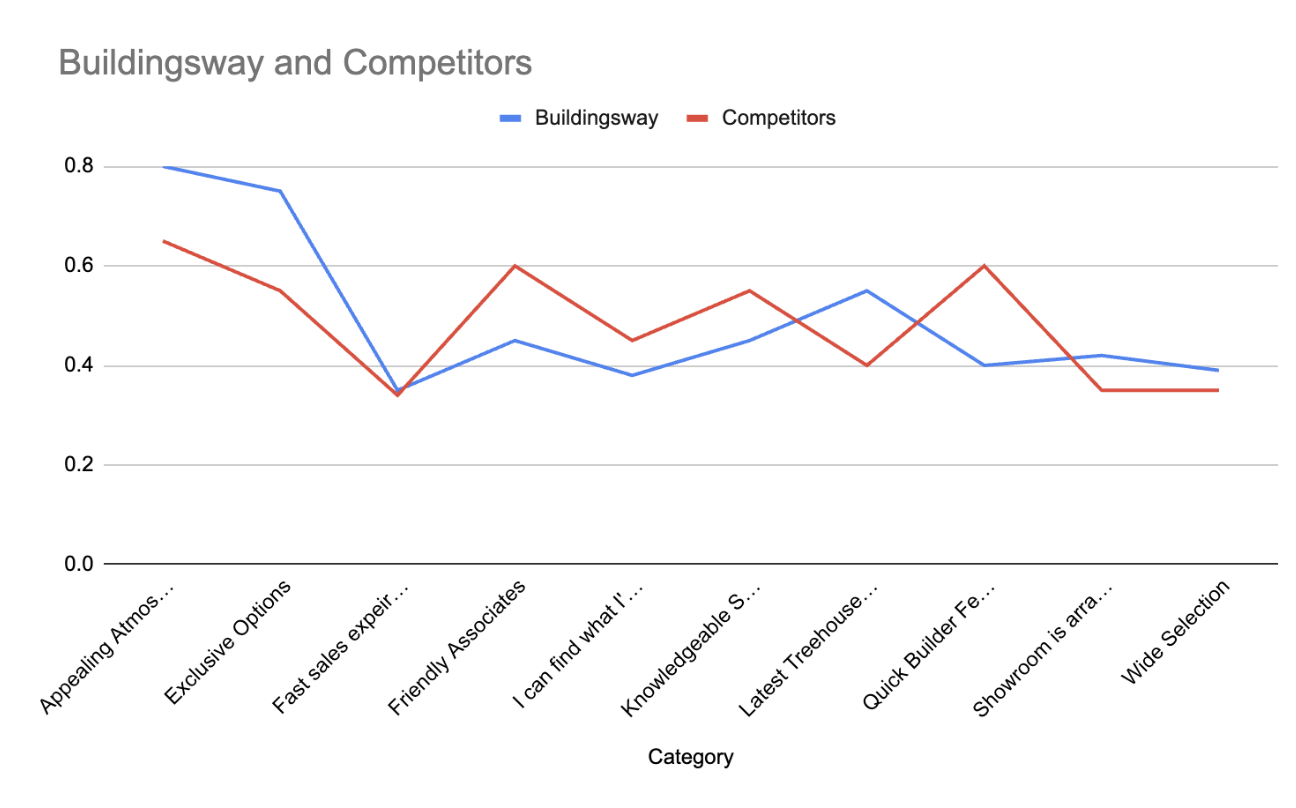
Line them up
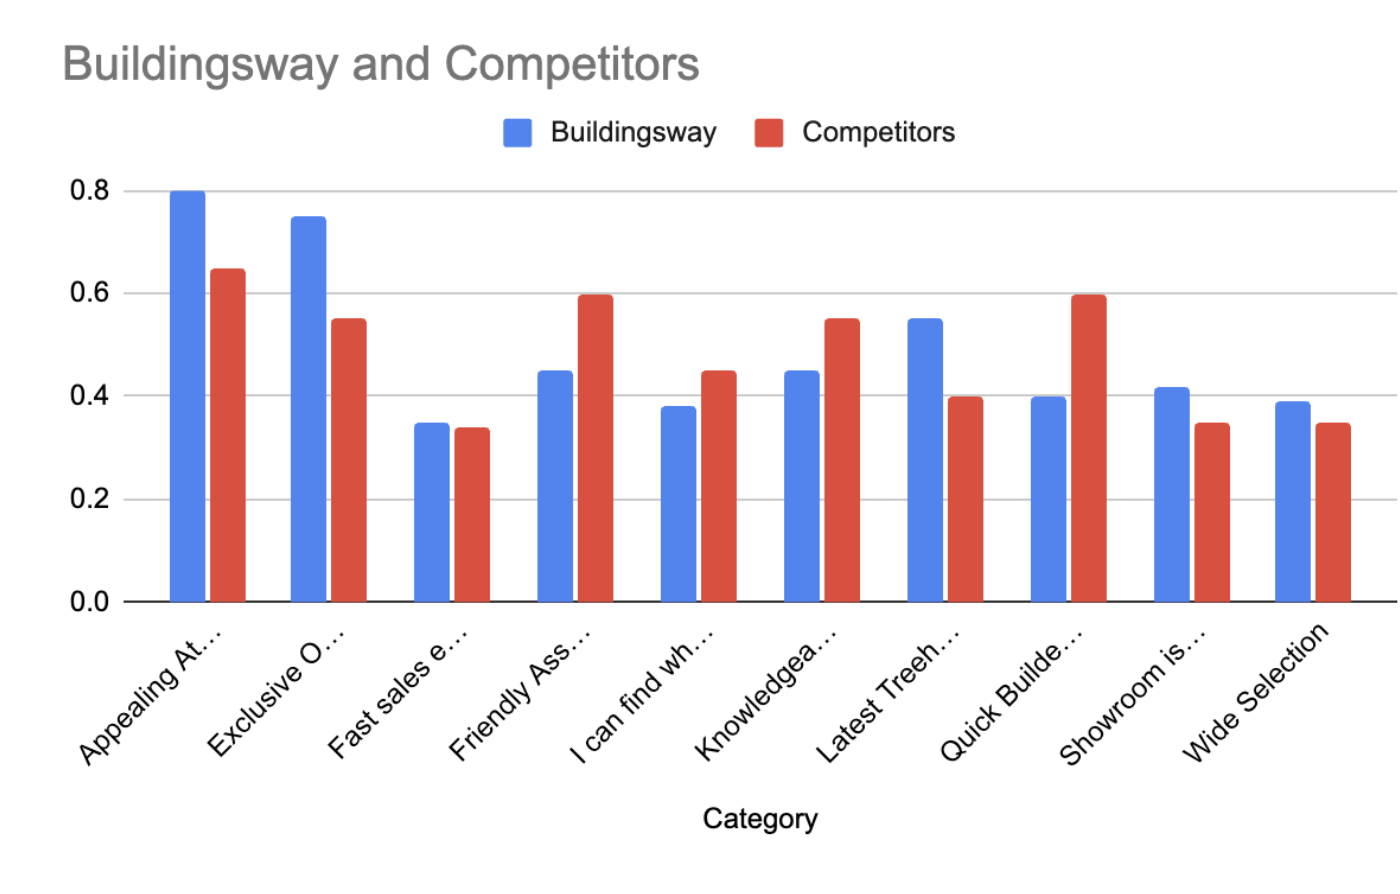
Two graphs walk into a bar
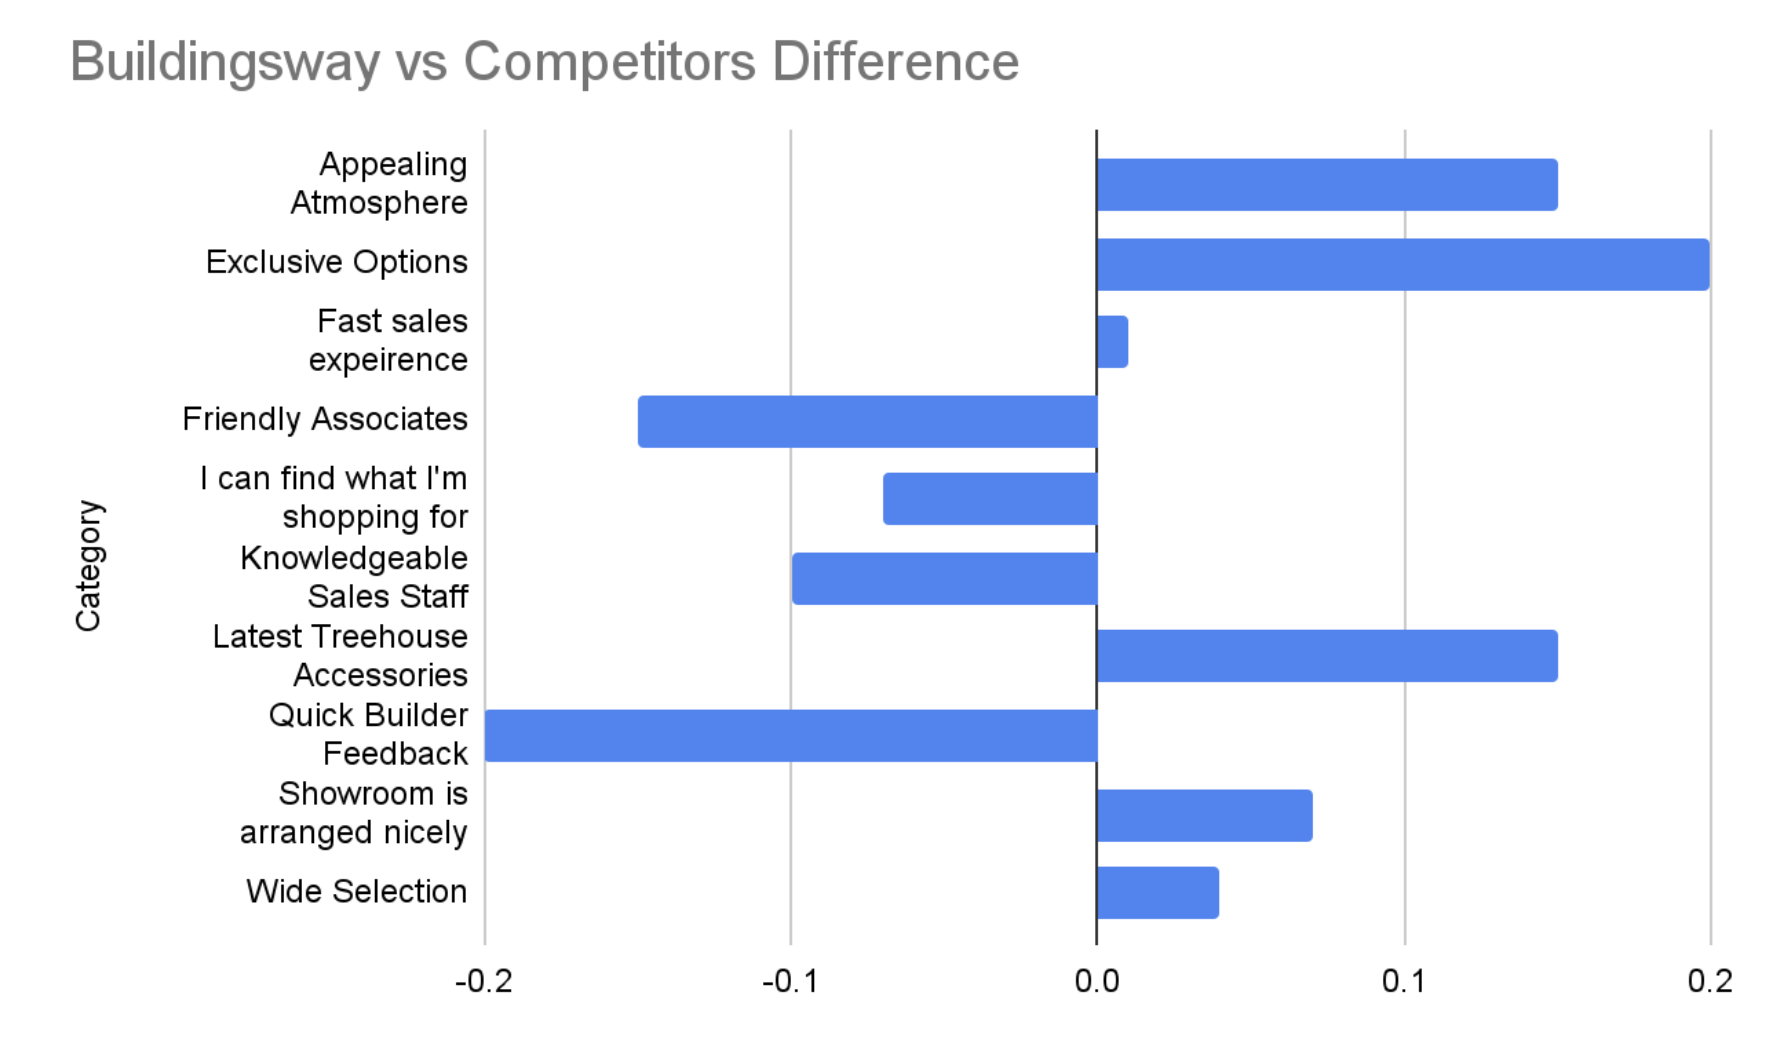
What a difference
Rough around the edges
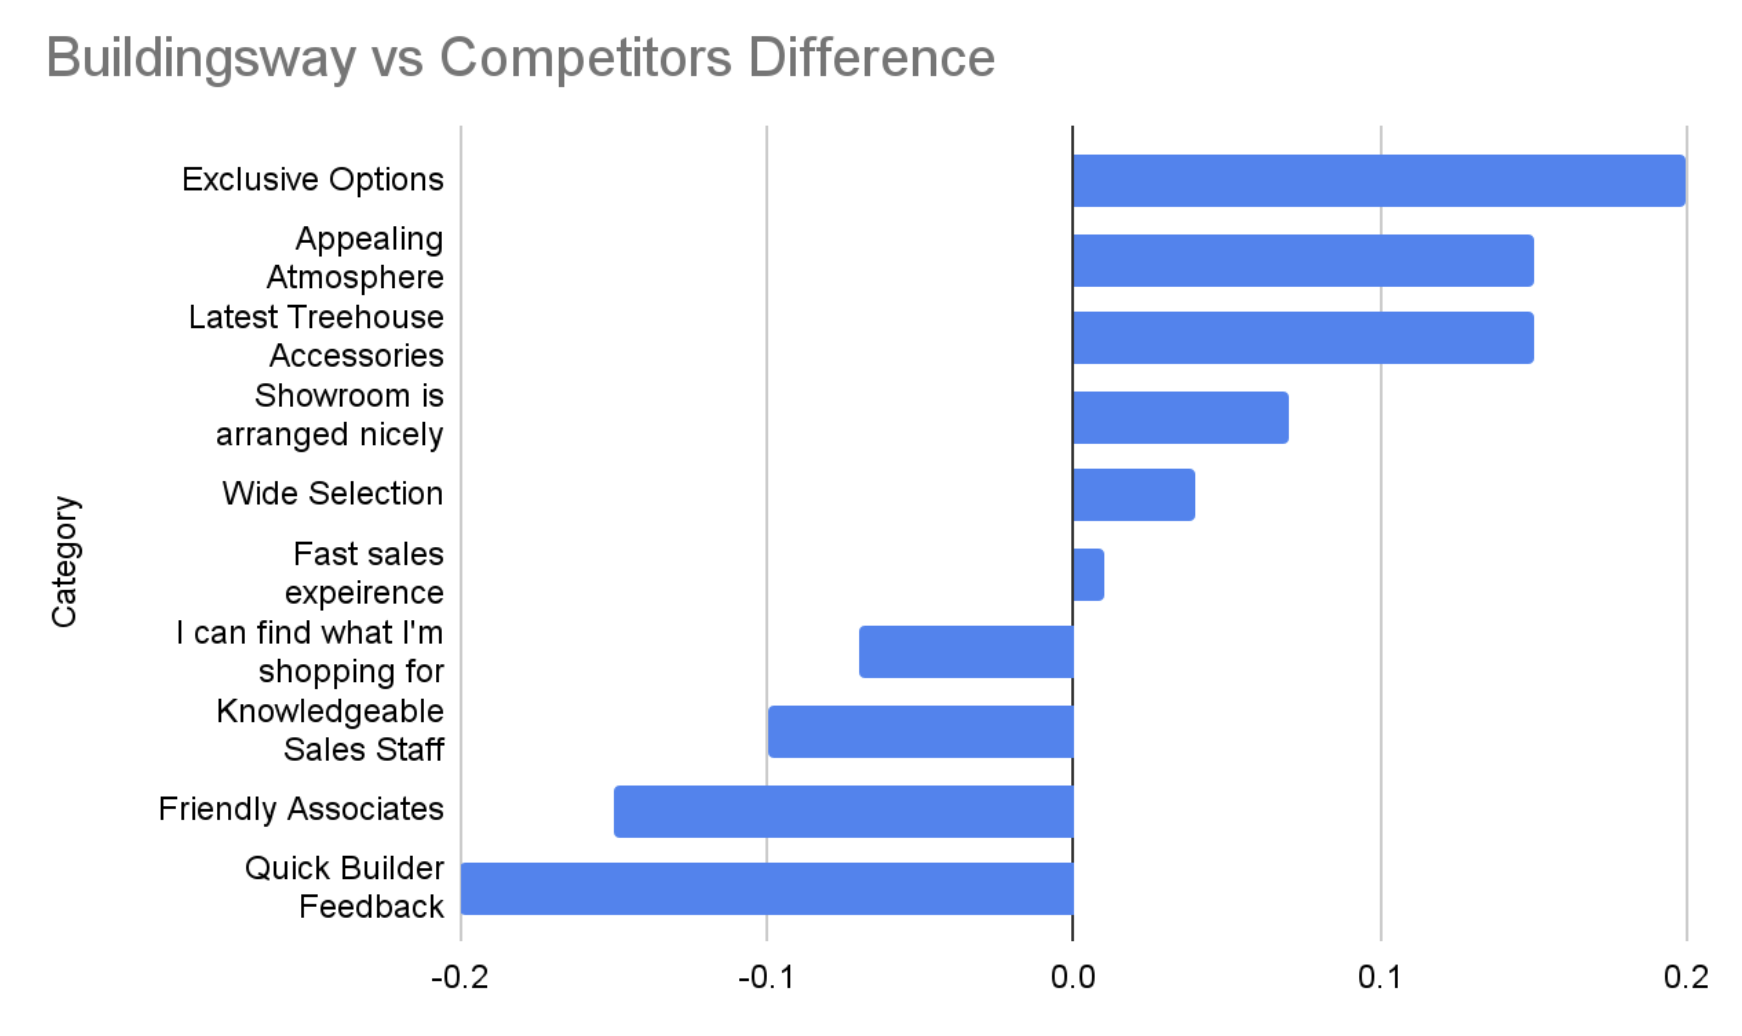
Leveling up

Strong interaction presentation
Universal Principles
- Incorporate text
- Utilize color
- Simply visual elements
Getting wordy
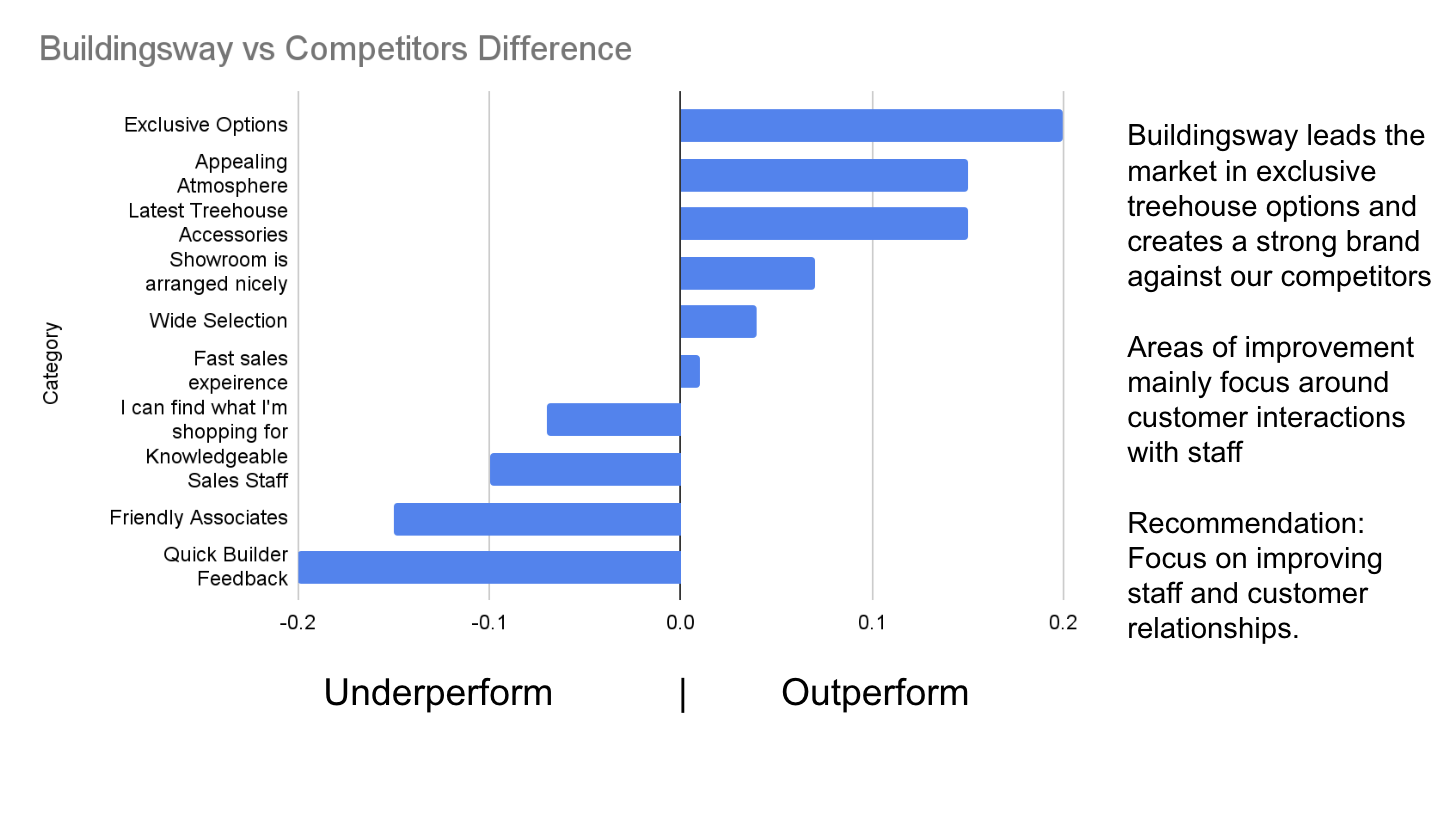
Coloring between the lines
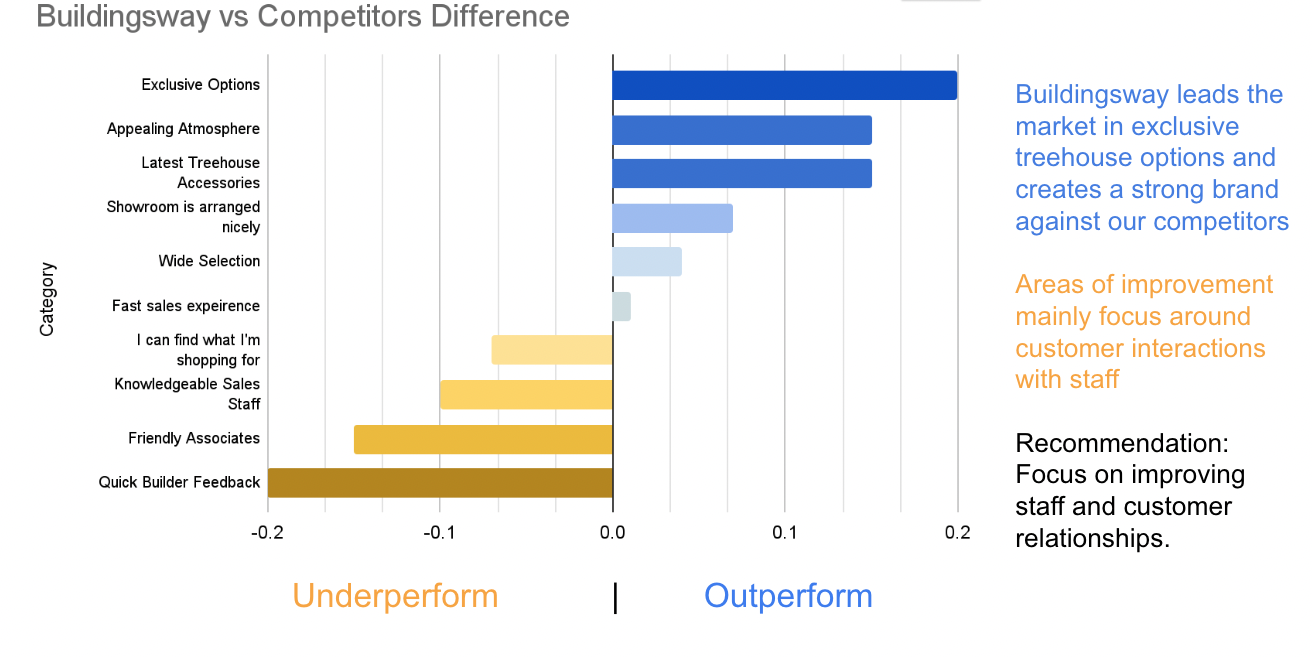
Simplifying the journey
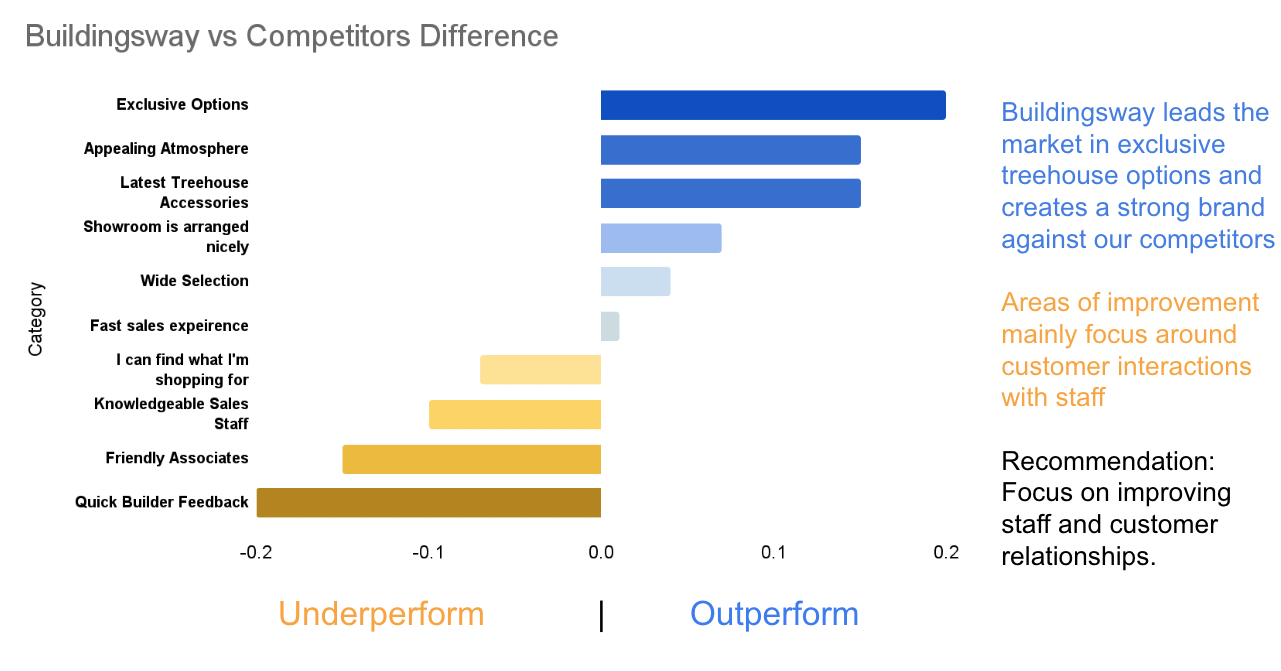
Let's practice!
Communicating Data Insights

