Data storytelling

Communicating Data Insights

Joe Franklin

Senior Curriculum Manager, DataCamp

A picture tells a thousand words?


Two 3d pie charts showing pre-treatment and post-treatment results

Communicating Data Insights

A story tells a single insight
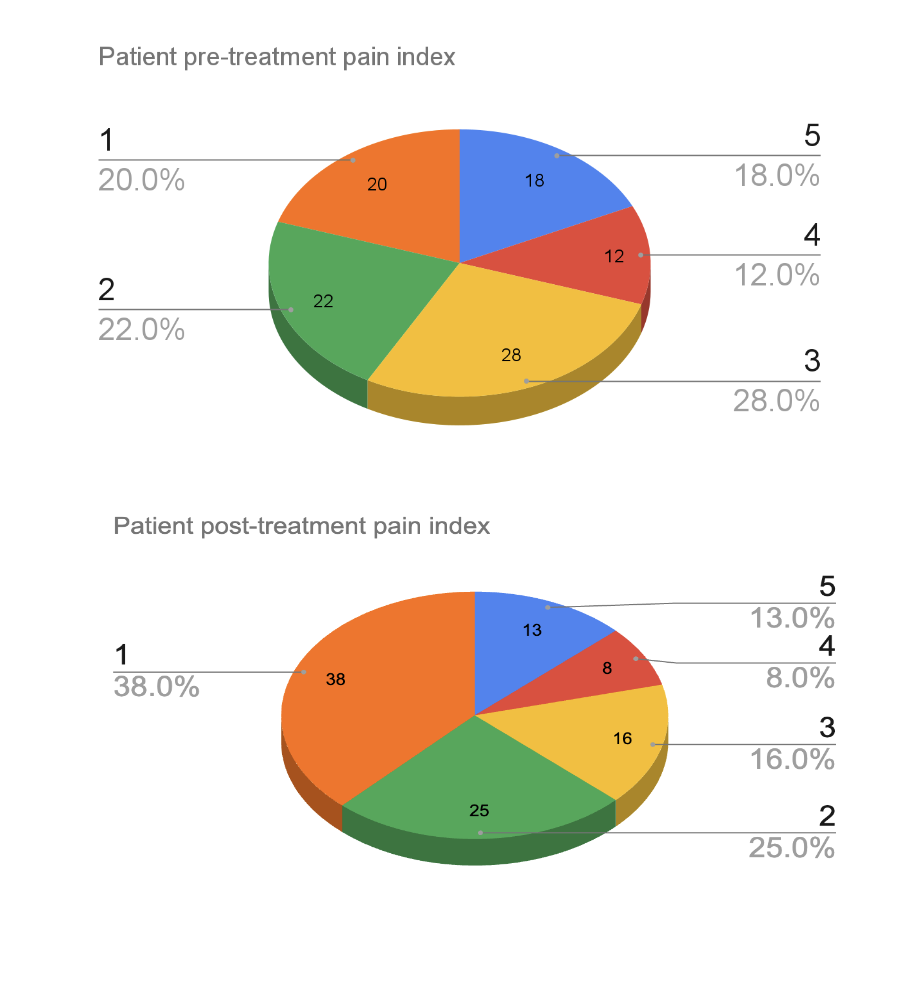
Bar chart with two variables

Communicating Data Insights

Spot the difference


Bar chart with two variables

Two 3d pie charts showing pre-treatment and post-treatment results

Communicating Data Insights

Why?


Data story distinctions

  • Easier to understand
  • Inspire action
  • Retain information


Pair visualizations with written communication

Why Sign

Communicating Data Insights

Engagement

Donate Button.jpg


Stories increase engagement over raw data.


Method Donation amount
Data only             $1.14
Data story            $2.38
1 Small, D. A., Loewenstein, G., & Slovic, P. (2007). Sympathy and callousness: The impact of deliberative thought on donations to identifiable and statistical victims.
Communicating Data Insights

Sticky situation

Man Sitting on Armchair.jpg


Remembering individual numbers is hard


Retaining the impact of stories is much easier

1 Heath, C., & Heath, D. (2010). Made to stick: Why some ideas survive and others die.
Communicating Data Insights

Let's practice!

Communicating Data Insights

Preparing Video For Download...