Visualizing data on geographical maps
Data Visualization in Tableau

Agata Bak-Geerinck
Senior Data Analyst, Telenet
The digital cartography


Basic (digital) geometries
Point: an exact location on the space
- Requires
X,Ycoordinates - (optional)
Zcoordinate indicates height
- Requires
Line: "polygonal chain", sequence of points
- Requires a set of sequential points
- Polygon: a plane figure described by a finite number of line segments
- Requires a set of lines (polygonal chains)
- Starting and closing point
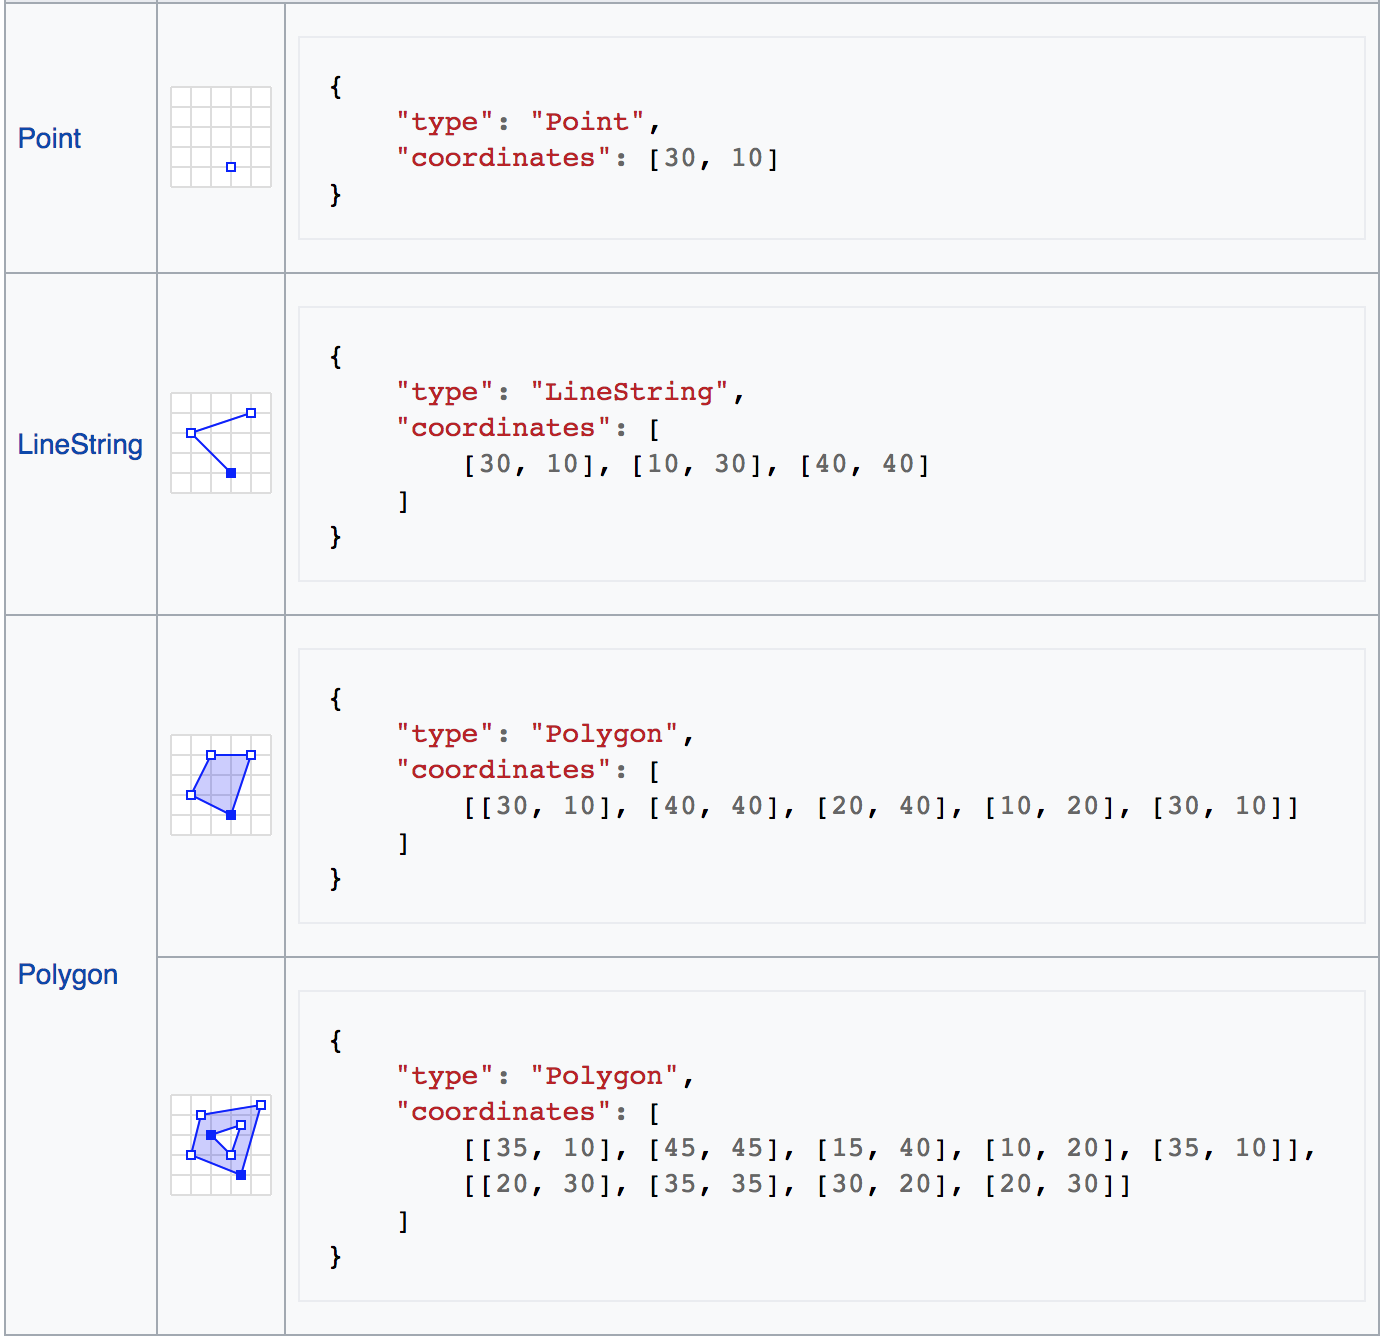
1 Picture: https://en.wikipedia.org/wiki/GeoJSON
Various (geographical) spatial data types
Plain text/spreadsheet files:
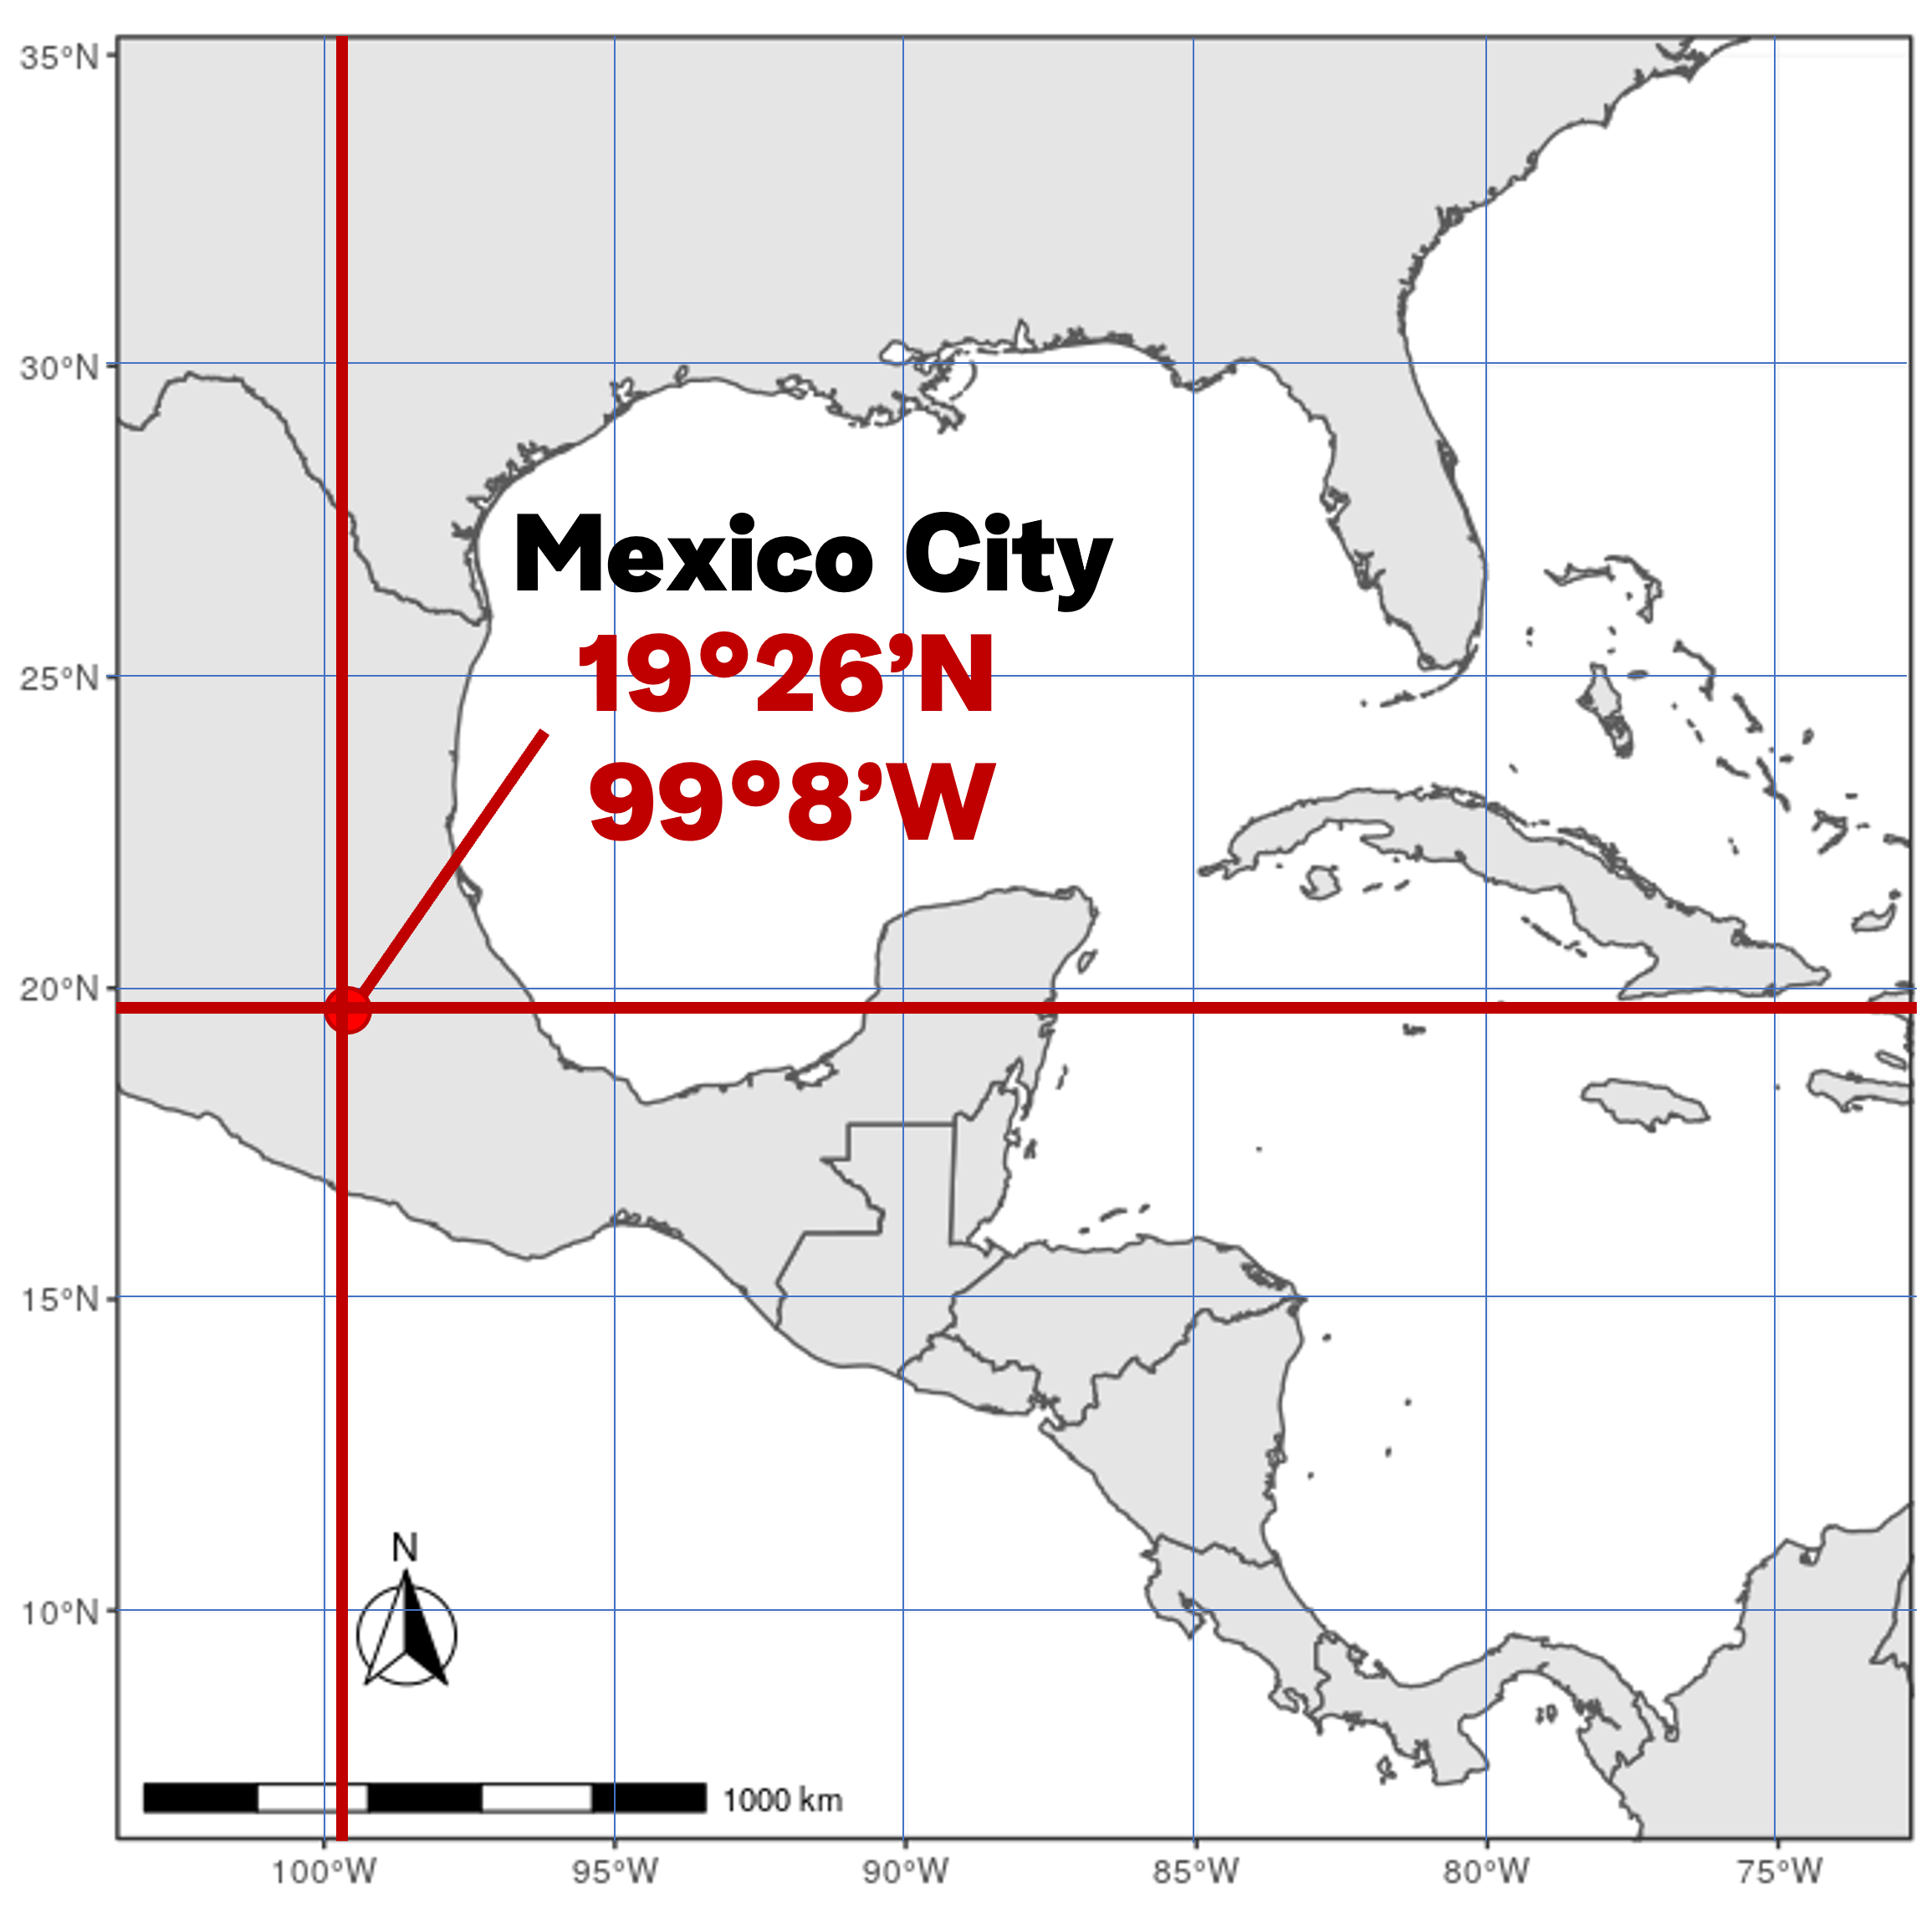
- Latitude/Longitude e.g. 19.25 and 99.8
- Names and codes, e.g., US, London but also (airport) LAX or (NUTS$^1$) BE231 in Europe
Spatial files (e.g. Shapefile or GeoJSON)
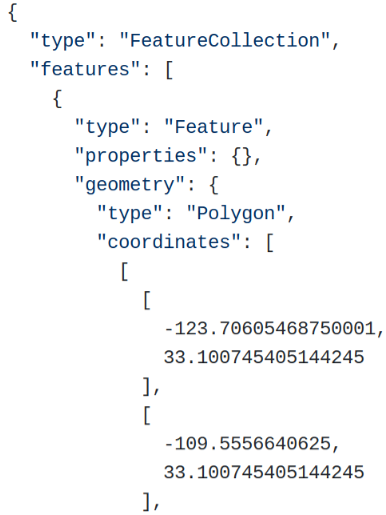
- An object containing information about the specific geometry (e.g., point, line, polygon, etc.) along with optional metadata
1 NUTS = Nomenclature of territorial units for statistics
Recognizing the fields as geographical data
- Assigning a correct geographic role to fields
- Tableau map server auto generates latitude/longitude information
- Double-check the spelling, and number formatting:
- Lat/Long require numeric, decimal data
- Correcting typos/ alternative spelling
- Upload custom geocoding file, if needed
Working with GeoJSONs
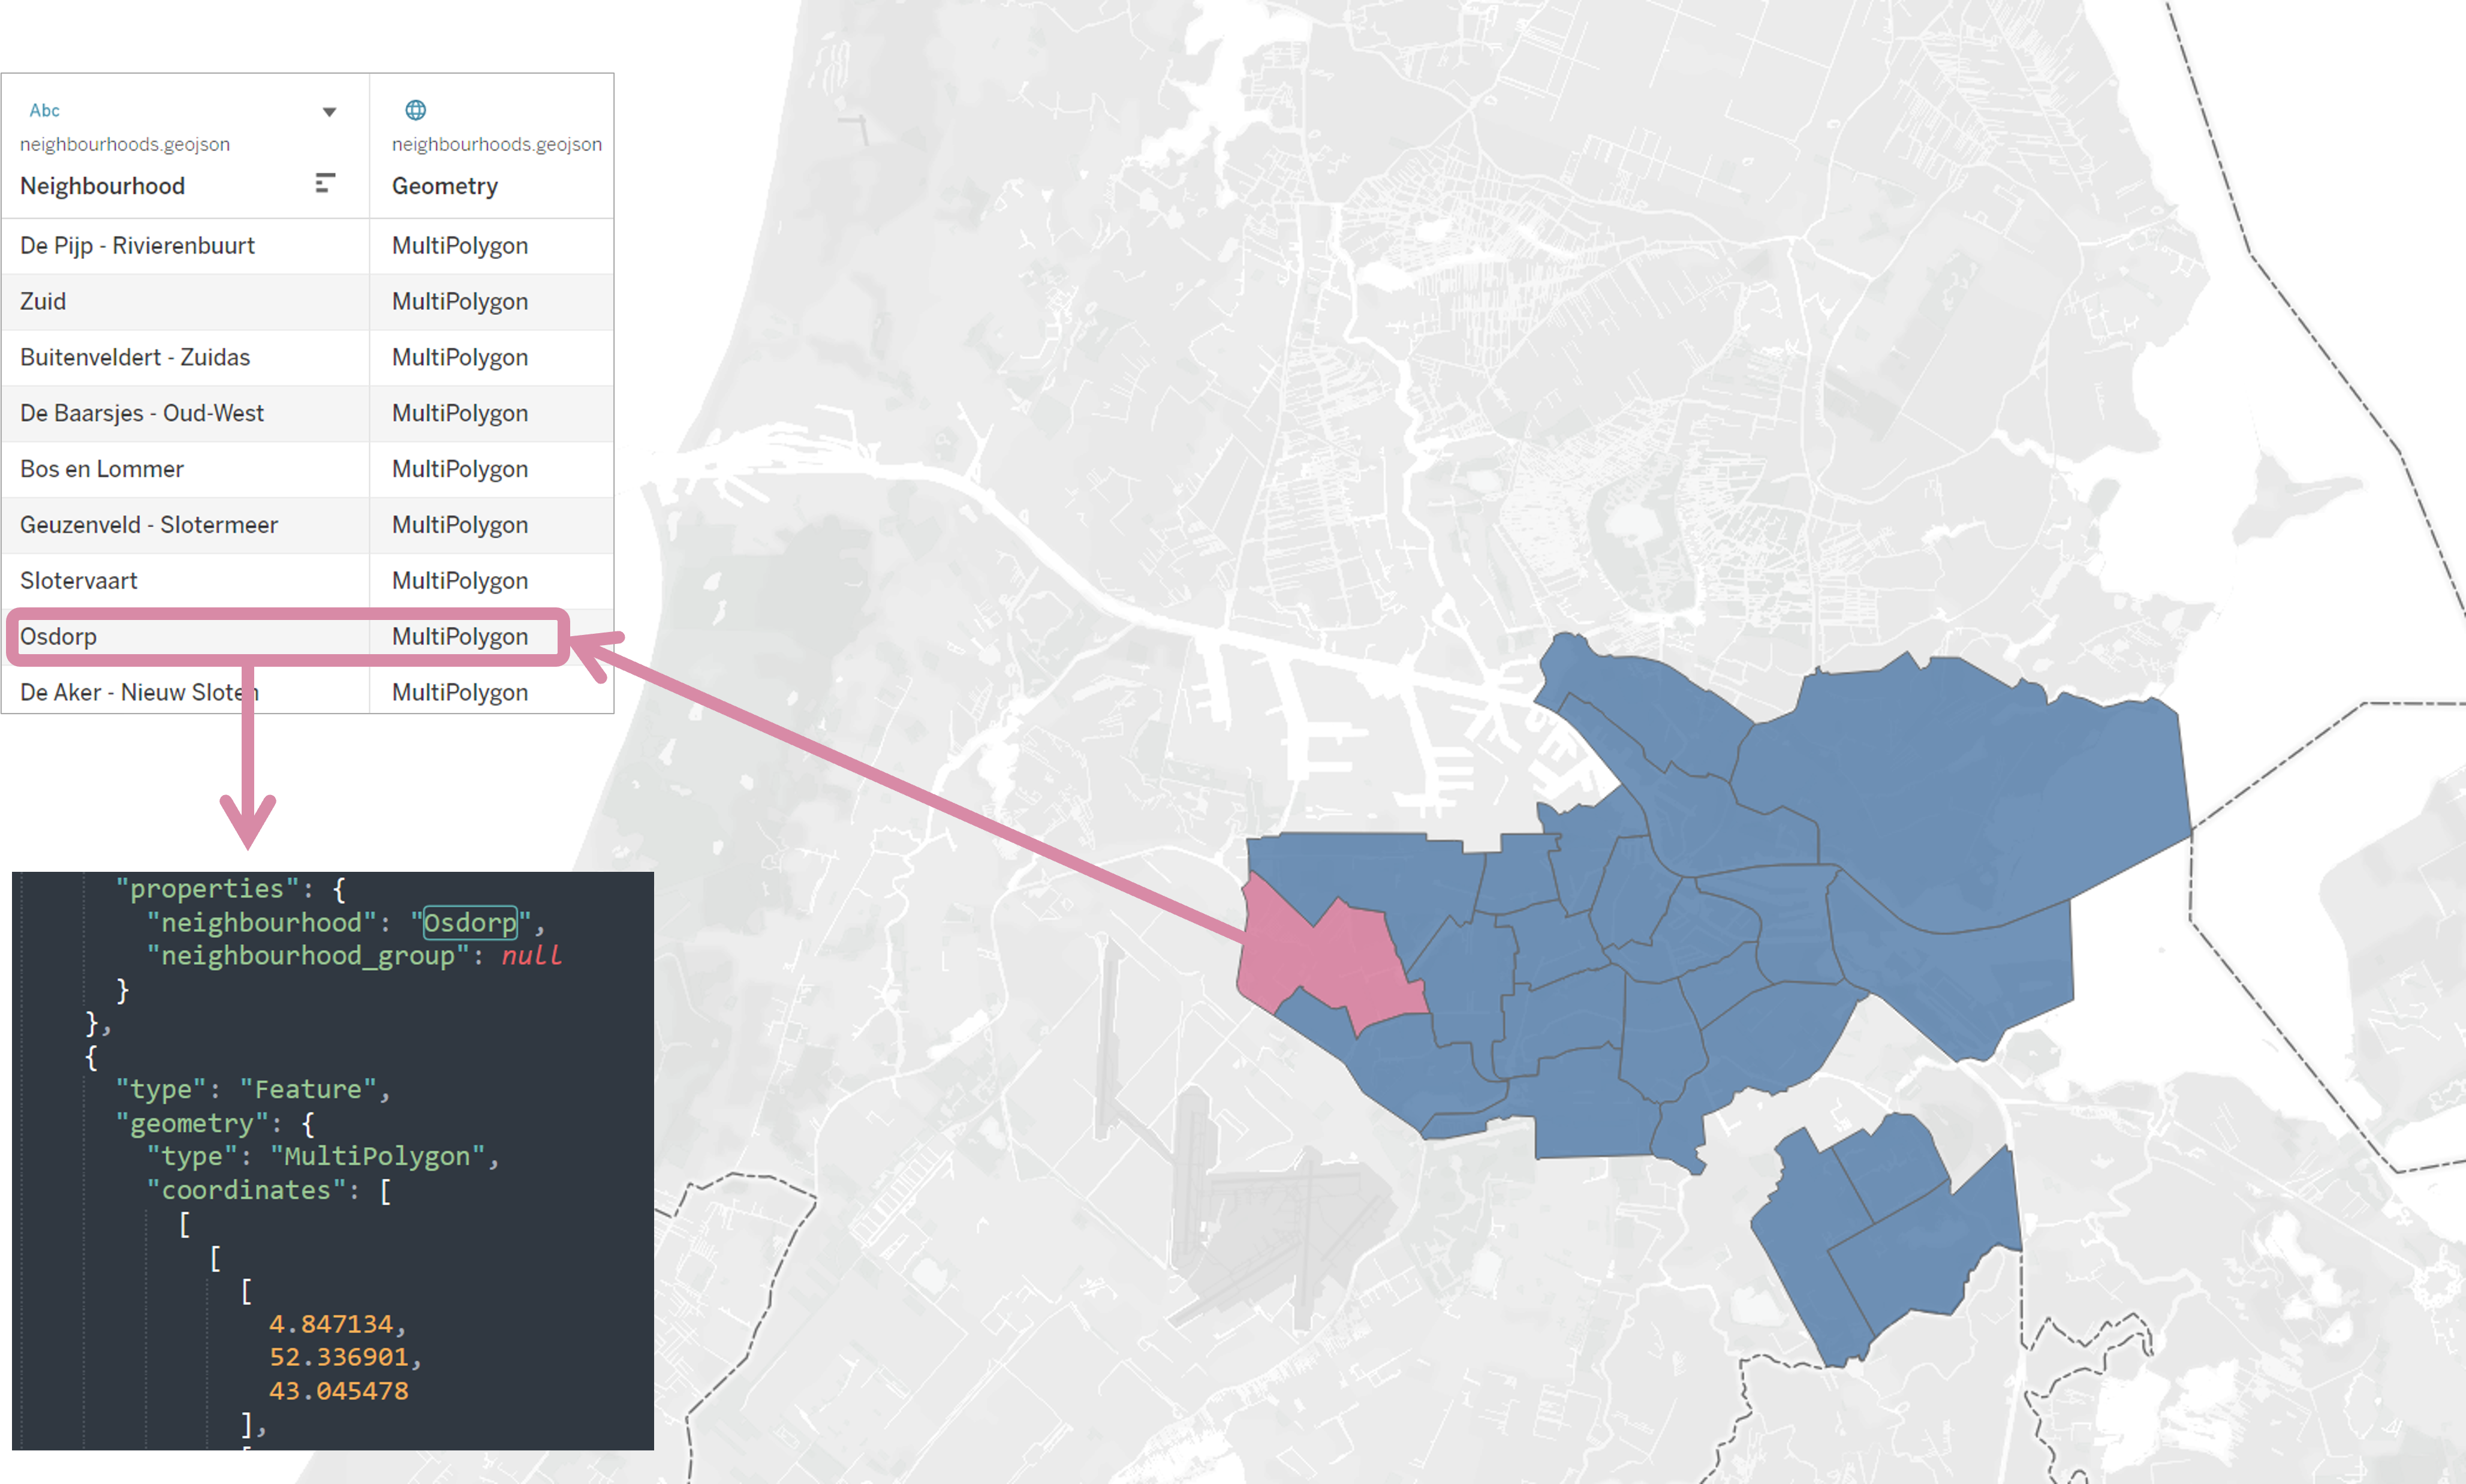
1 https://geojson.io/
Airbnb dataset
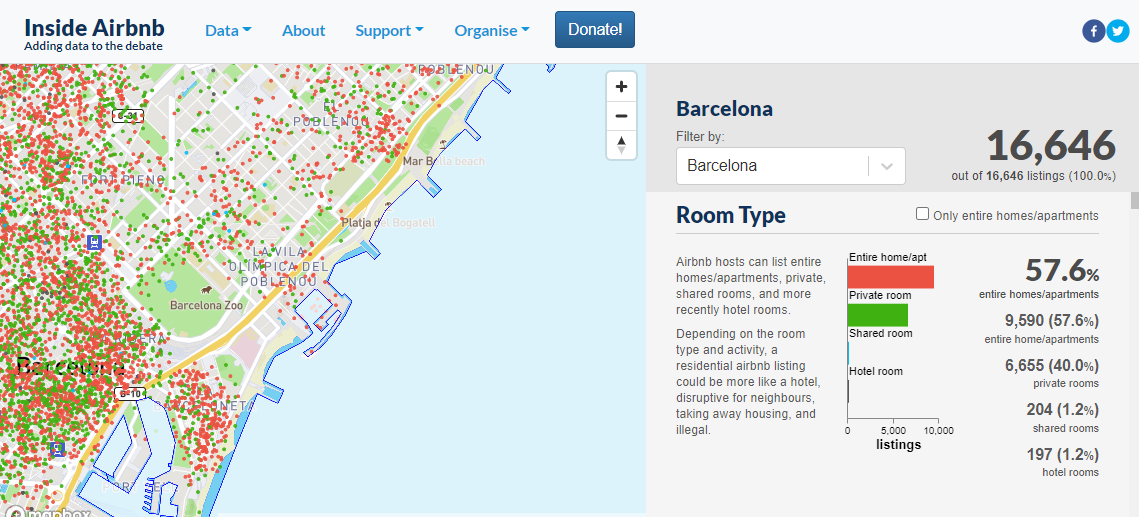
1 http://insideairbnb.com/barcelona

