Advanced visualizations
Data Visualization in Tableau

Maarten Van den Broeck
Content Developer, DataCamp
The principles of an infographic

Well-designed - colorful - useful
- Easy to follow flow and design
- Minimum text, maximum readability
- Accent on key data points and elements
- Coherent use of color and scales
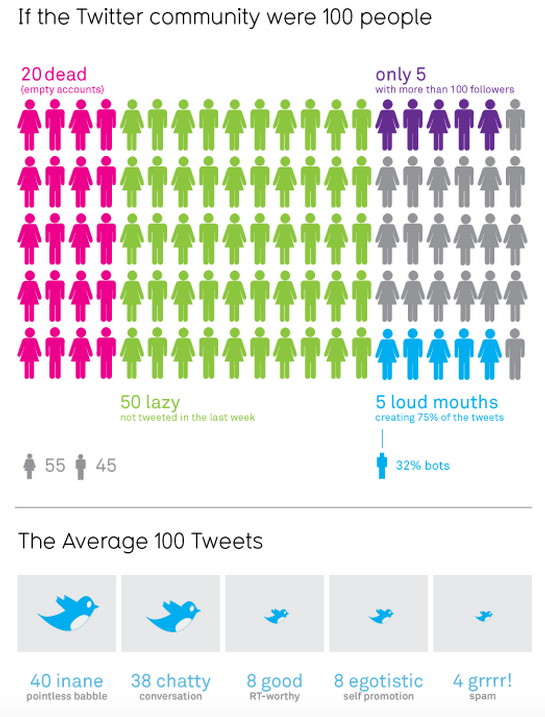
1 David McCandless, https://informationisbeautiful.net/2009/if-twitter-was-100-people/
Meet our new charts
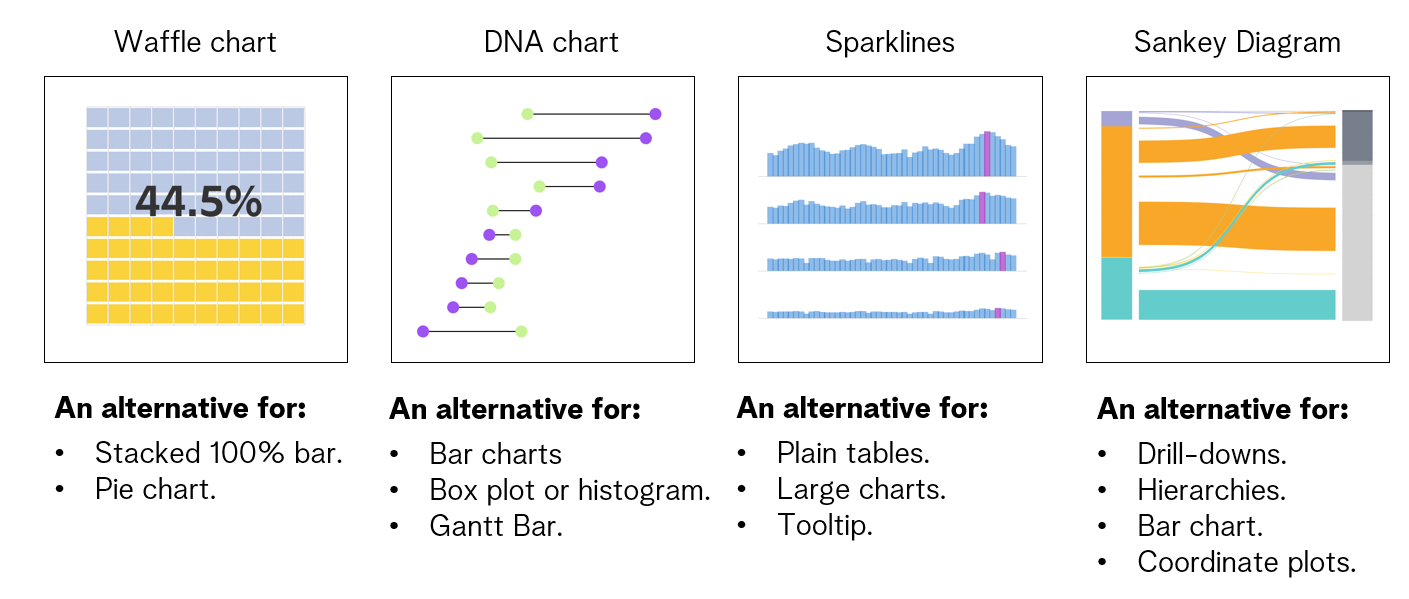
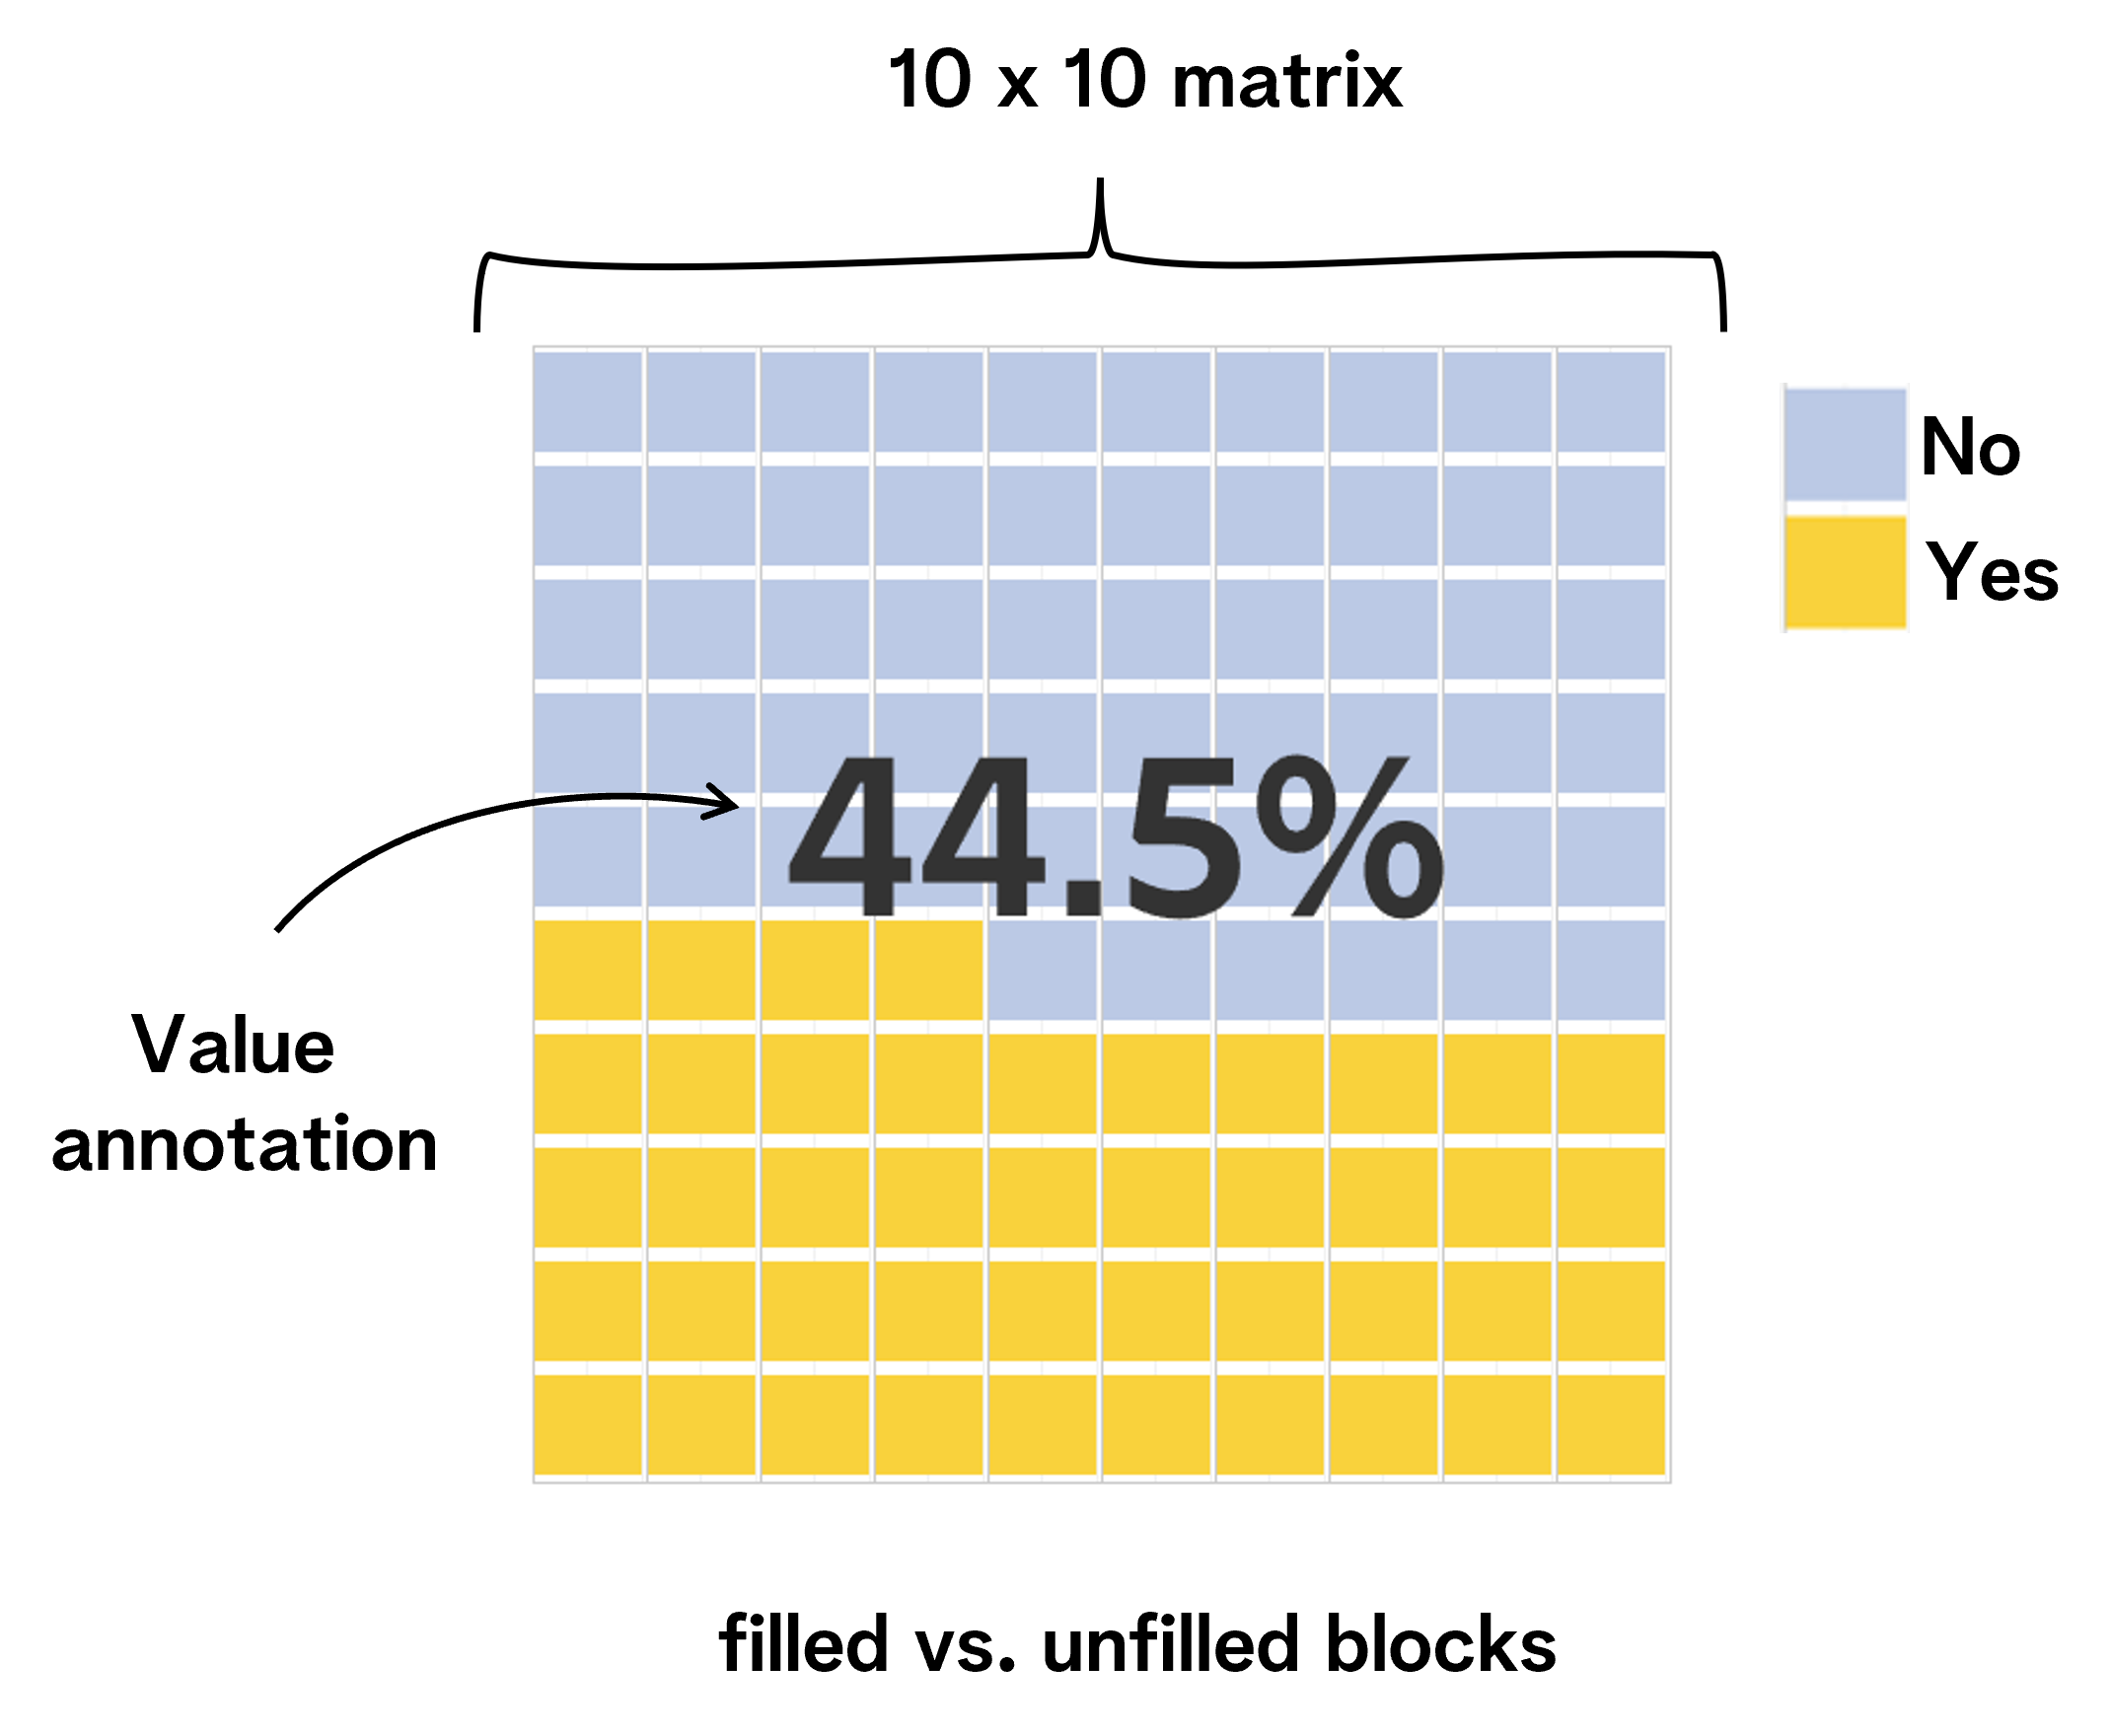
Waffle chart
- N on N matrix (10 x 10, 100 x 100...)
- Visualizing part of the total
- A good alternative for:
- Stacked bar charts
- Pie/donut charts
- Can be turned into a pictogram
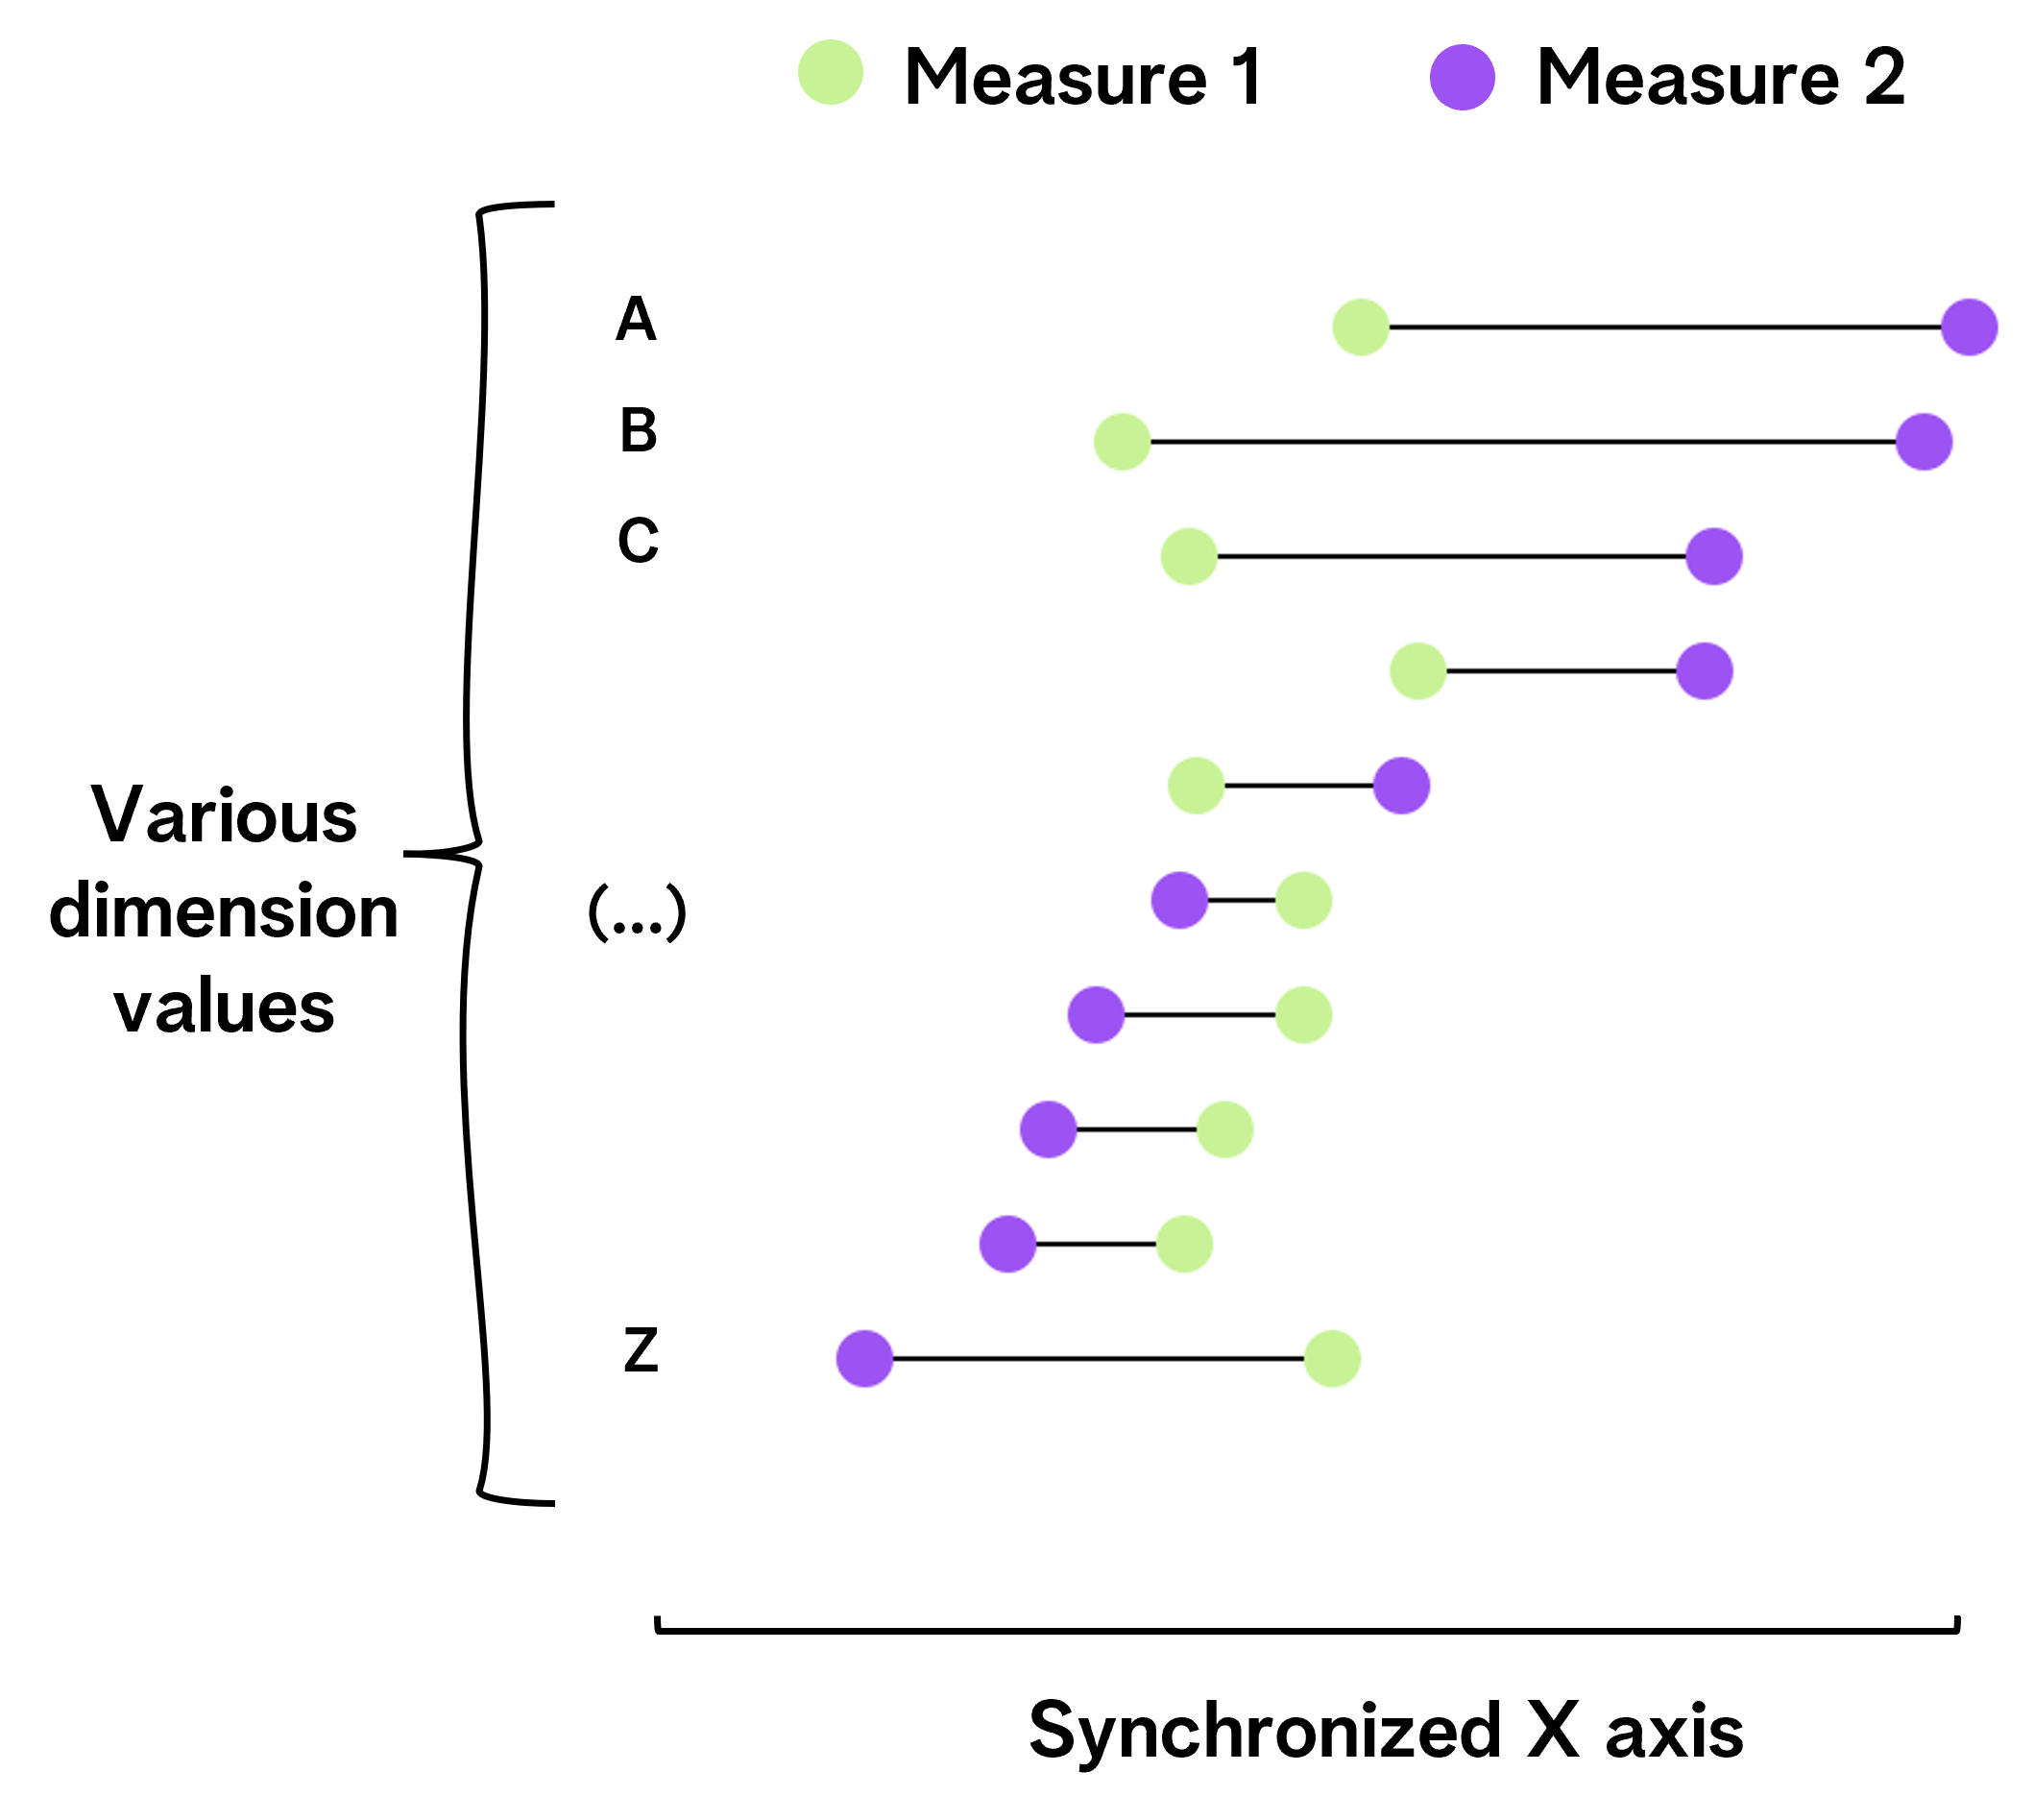
DNA (dumbbell) chart
- Excellent for visualizing ranges and measuring the gap
- Requires:
- Clear axis or data points labeling
- X-axis synchronization
- A good alternative for:
- Comparison charts (e.g. bar charts)
- Distribution charts (e.g. box plots)
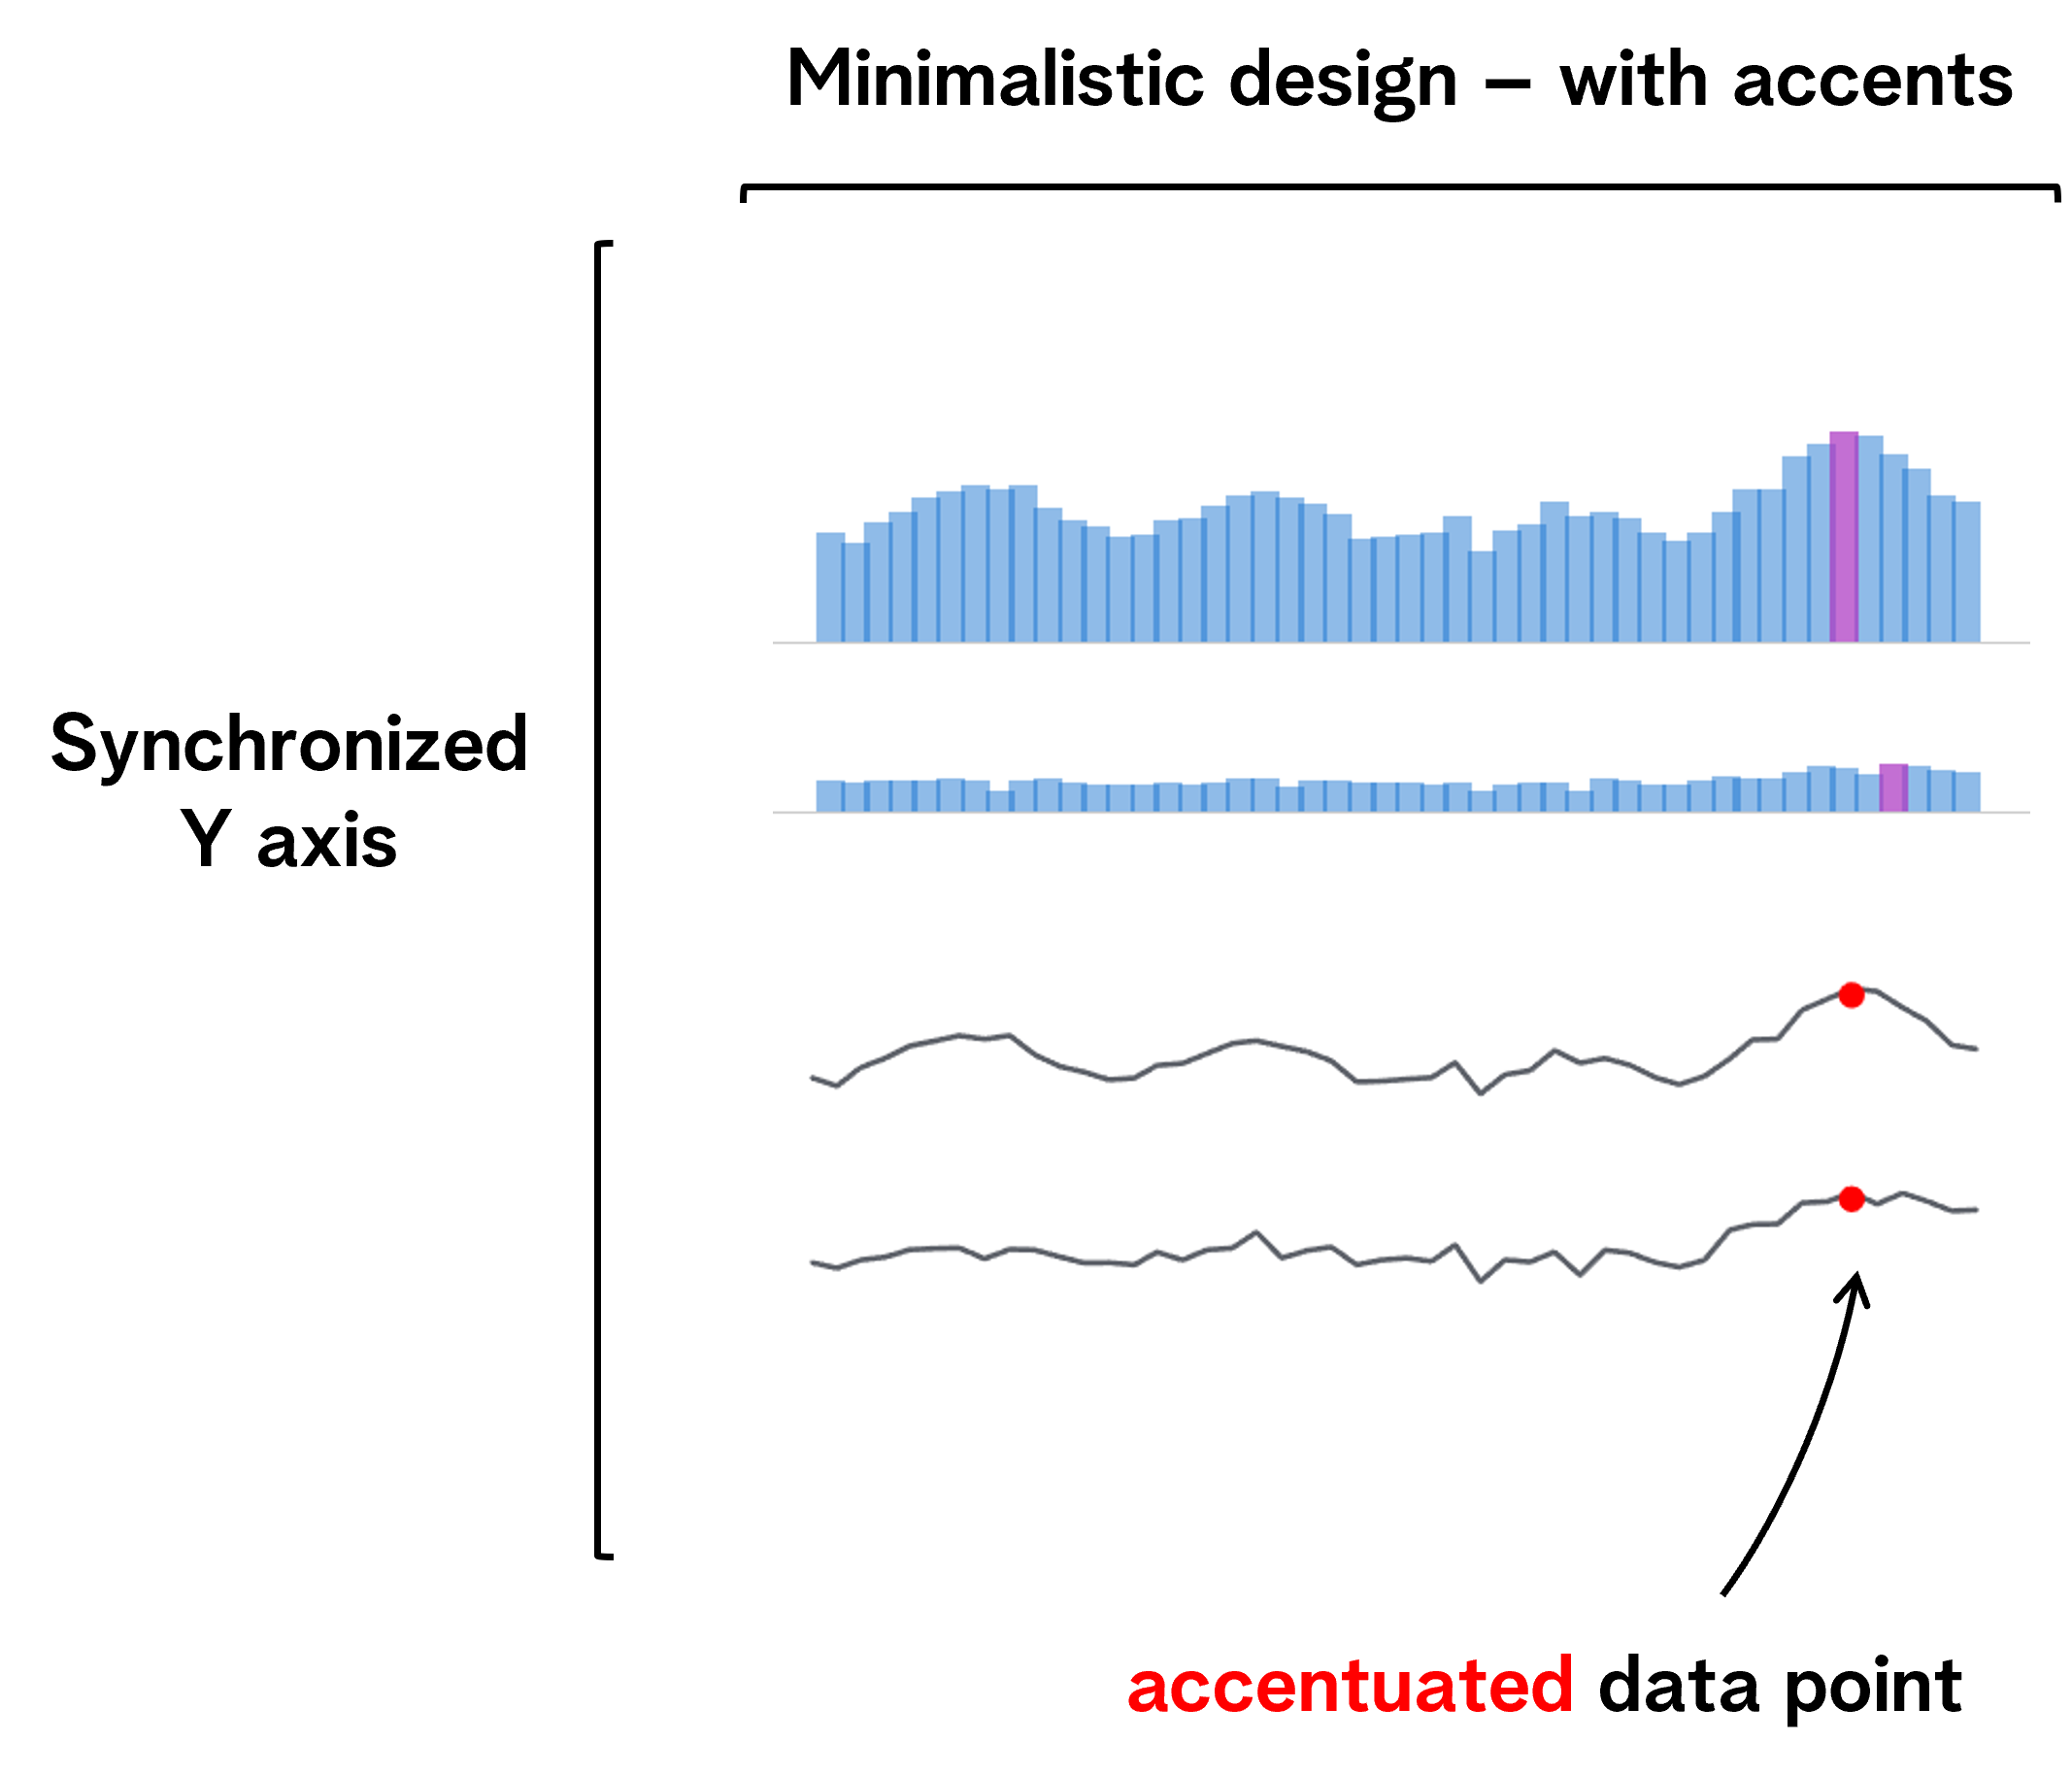
Sparklines
- Tiny, accompanying charts explaining high-level trend
- Typically, line or bar charts with time-series
- Minimalistic design, focus on key data points e.g., minimum or maximum
- Not ideal for precision and exact values
- A good idea for a tooltip chart
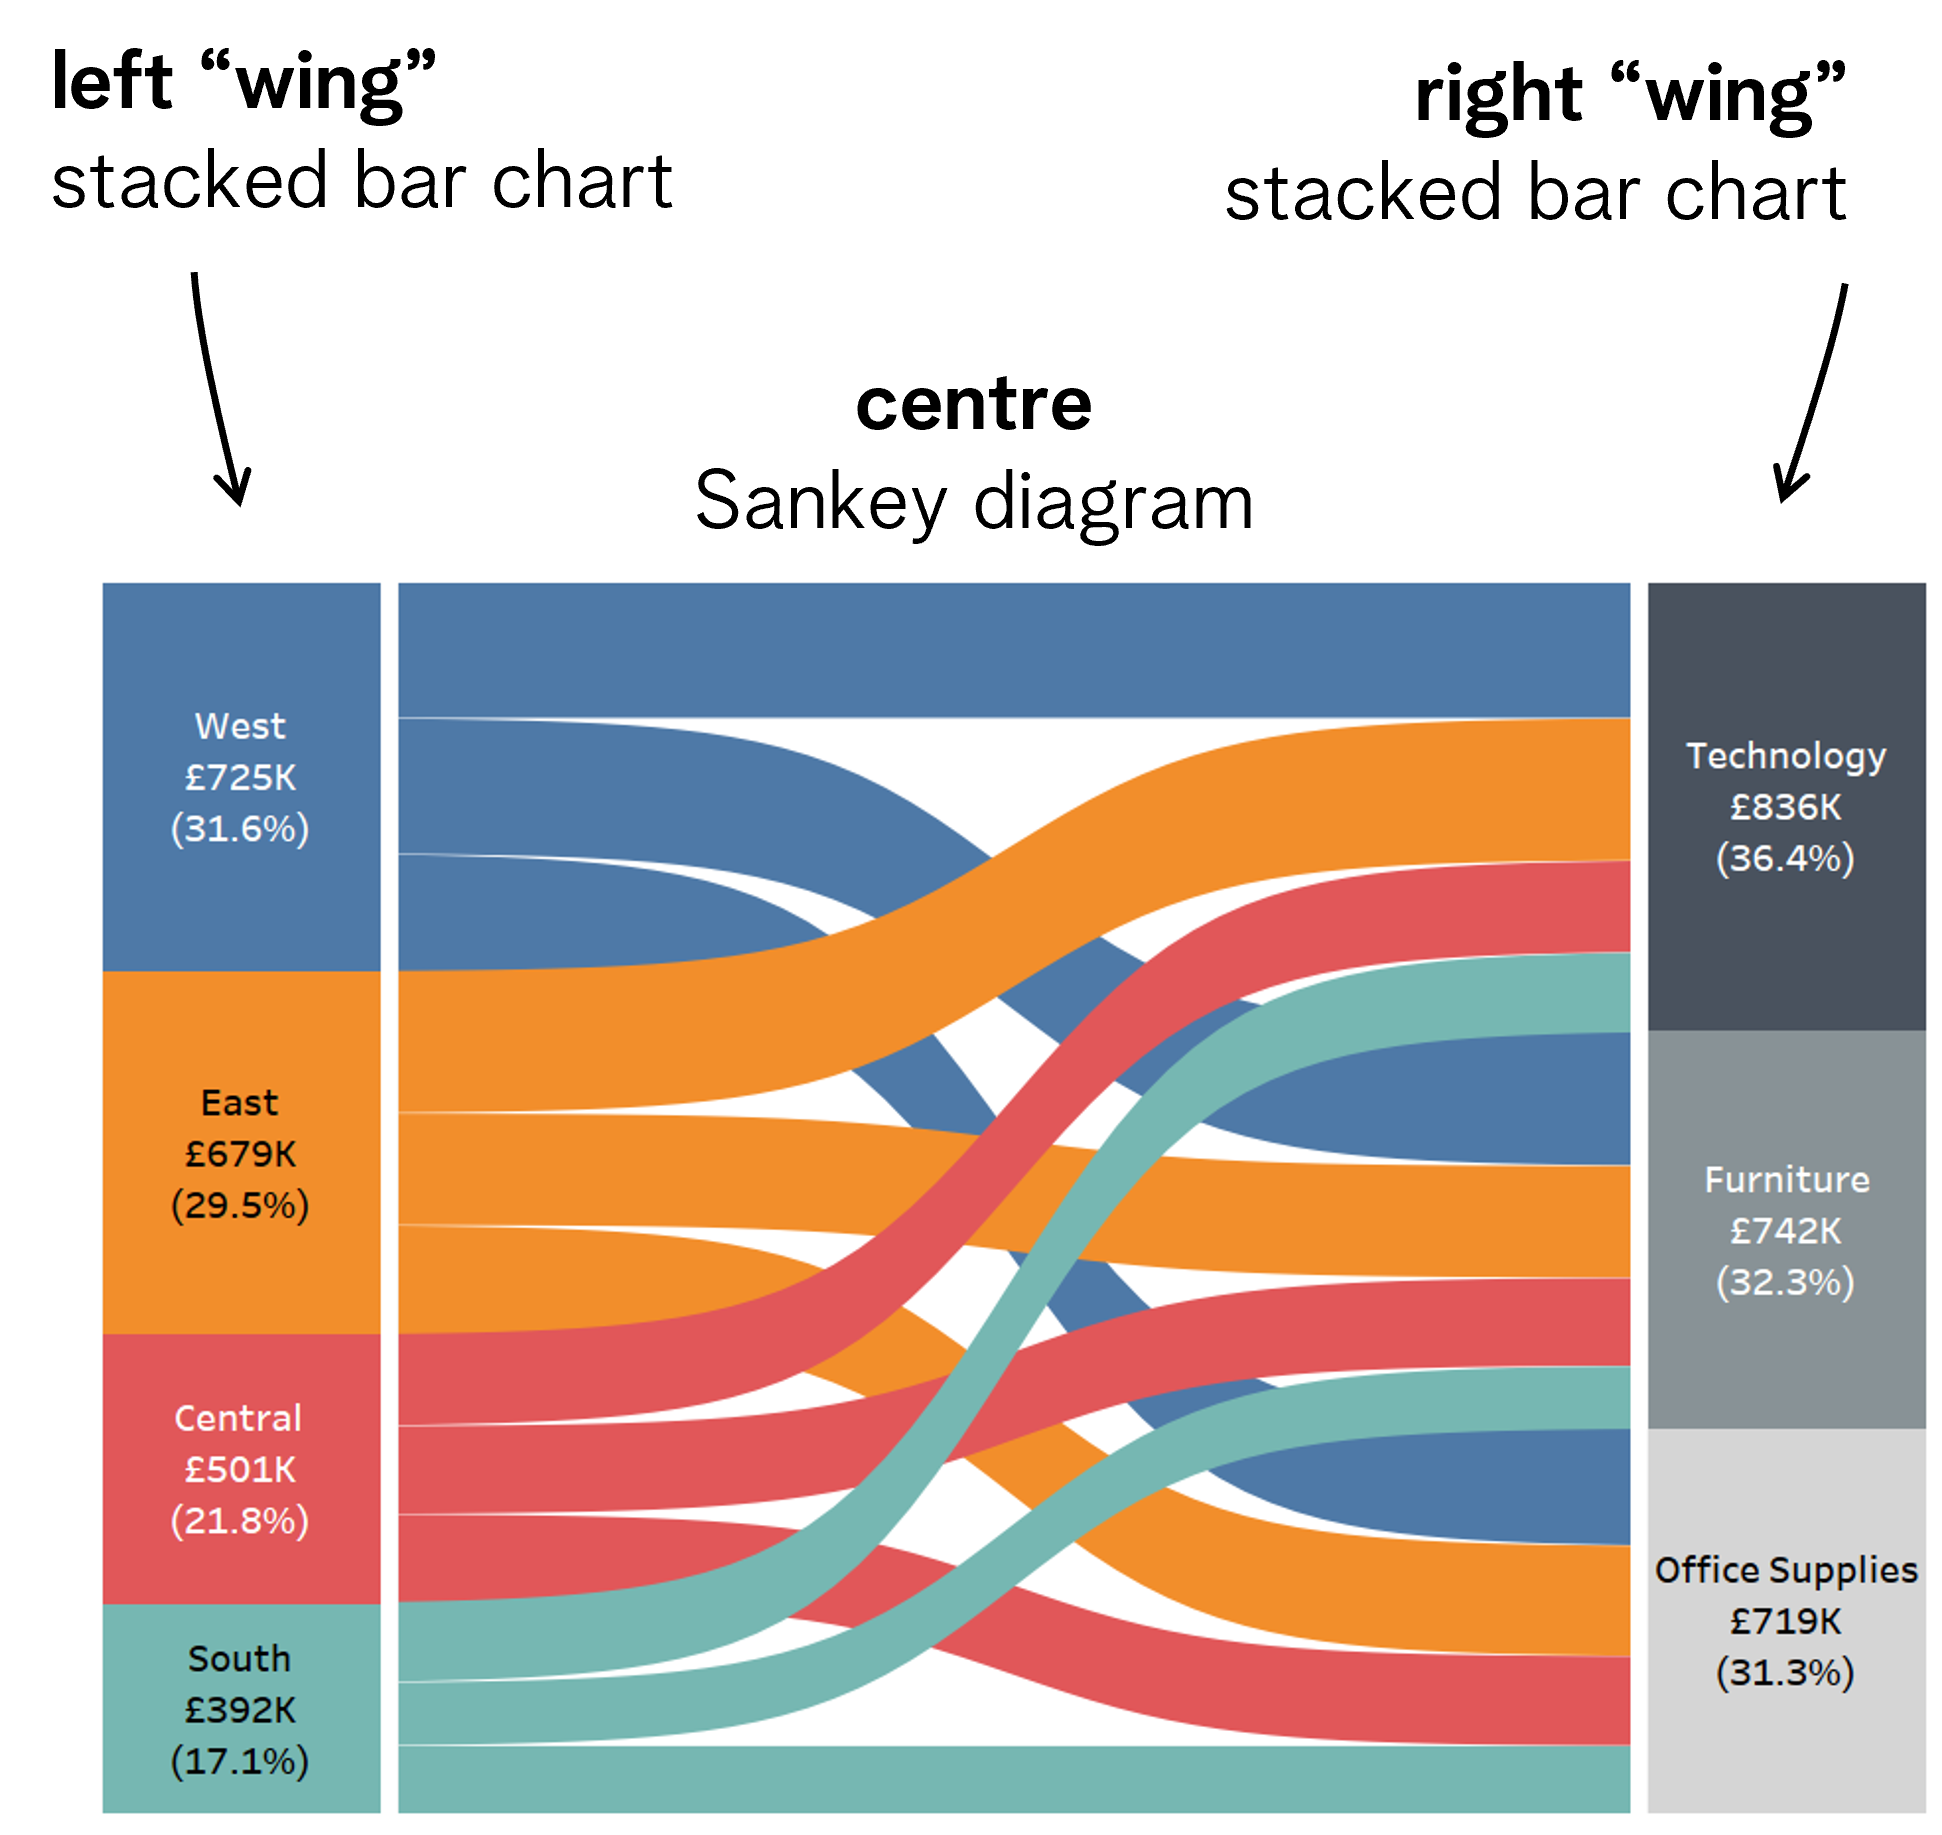
Sankey Diagram
Extra tips and tricks on advanced visualizations
Extensive use of Tableau features:
- Measure Names and Measure Values
- Dual axis
- Marks card and chart types
Combining charts:
- Overlaying of various charts
- Assembling charts into a themed dashboard
Chart "cook-books"
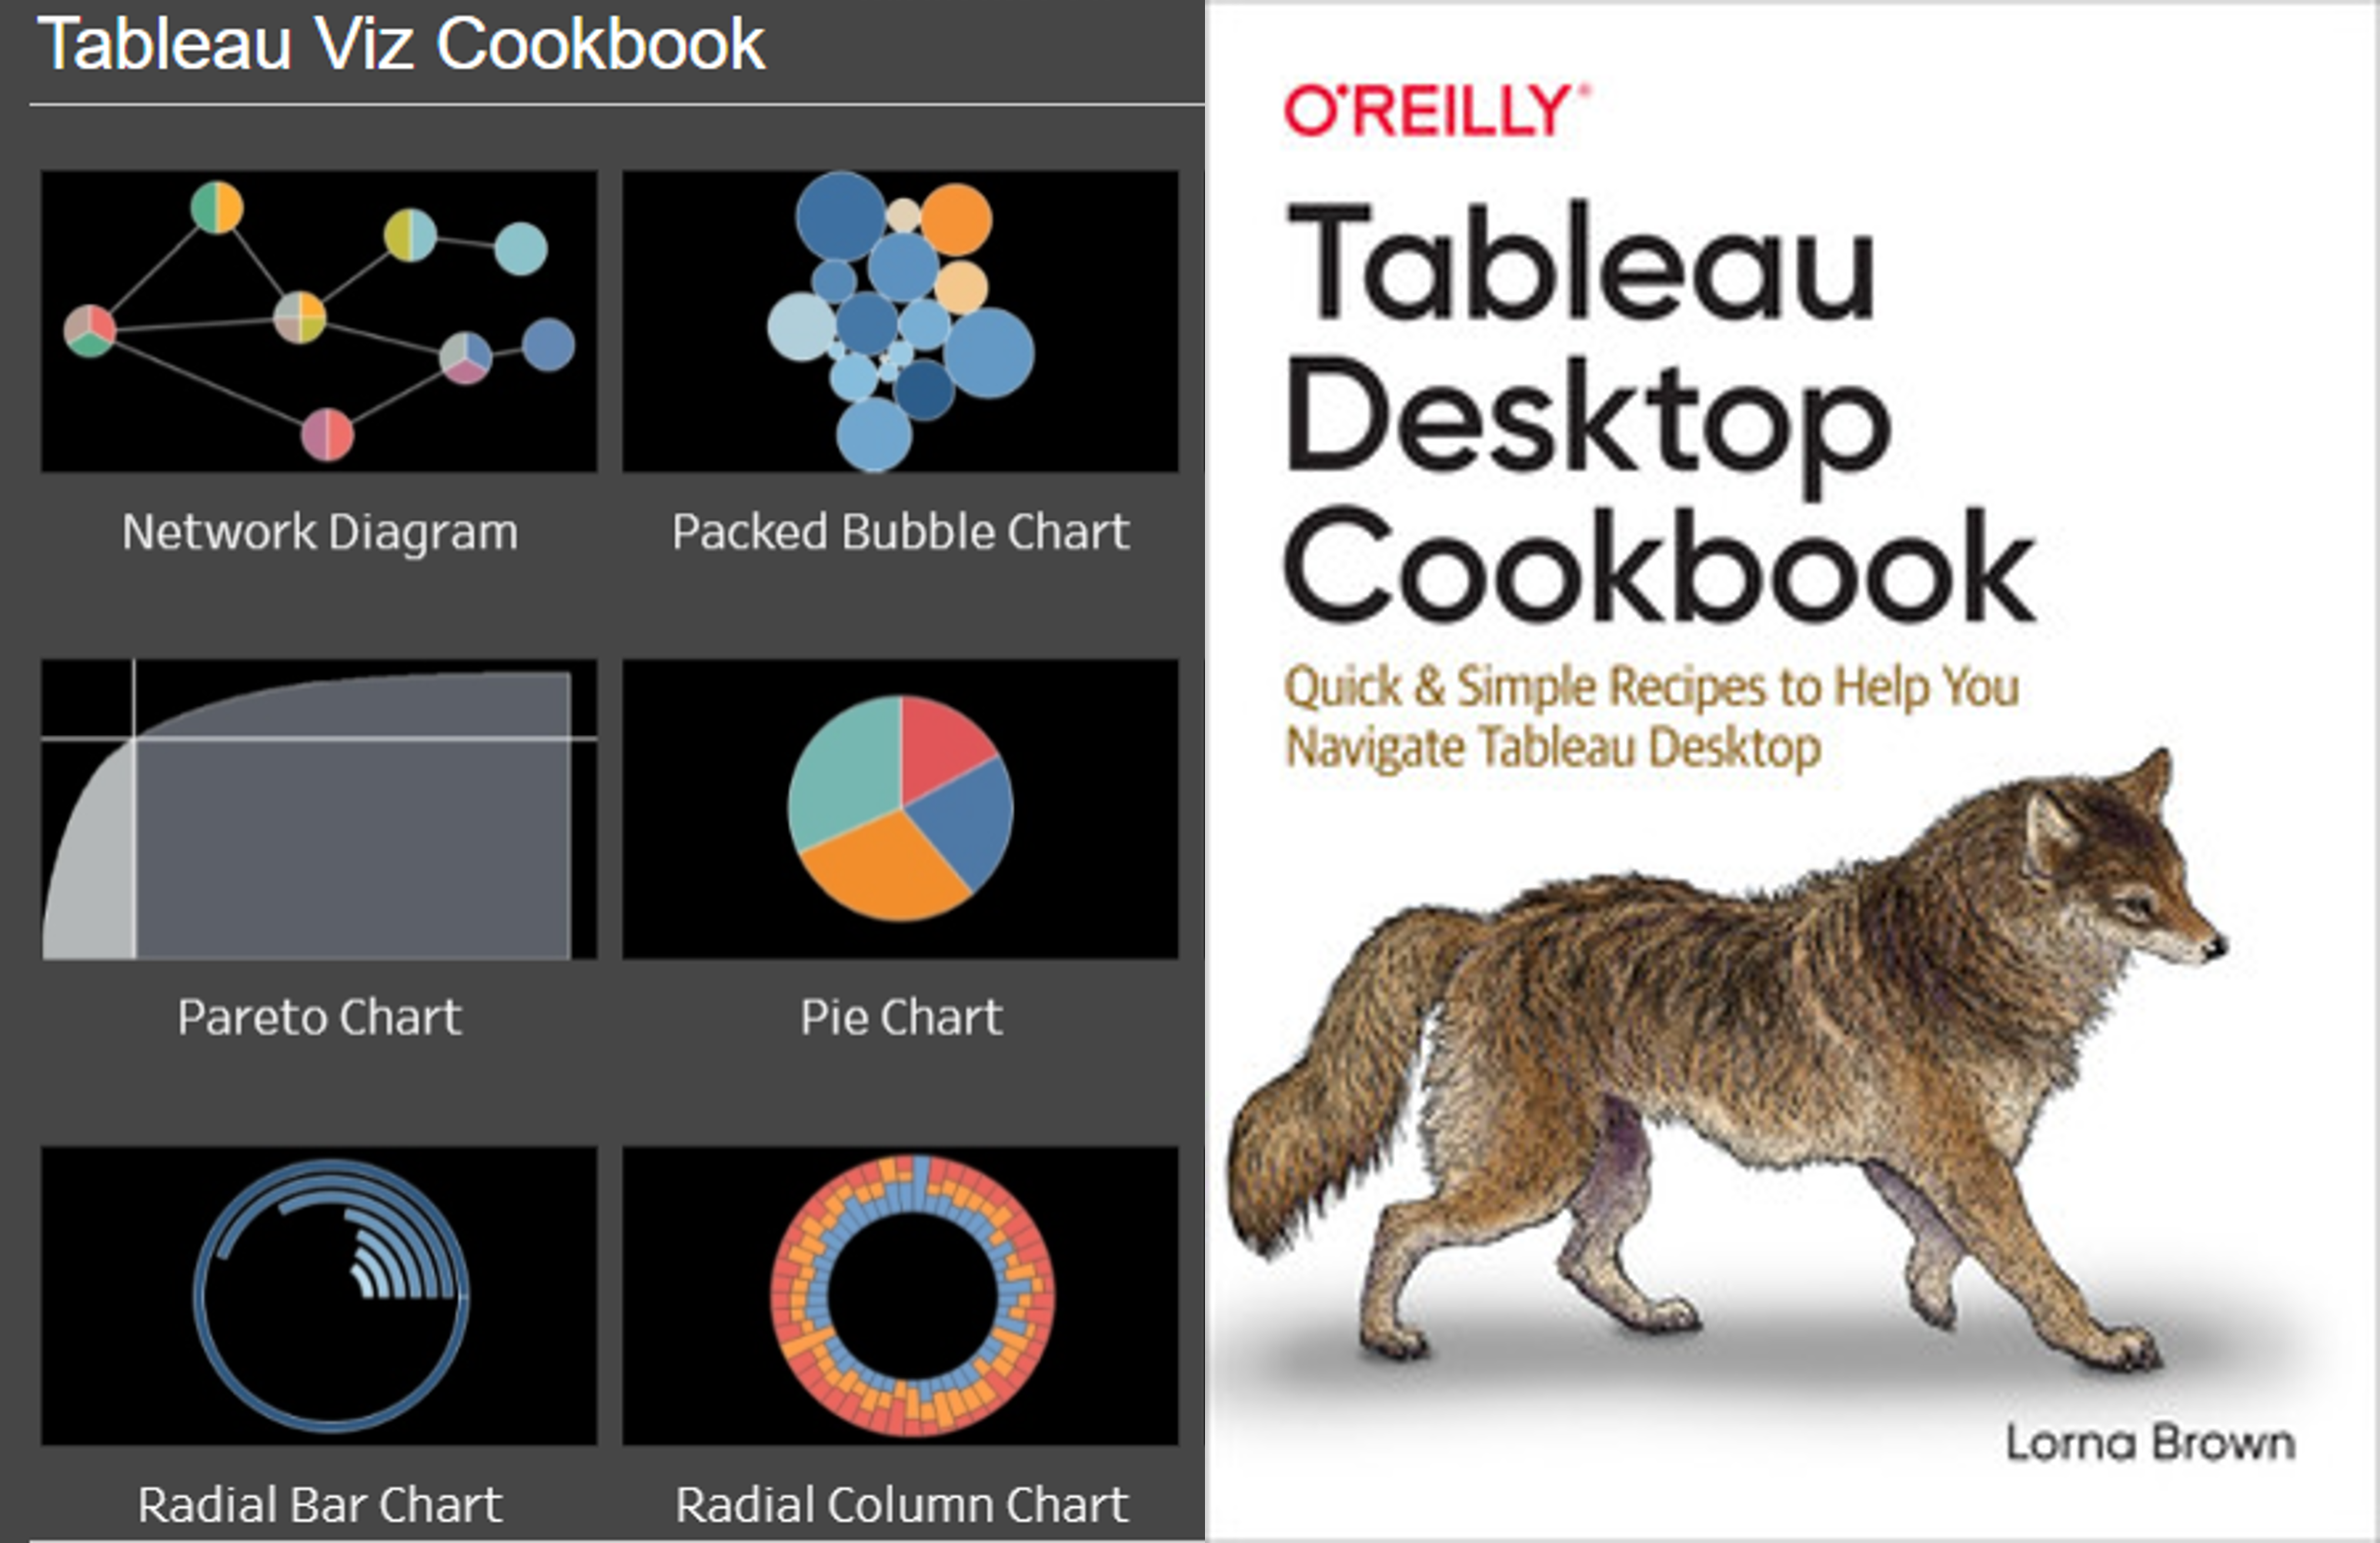
1 https://public.tableau.com/views/CookBook/VizCookbook

