Doing more with maps - custom backgrounds
Data Visualization in Tableau

Agata Bak-Geerinck
Senior Data Analyst, Telenet
Spatial visualization - not only geographical maps

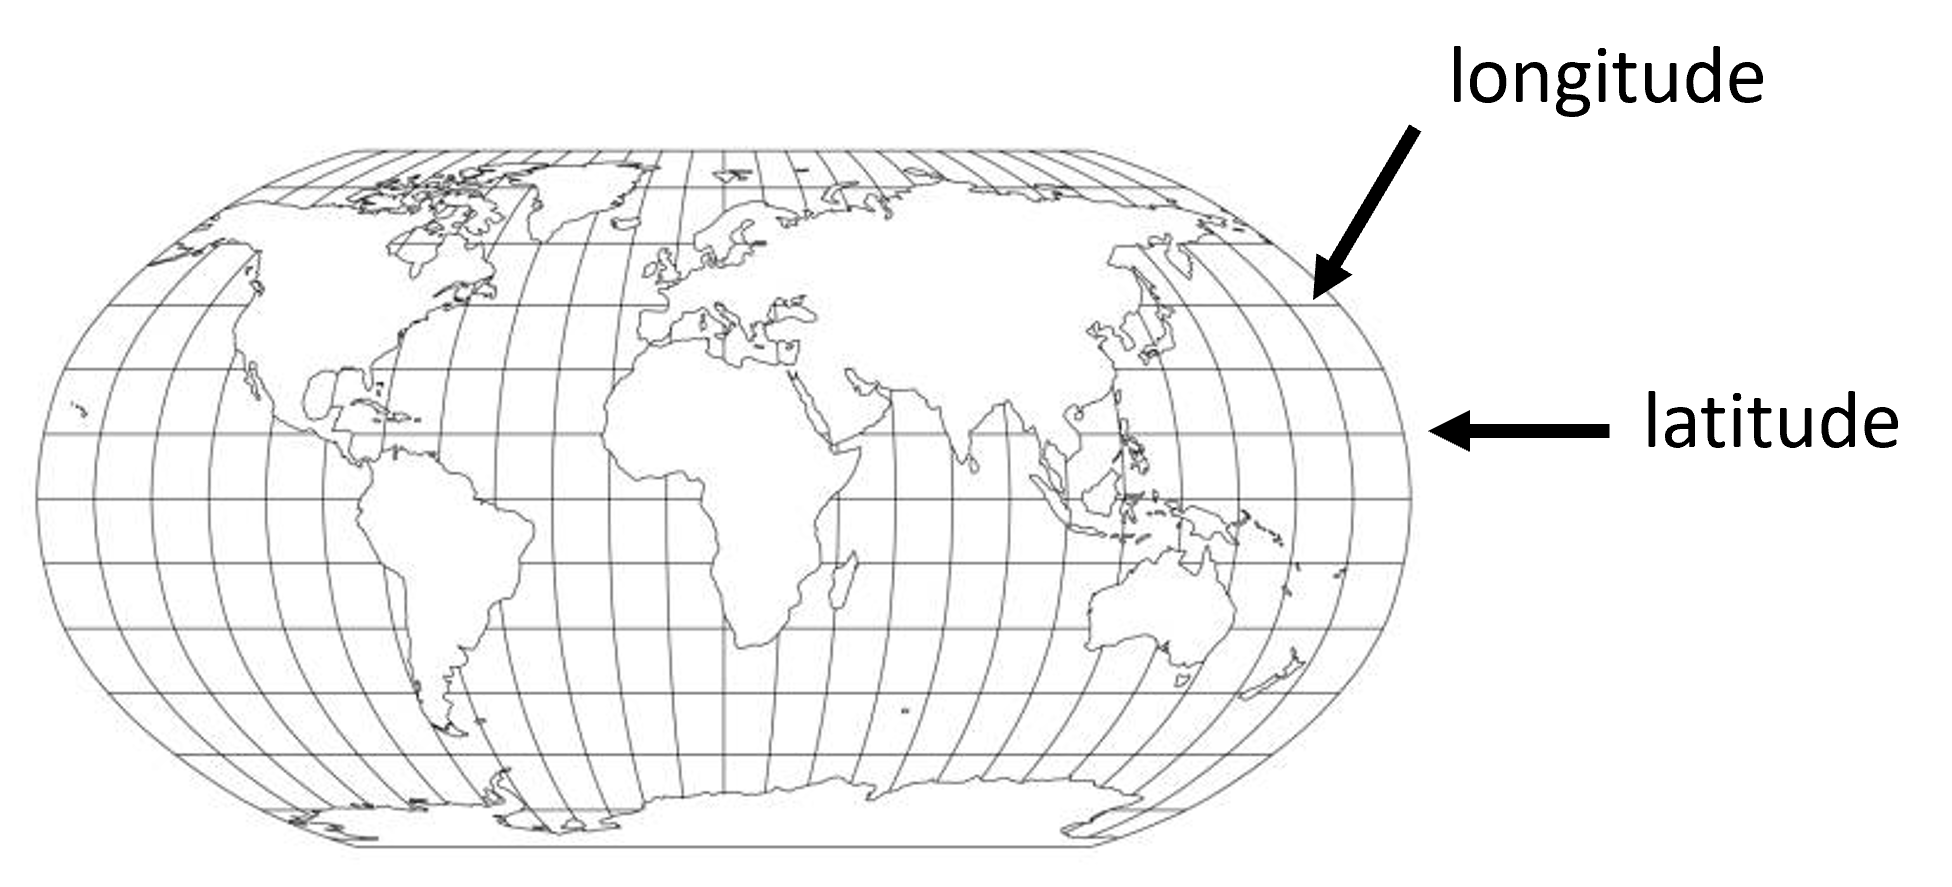
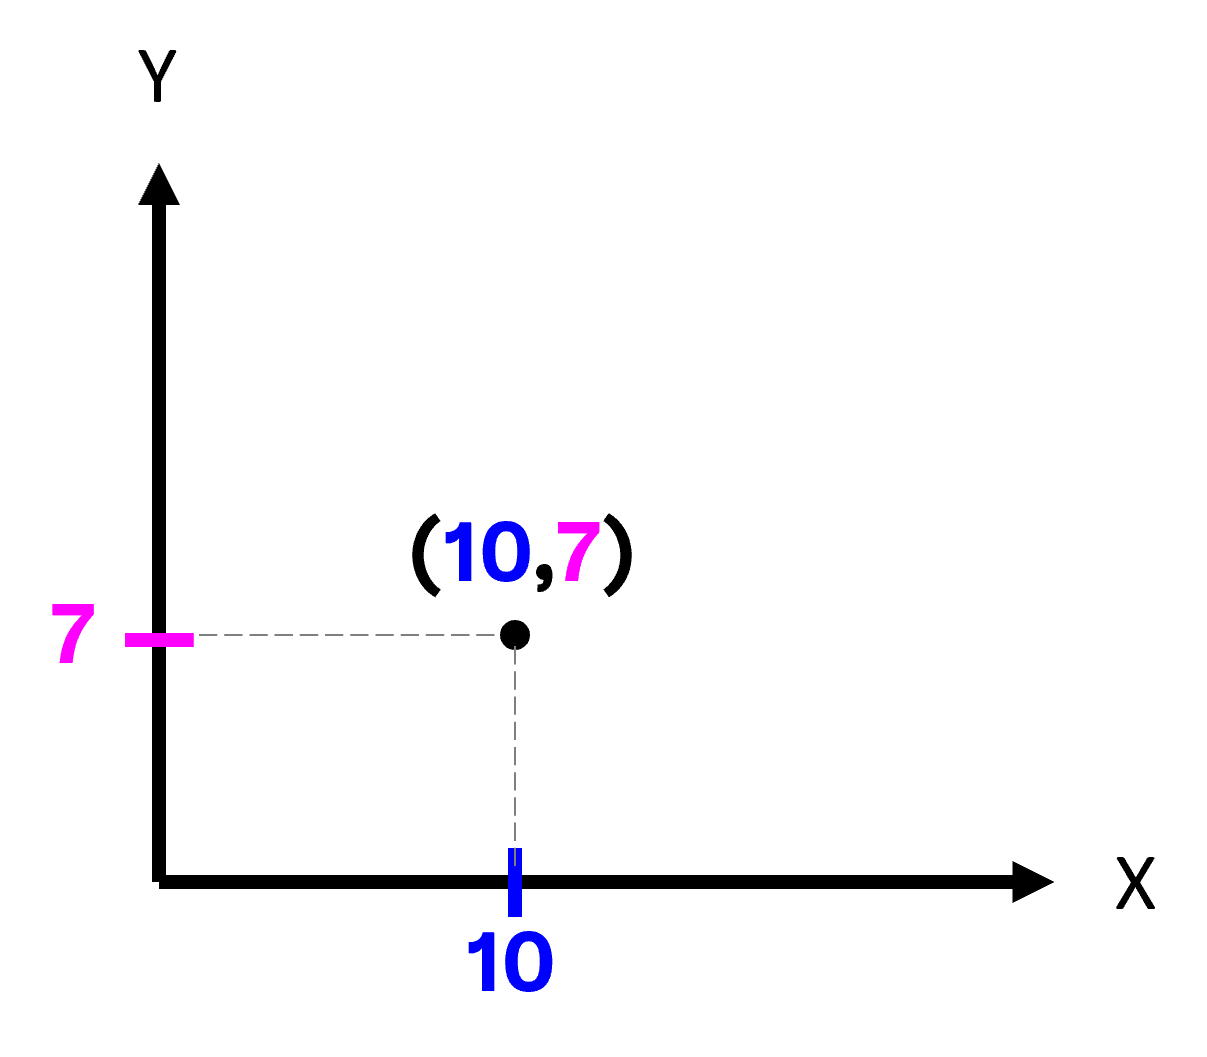
Latitude, longitude, X, Y = coordinates
Coordinates:
- Geographic grid: latitude & longitude:
- Any grid (2D):
X,Y
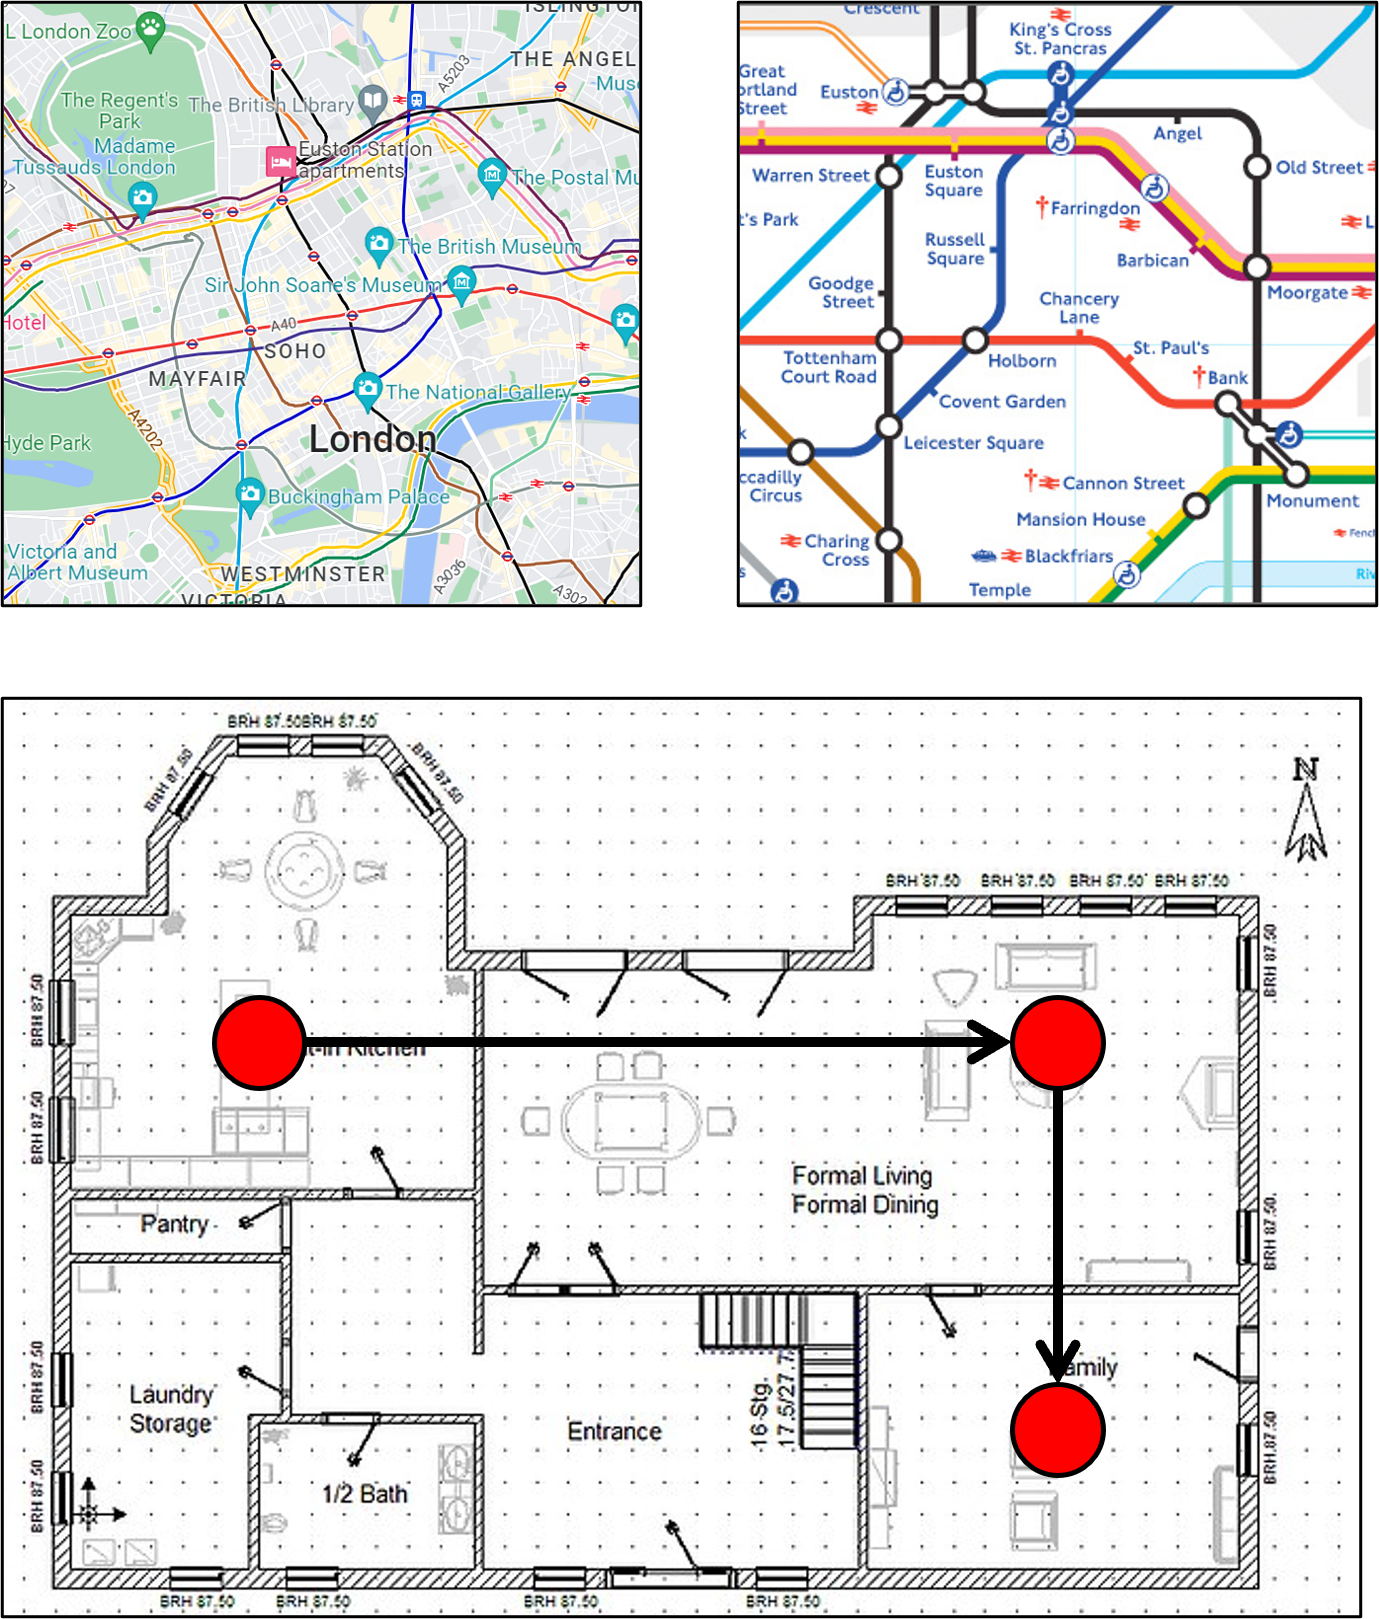
Point and polygons custom maps
Polygon maps:
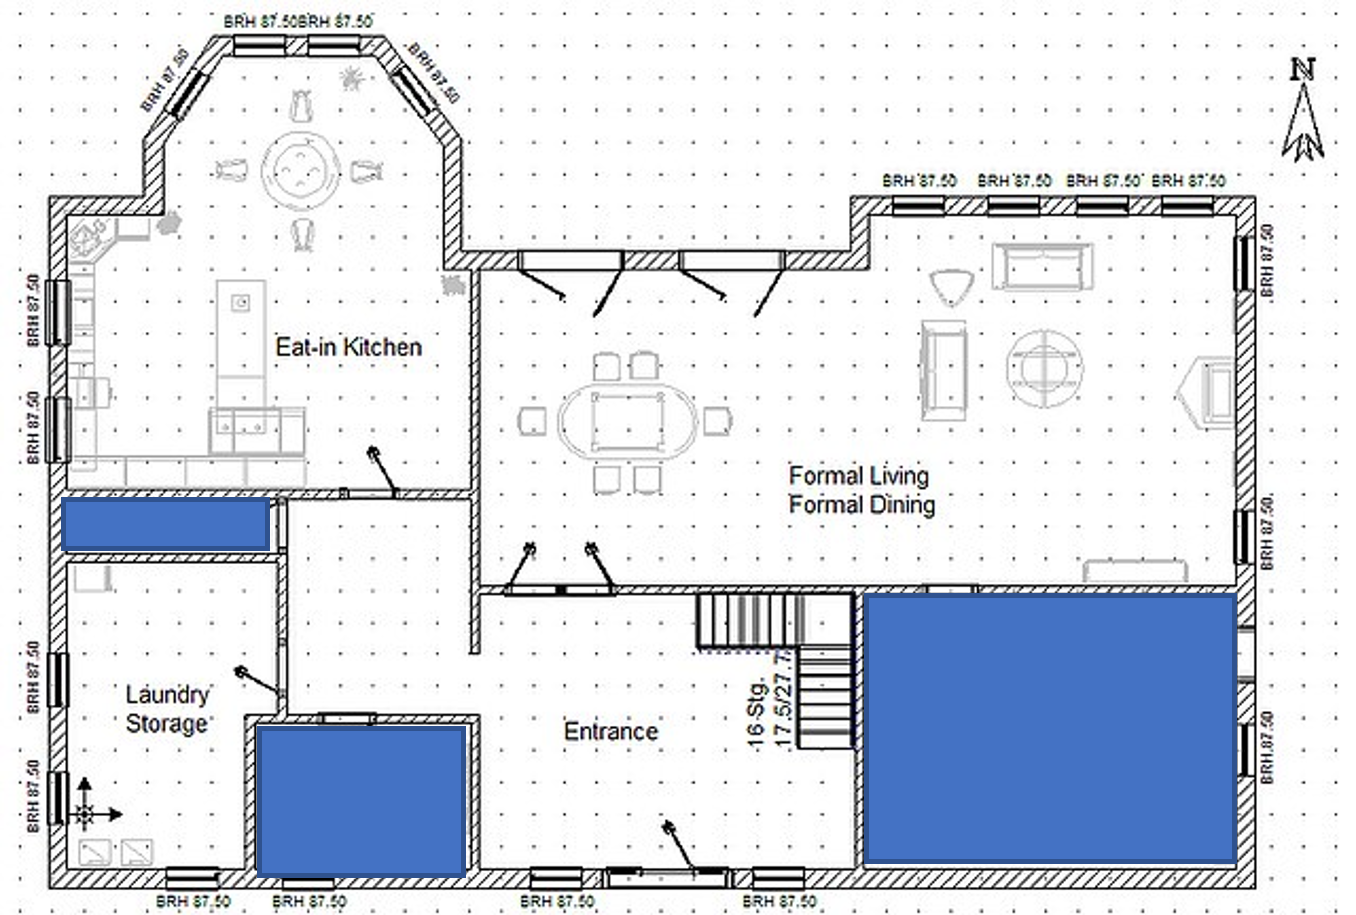
- Representation of an area
- More data needed
Point maps:
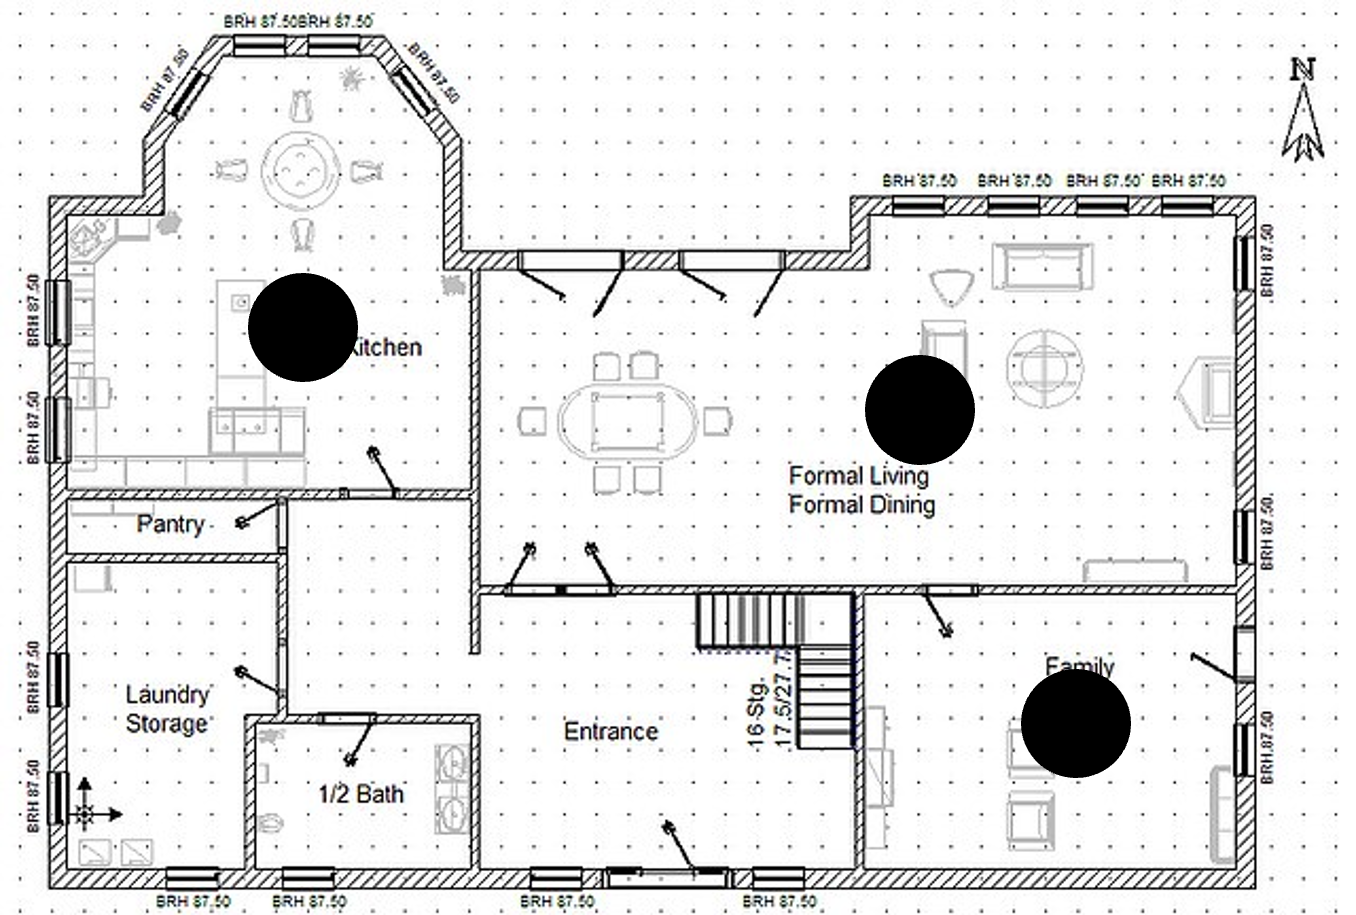
- A specific place or a symbol of an area
- Less data needed
Point and polygons custom maps
Polygon maps:
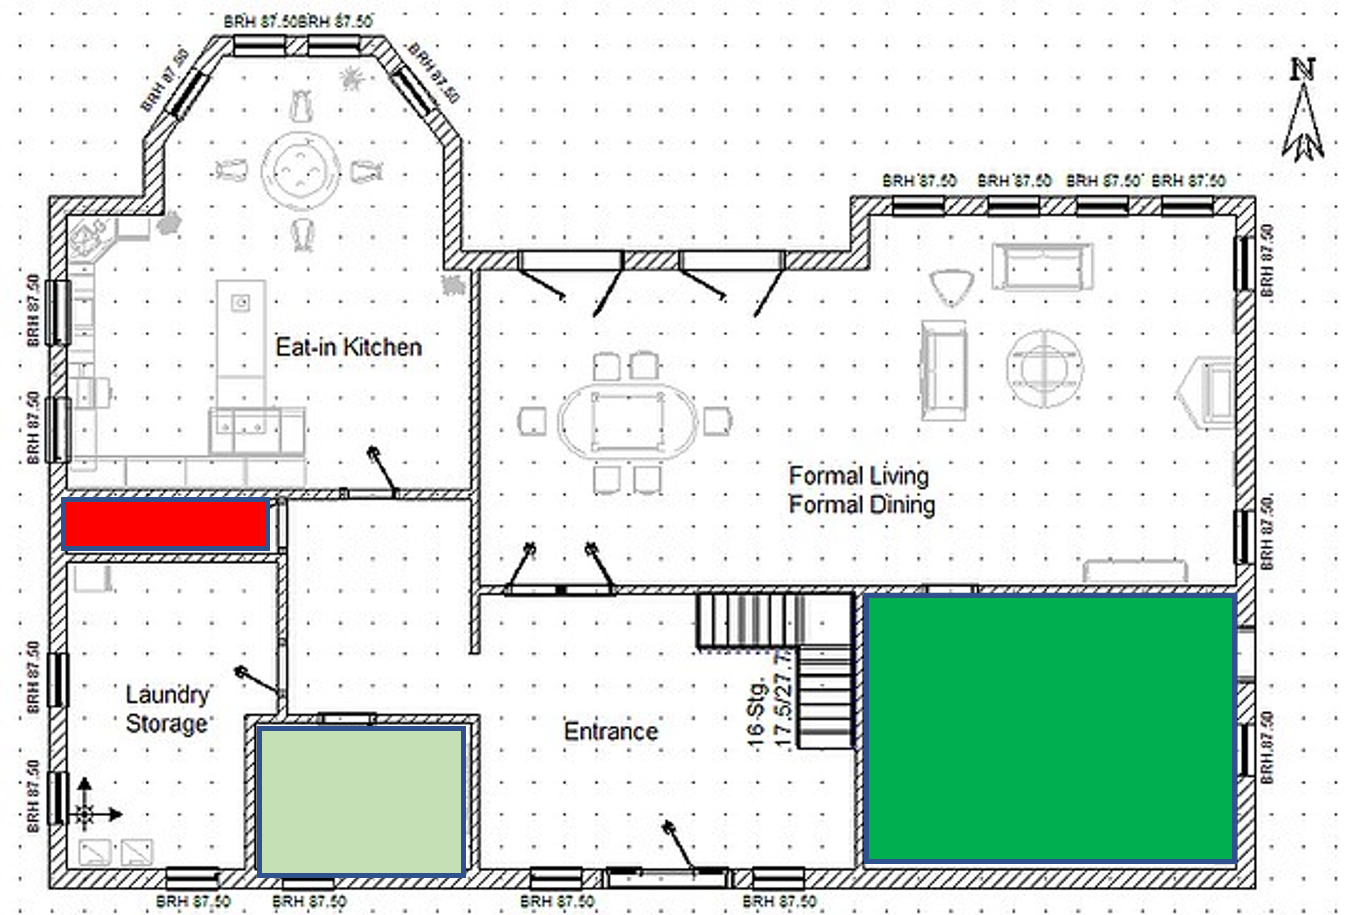
- E.g., occupied (hours per day)
Point maps:
- E.g., luminous intensity and frequency of usage (hours ON per day)
Steps in visualizing custom map data
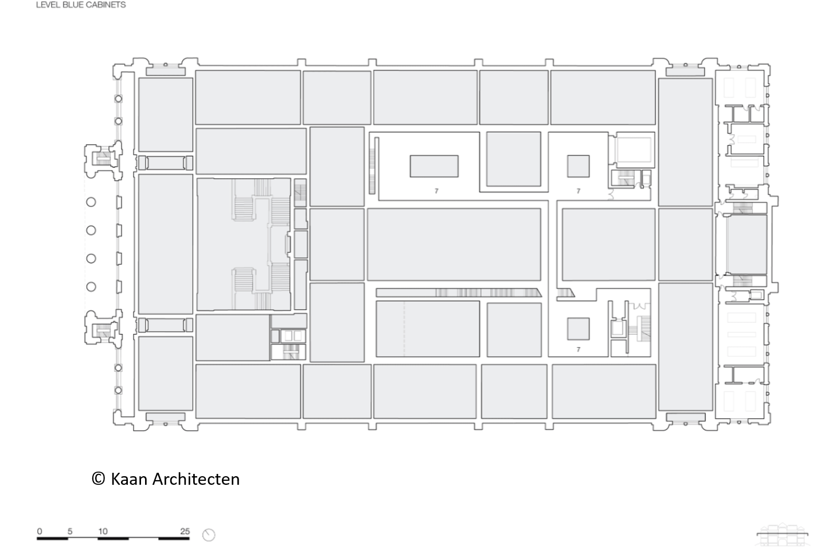
Step 1: Load the desired background image.
Step 2: Identify points/areas of interest and note down the coordinates in X-Y format, and create a location dataset
Step 3: Combine the coordinate data with extra data with dimensions and facts.
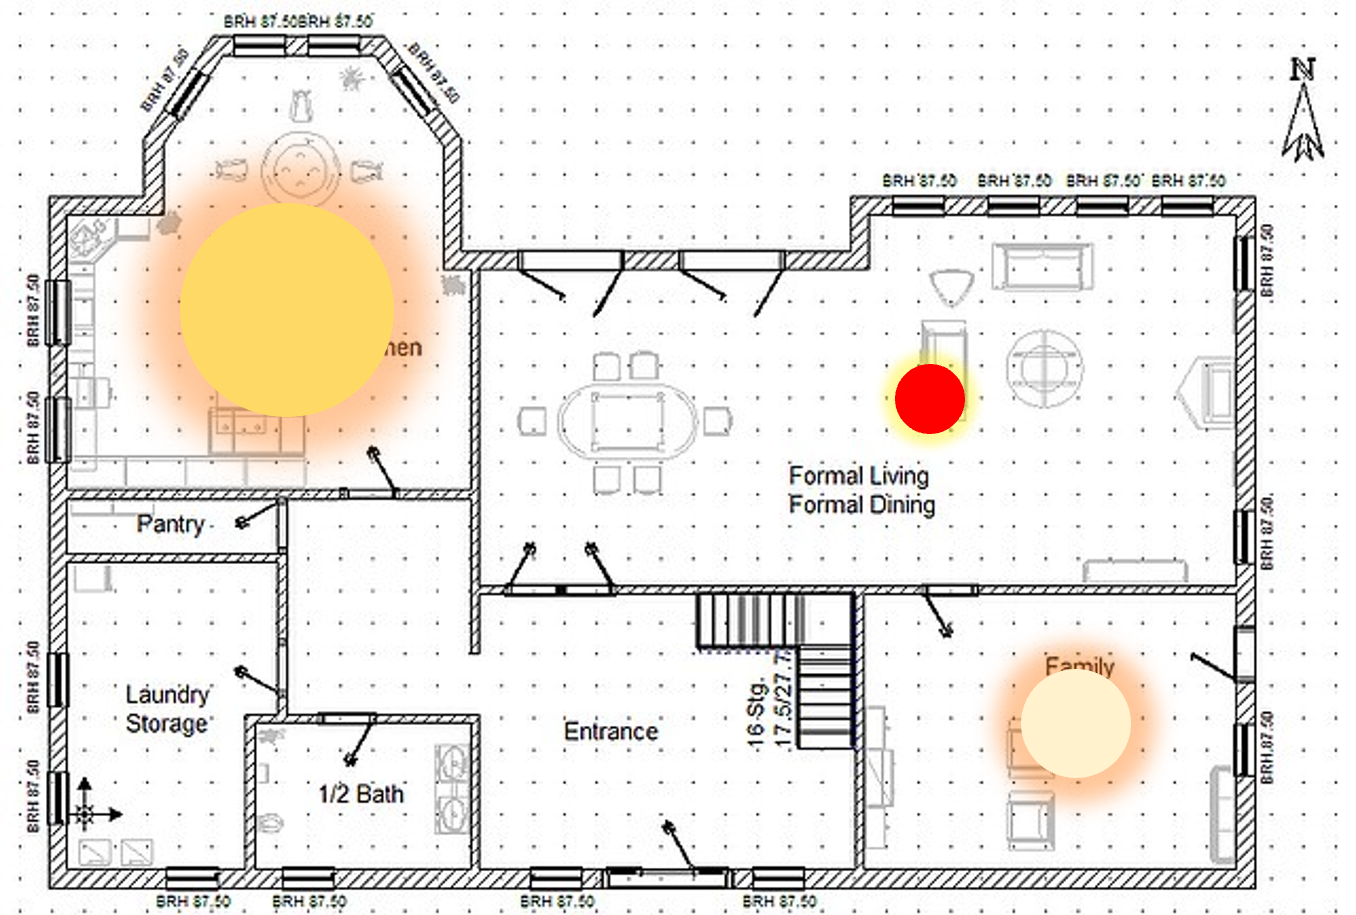
Step 4: Visualize the combined data, using color, highlights, annotations, animation, etc.
Museum visits visualized
- Setting up custom background map
- Visualizing the traffic in various museum areas
- How traffic evolves during the day
- Visualizing main traffic pathways in the building