Congratulations!
Data Visualization in Tableau

Maarten Van den Broeck
Content Developer, DataCamp
What you've learned
Chapter 1

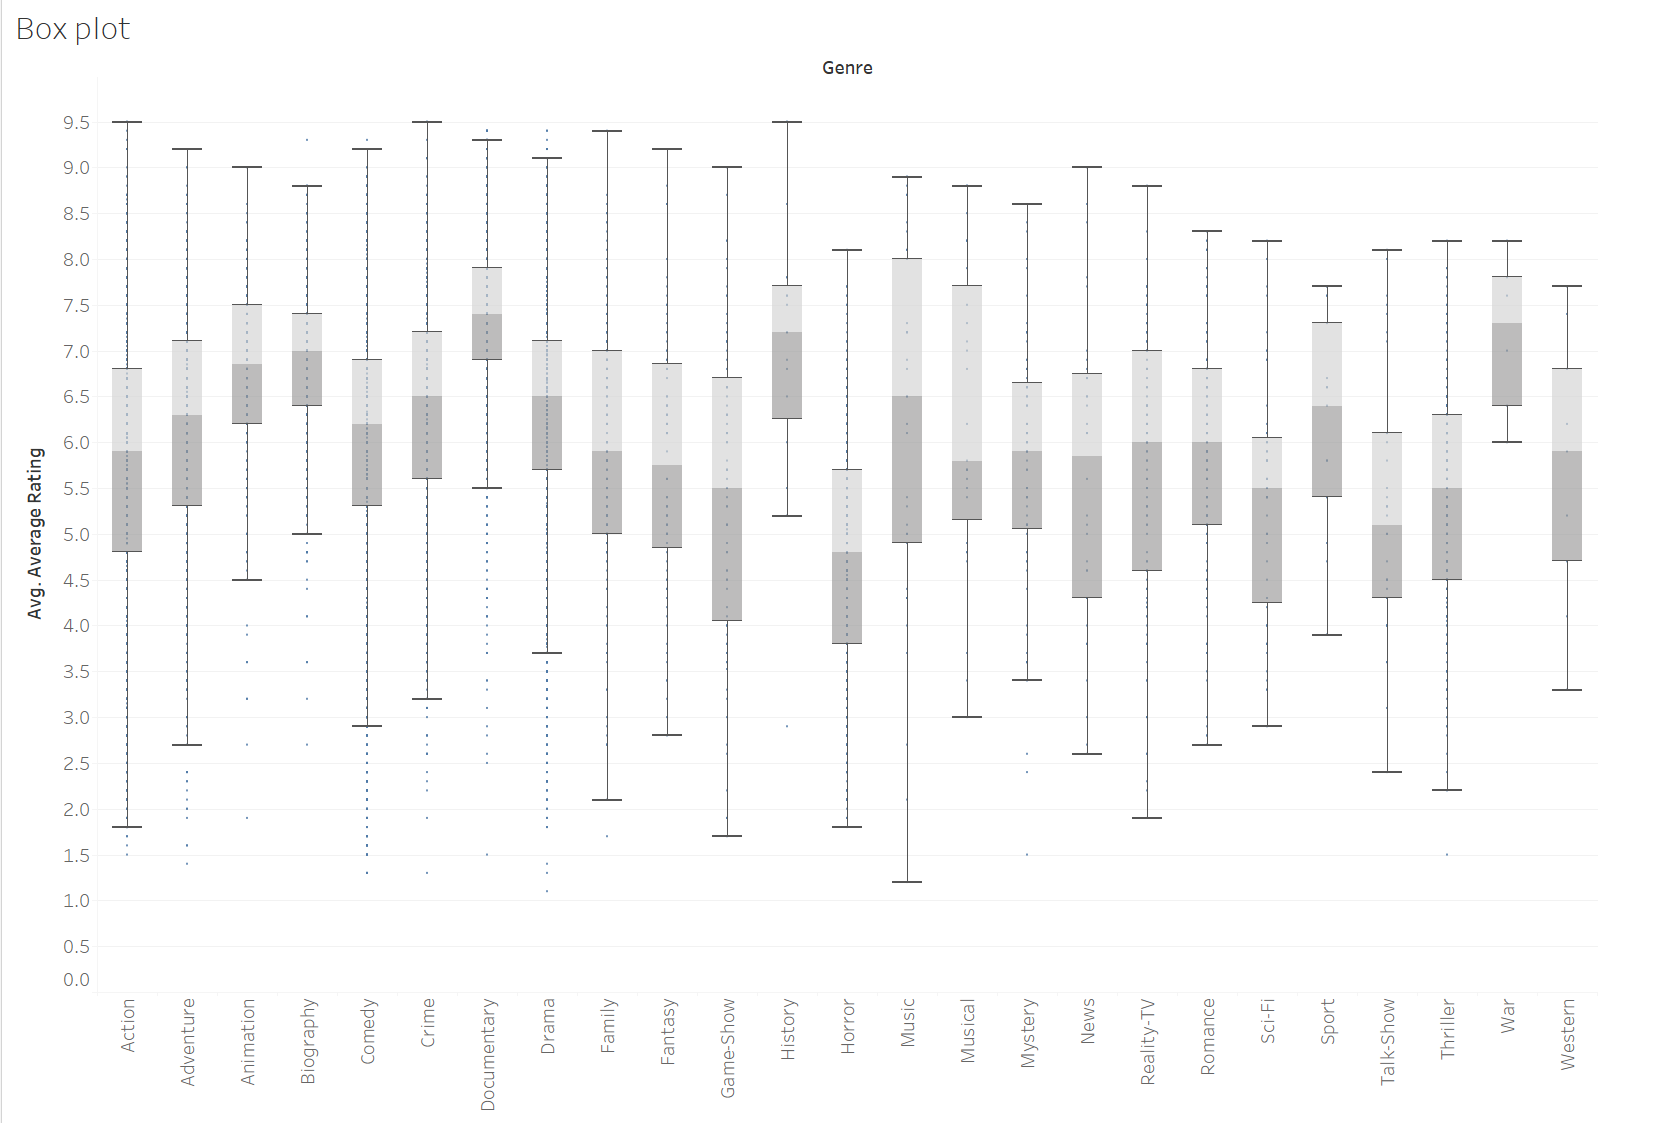
- Show Me charts
- Basic and intermediate visualizations
- Scatter plot, waterfall chart, box plots, etc.
Chapter 2
- Best practices in data visualization
- Animating the charts
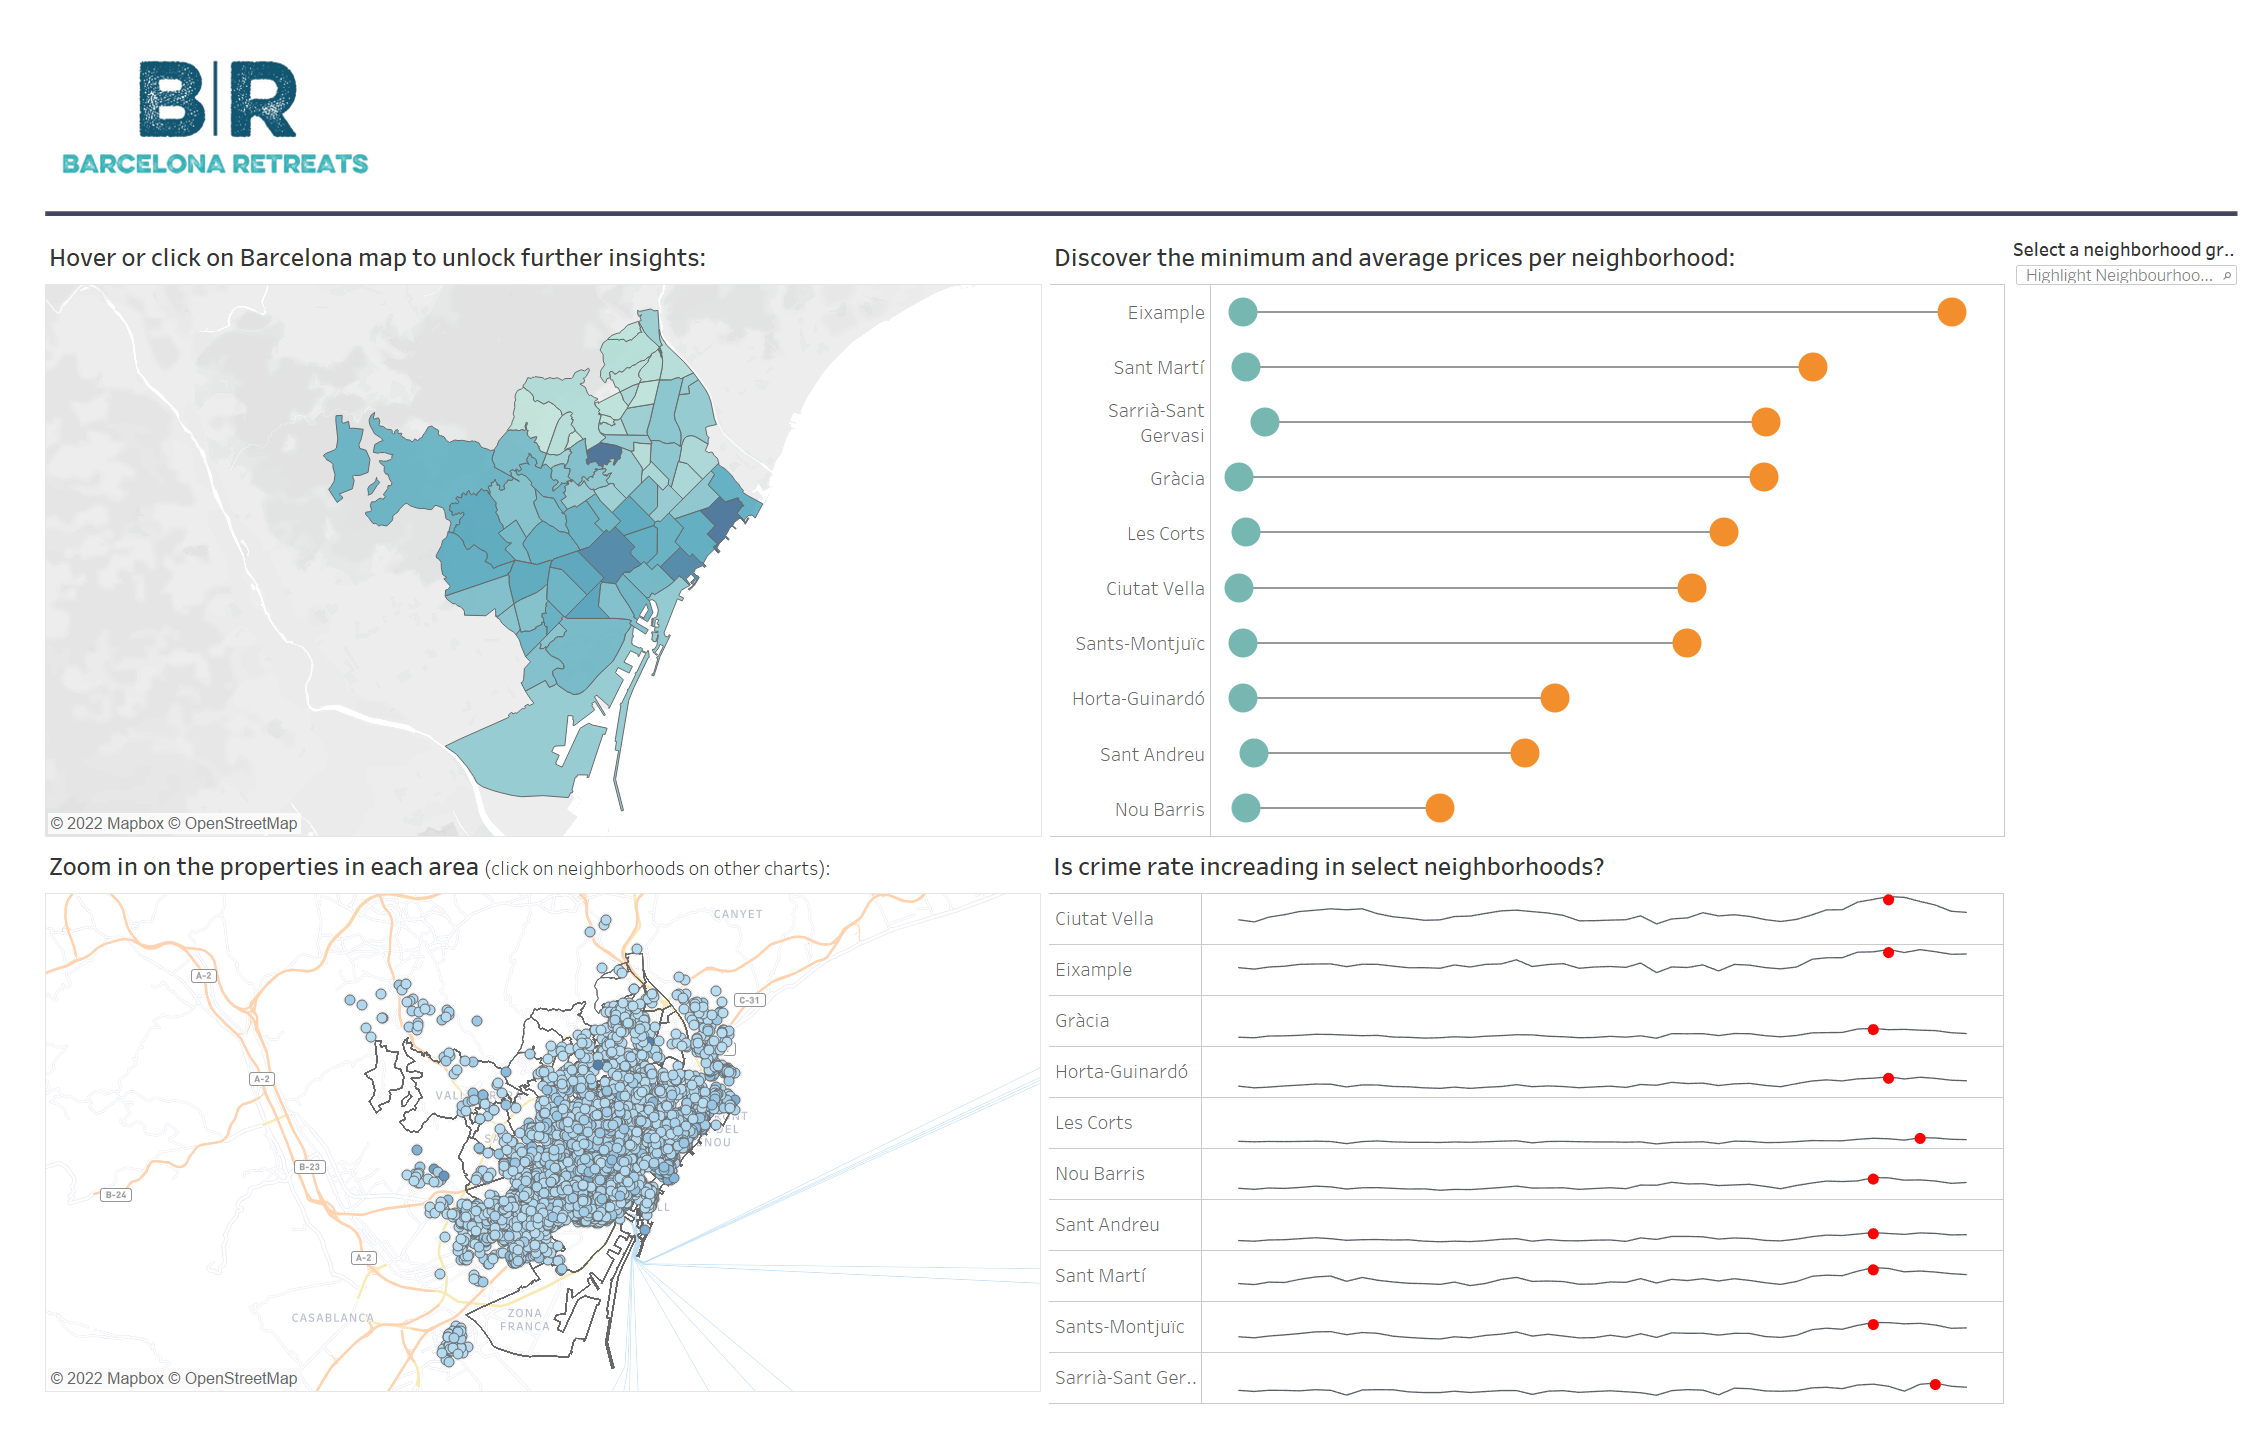
- Adding interactivity elements
What you've learned
Chapter 3
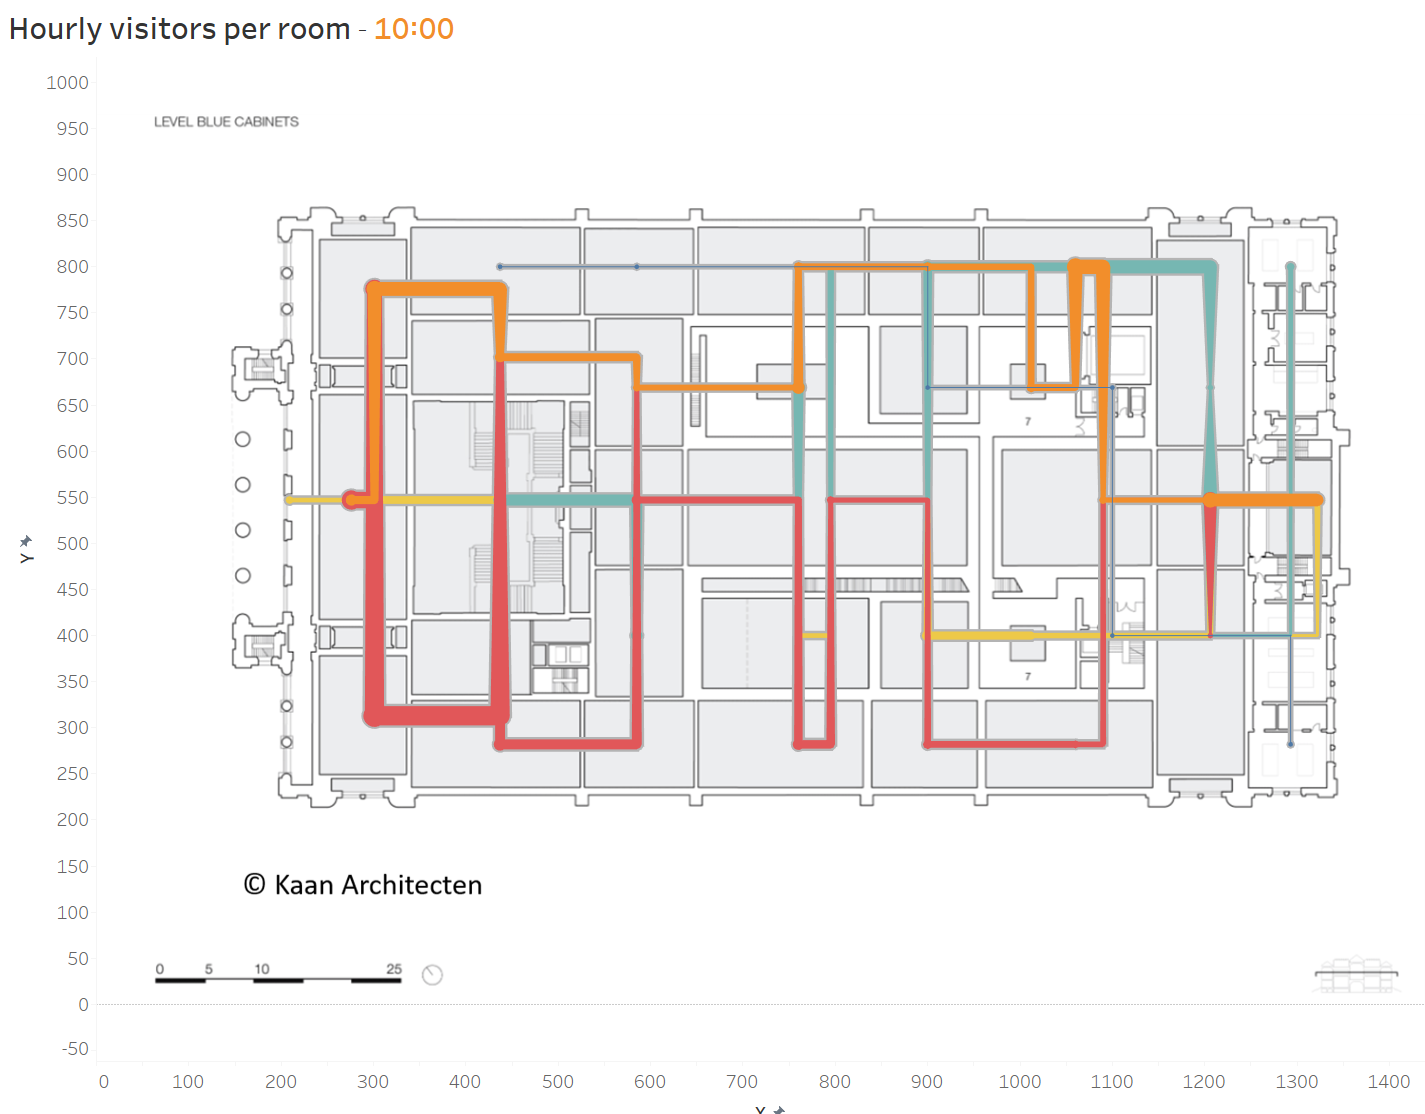
- Digital cartography in Tableau
- Working with geographical maps
- Custom background mapping
Chapter 4
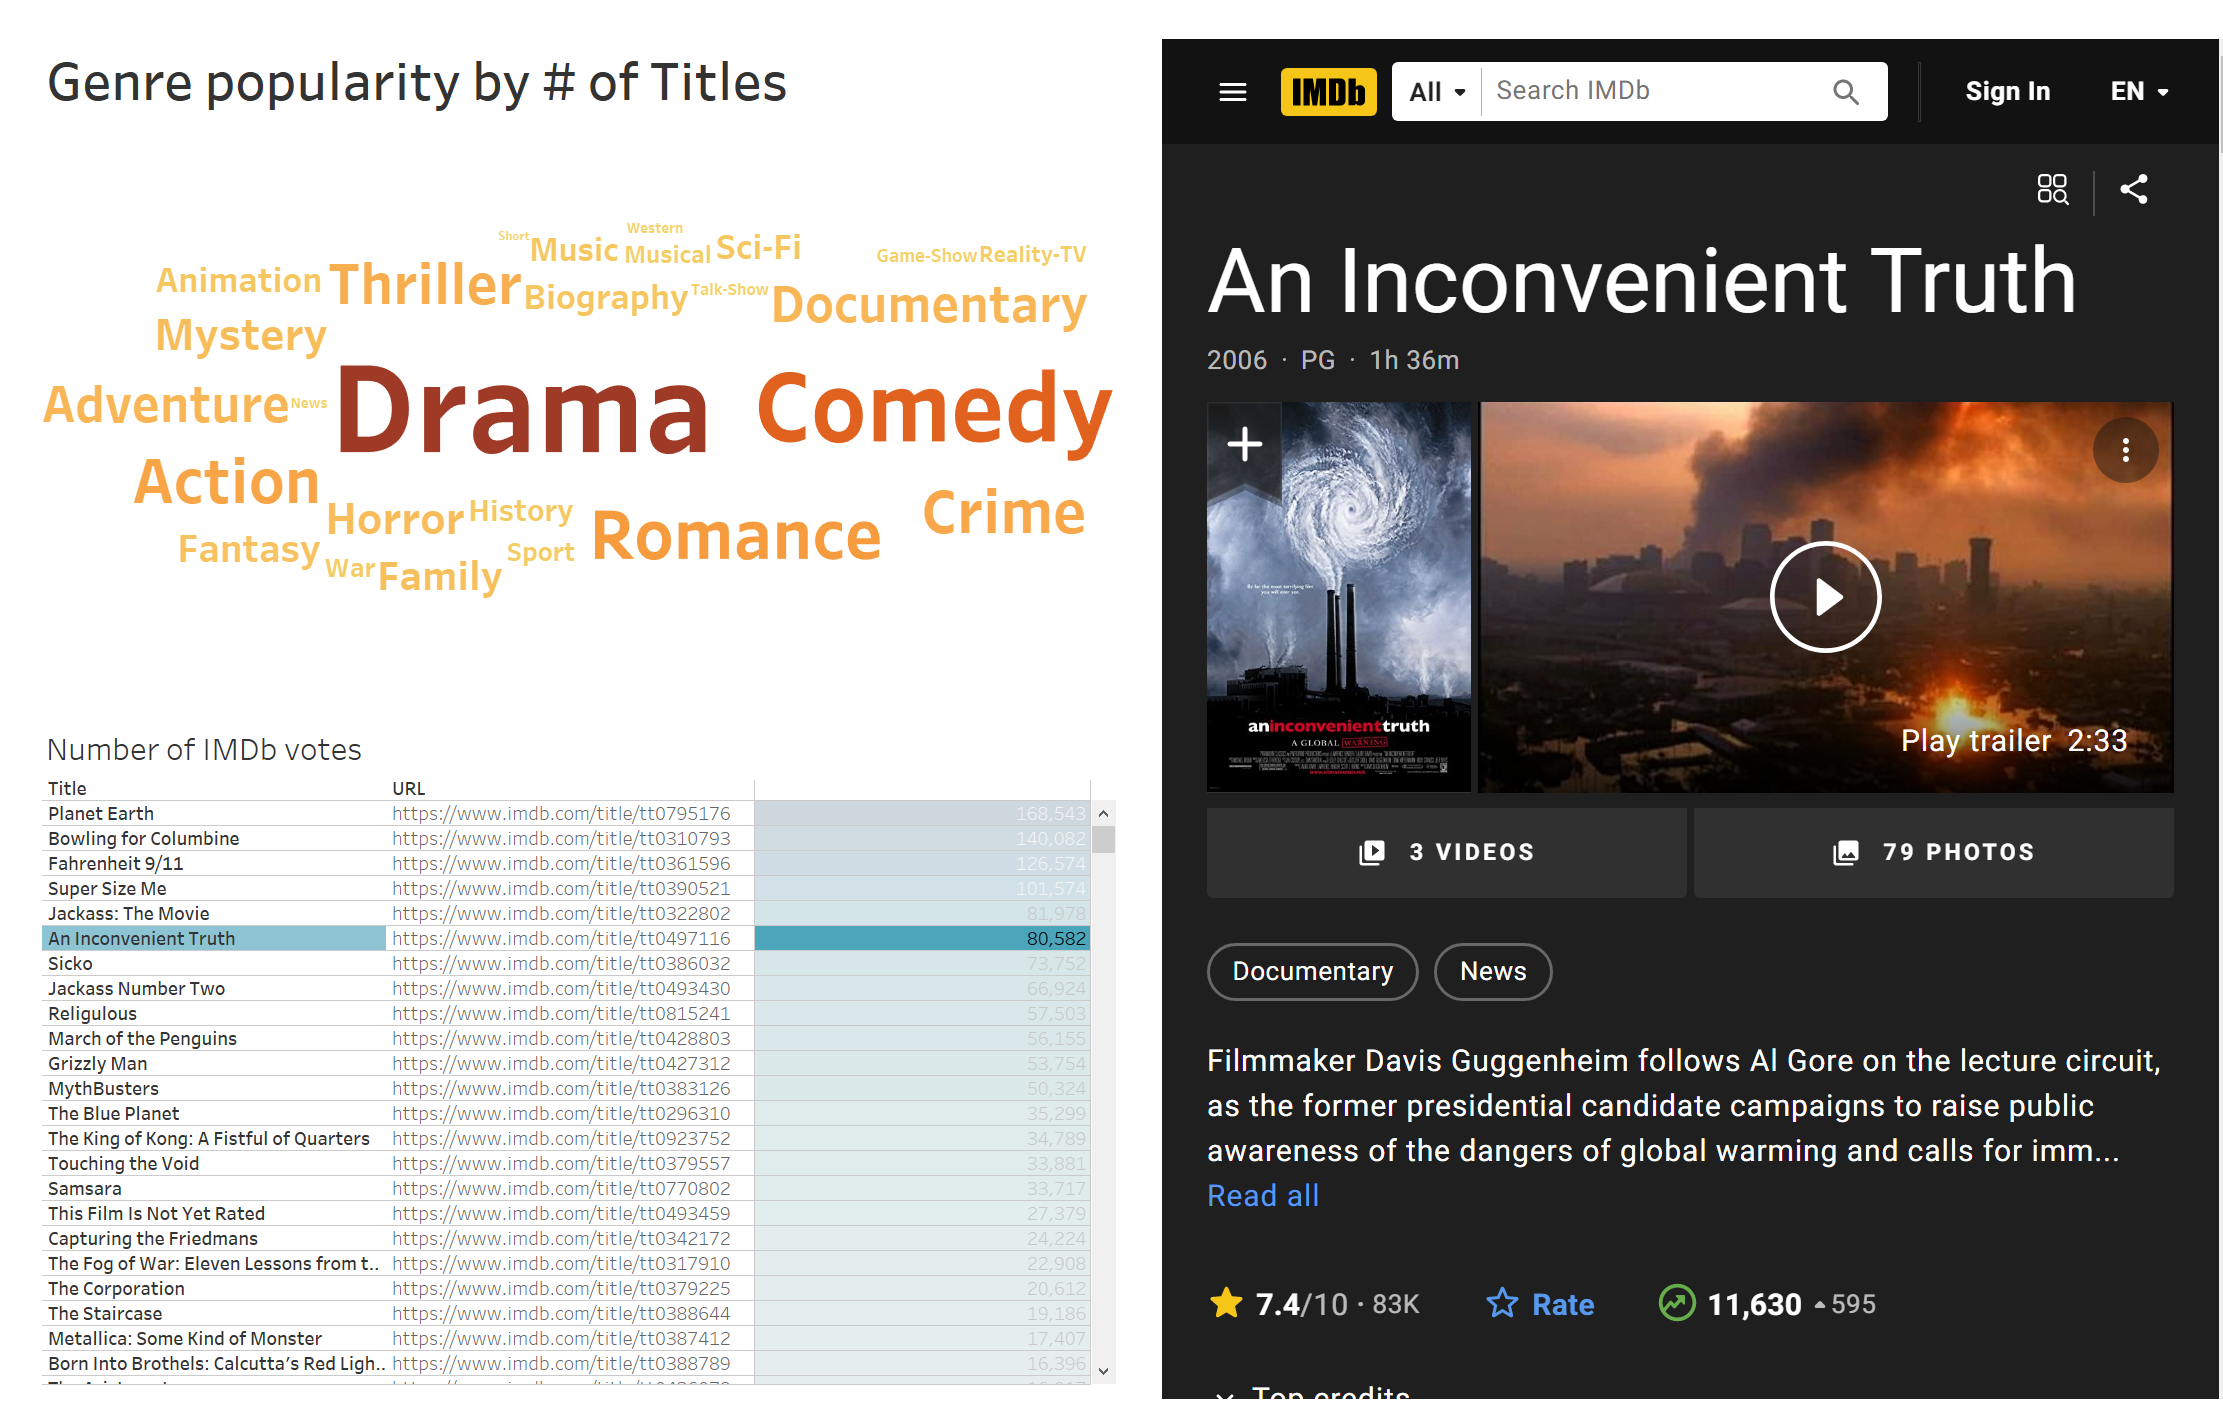
- Infographic-worthy charts
- Assembling a neat dashboard
- Working with Tableau data stories