Bringing it all together
Data Visualization in Tableau

Maarten Van den Broeck
Content Developer, DataCamp
Dashboarding vs. storytelling
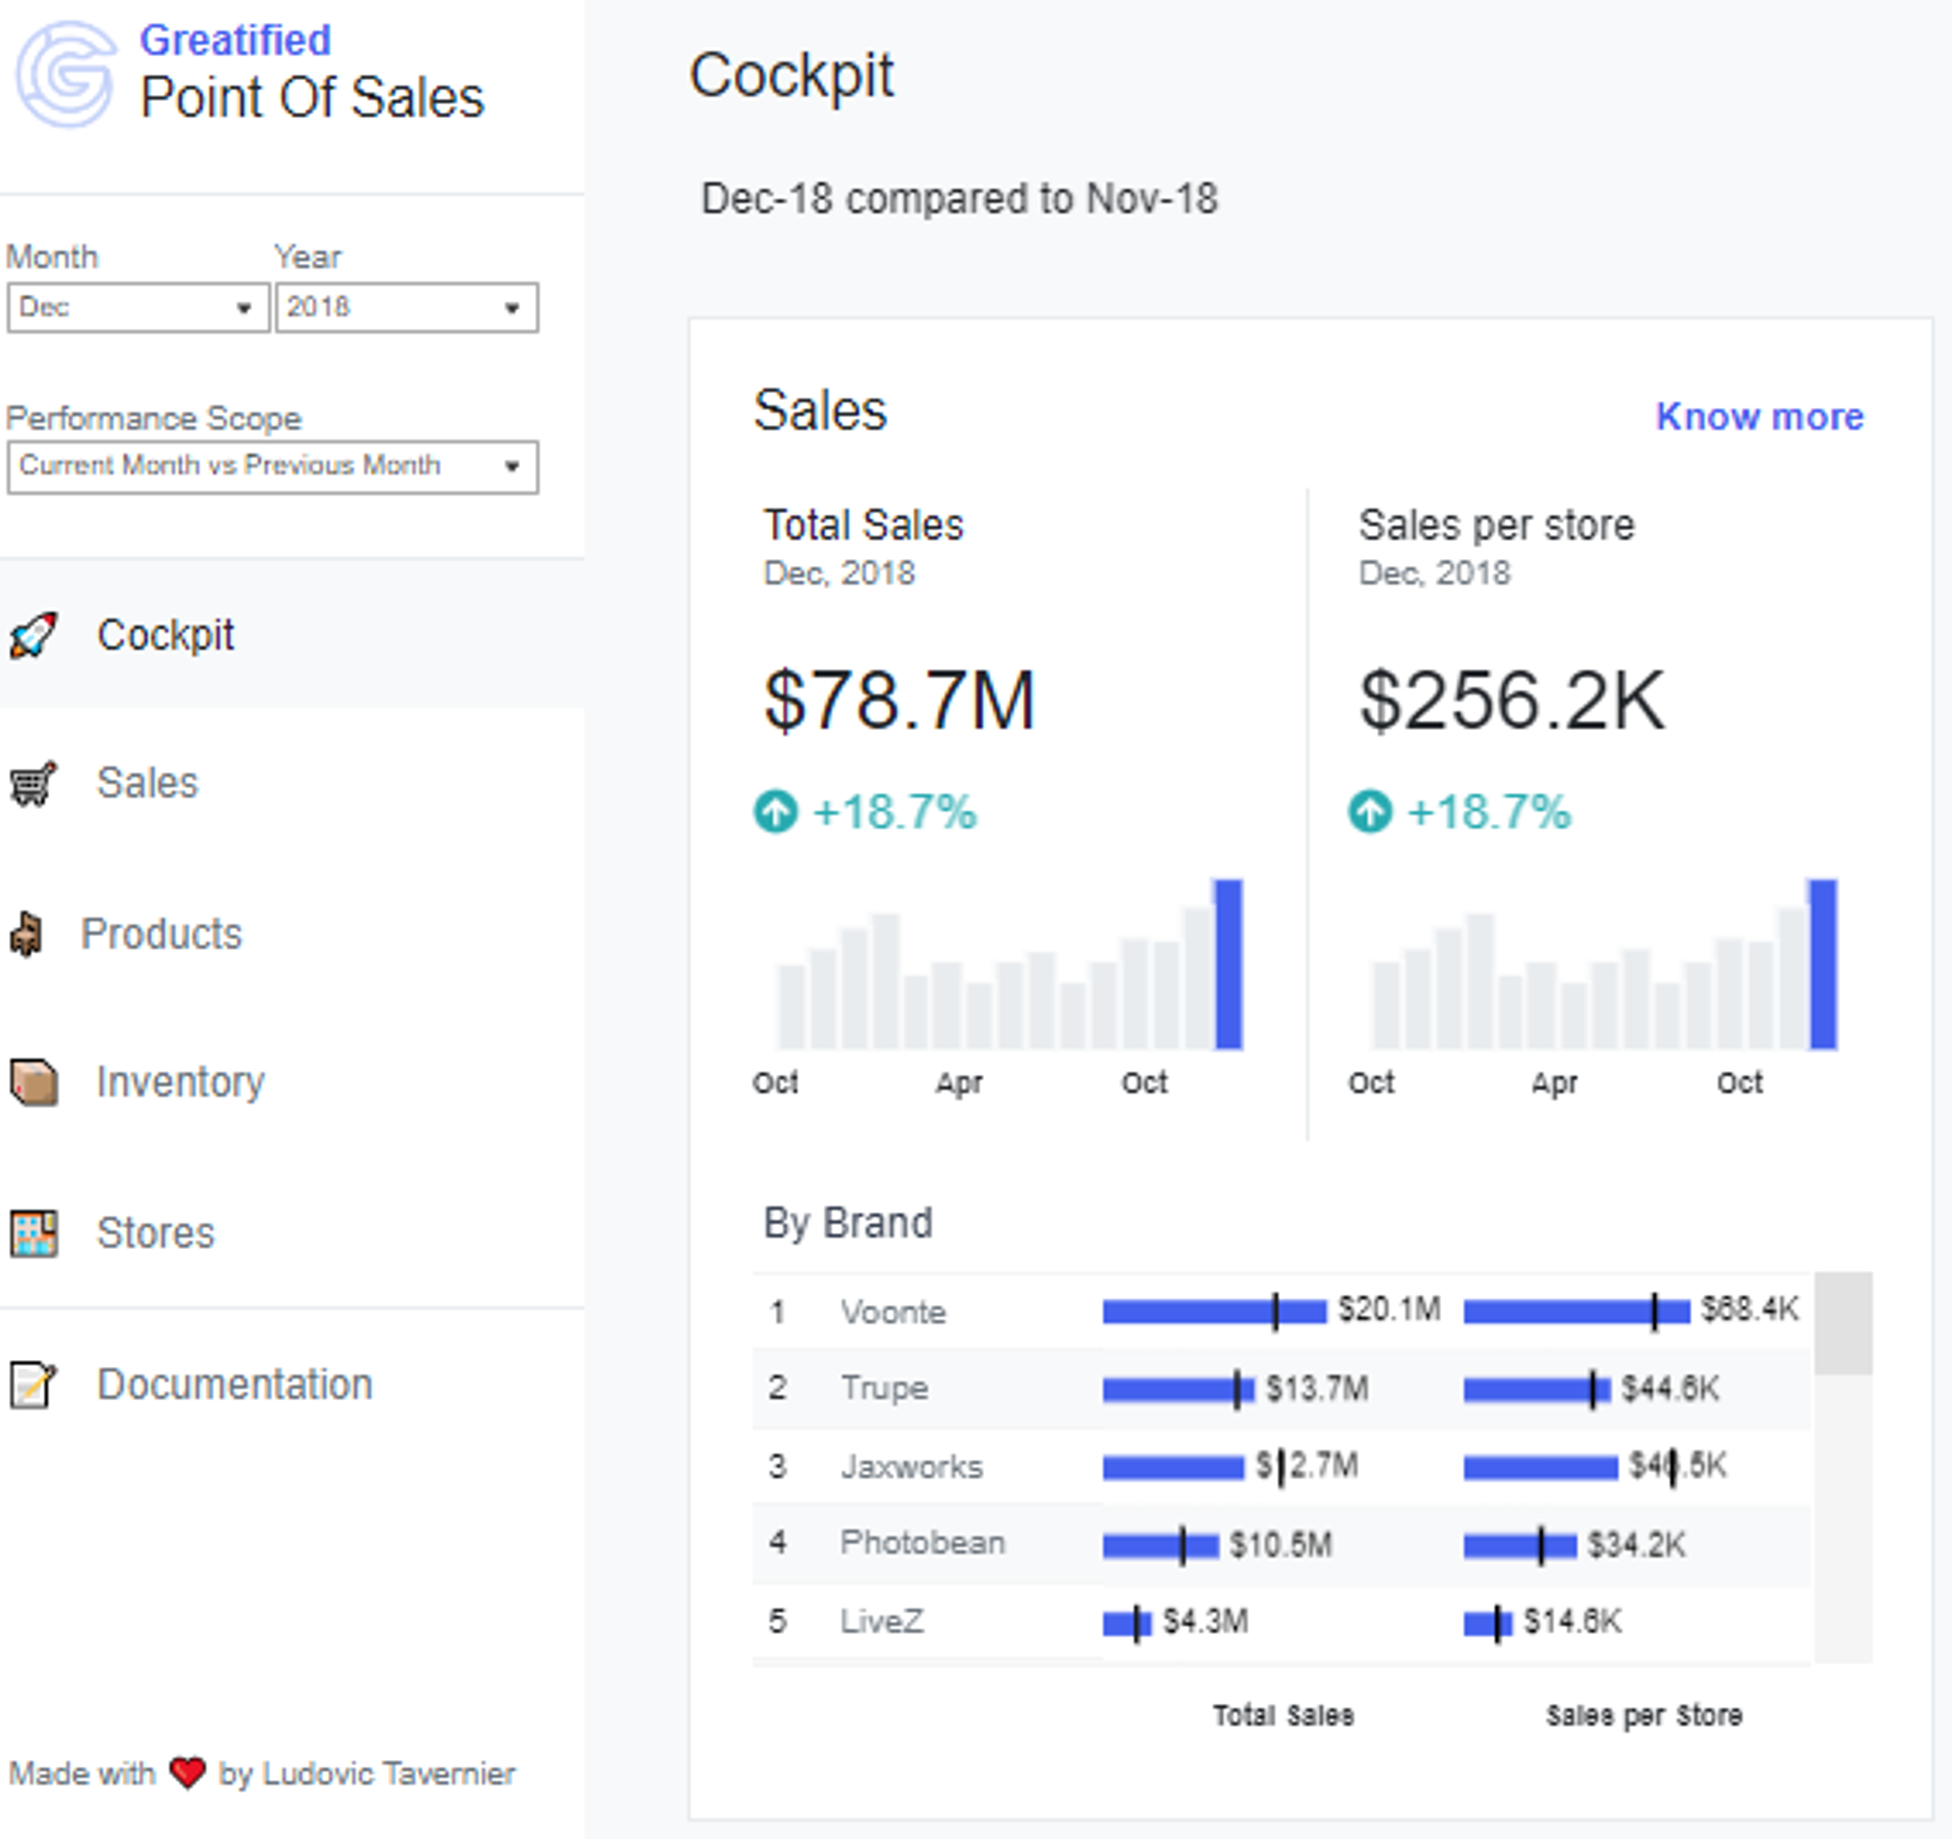
Dashboard:
- Self-service analytics, with filters
- Exploratory Data Analysis (a lot of detail)
Story:
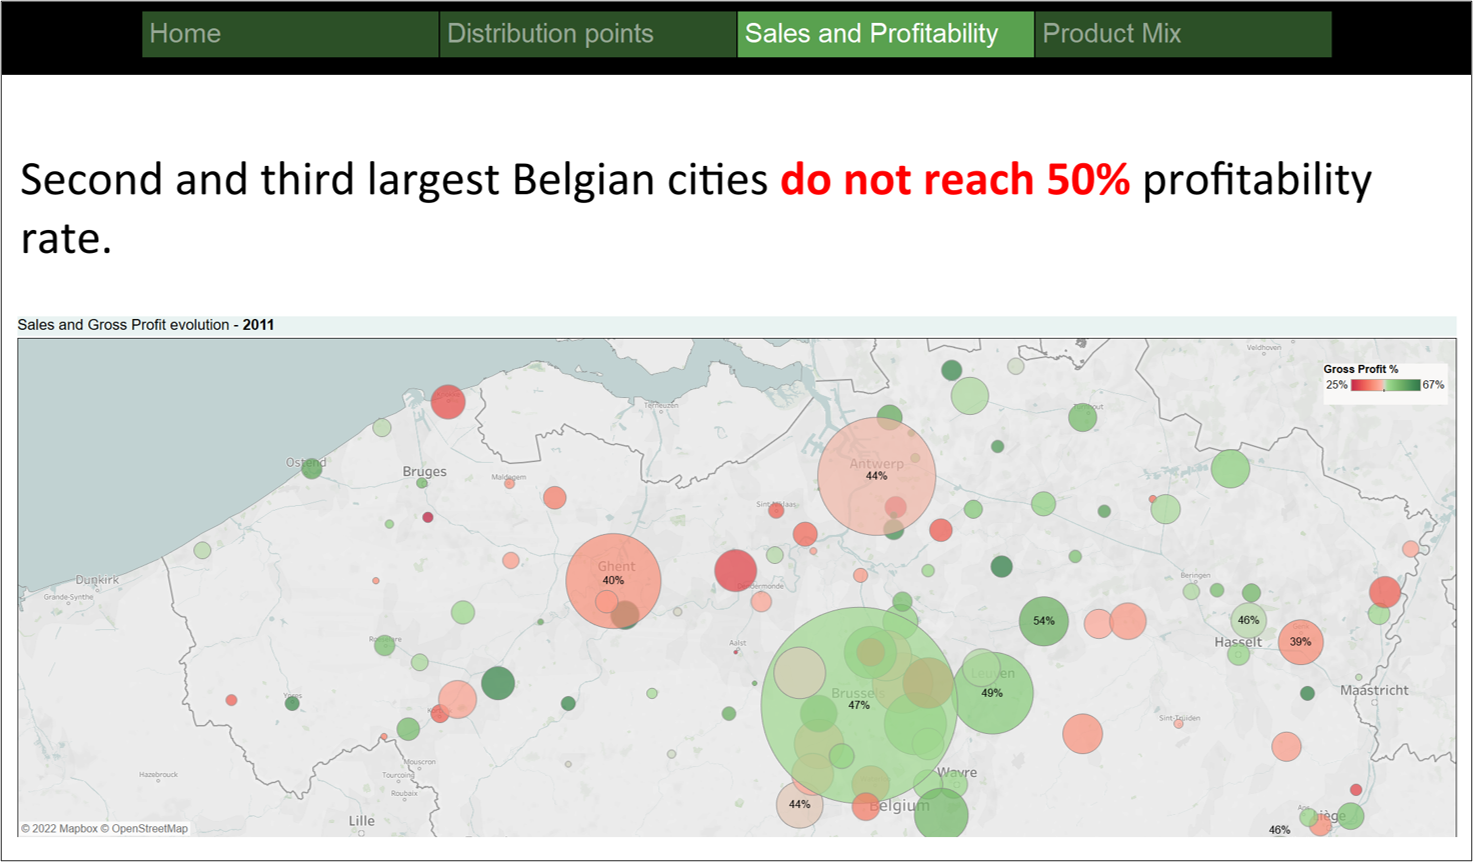
- Attention on insights, concrete data points
- Slide deck, presentation (high level)
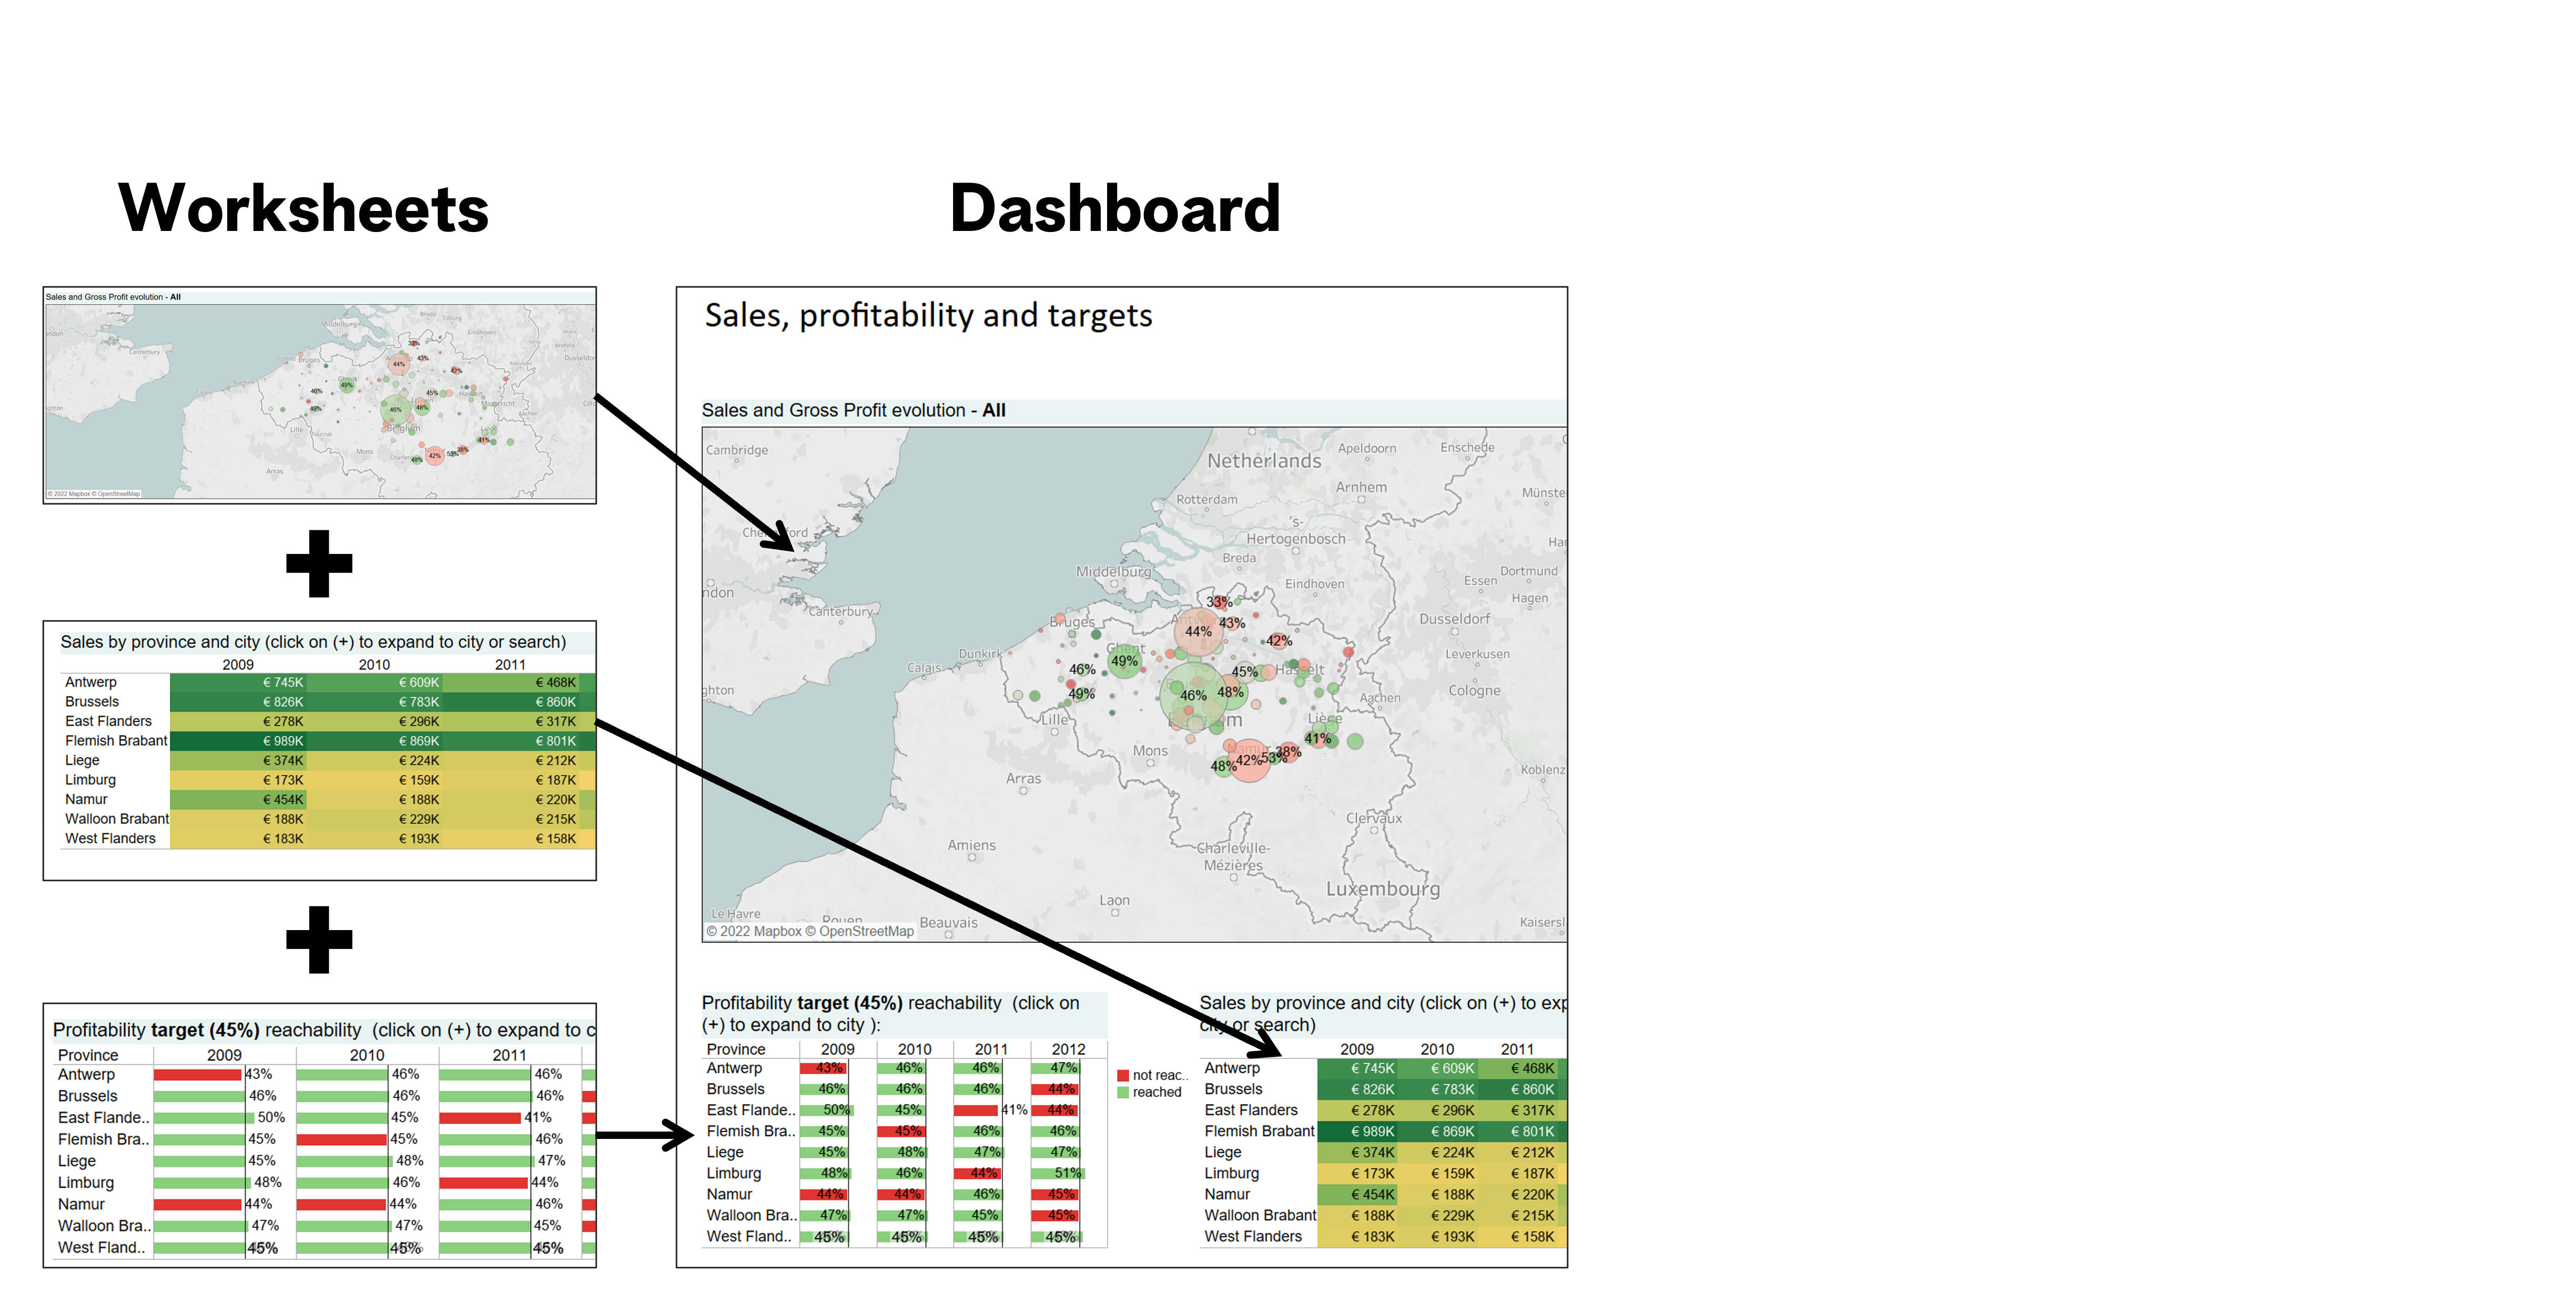
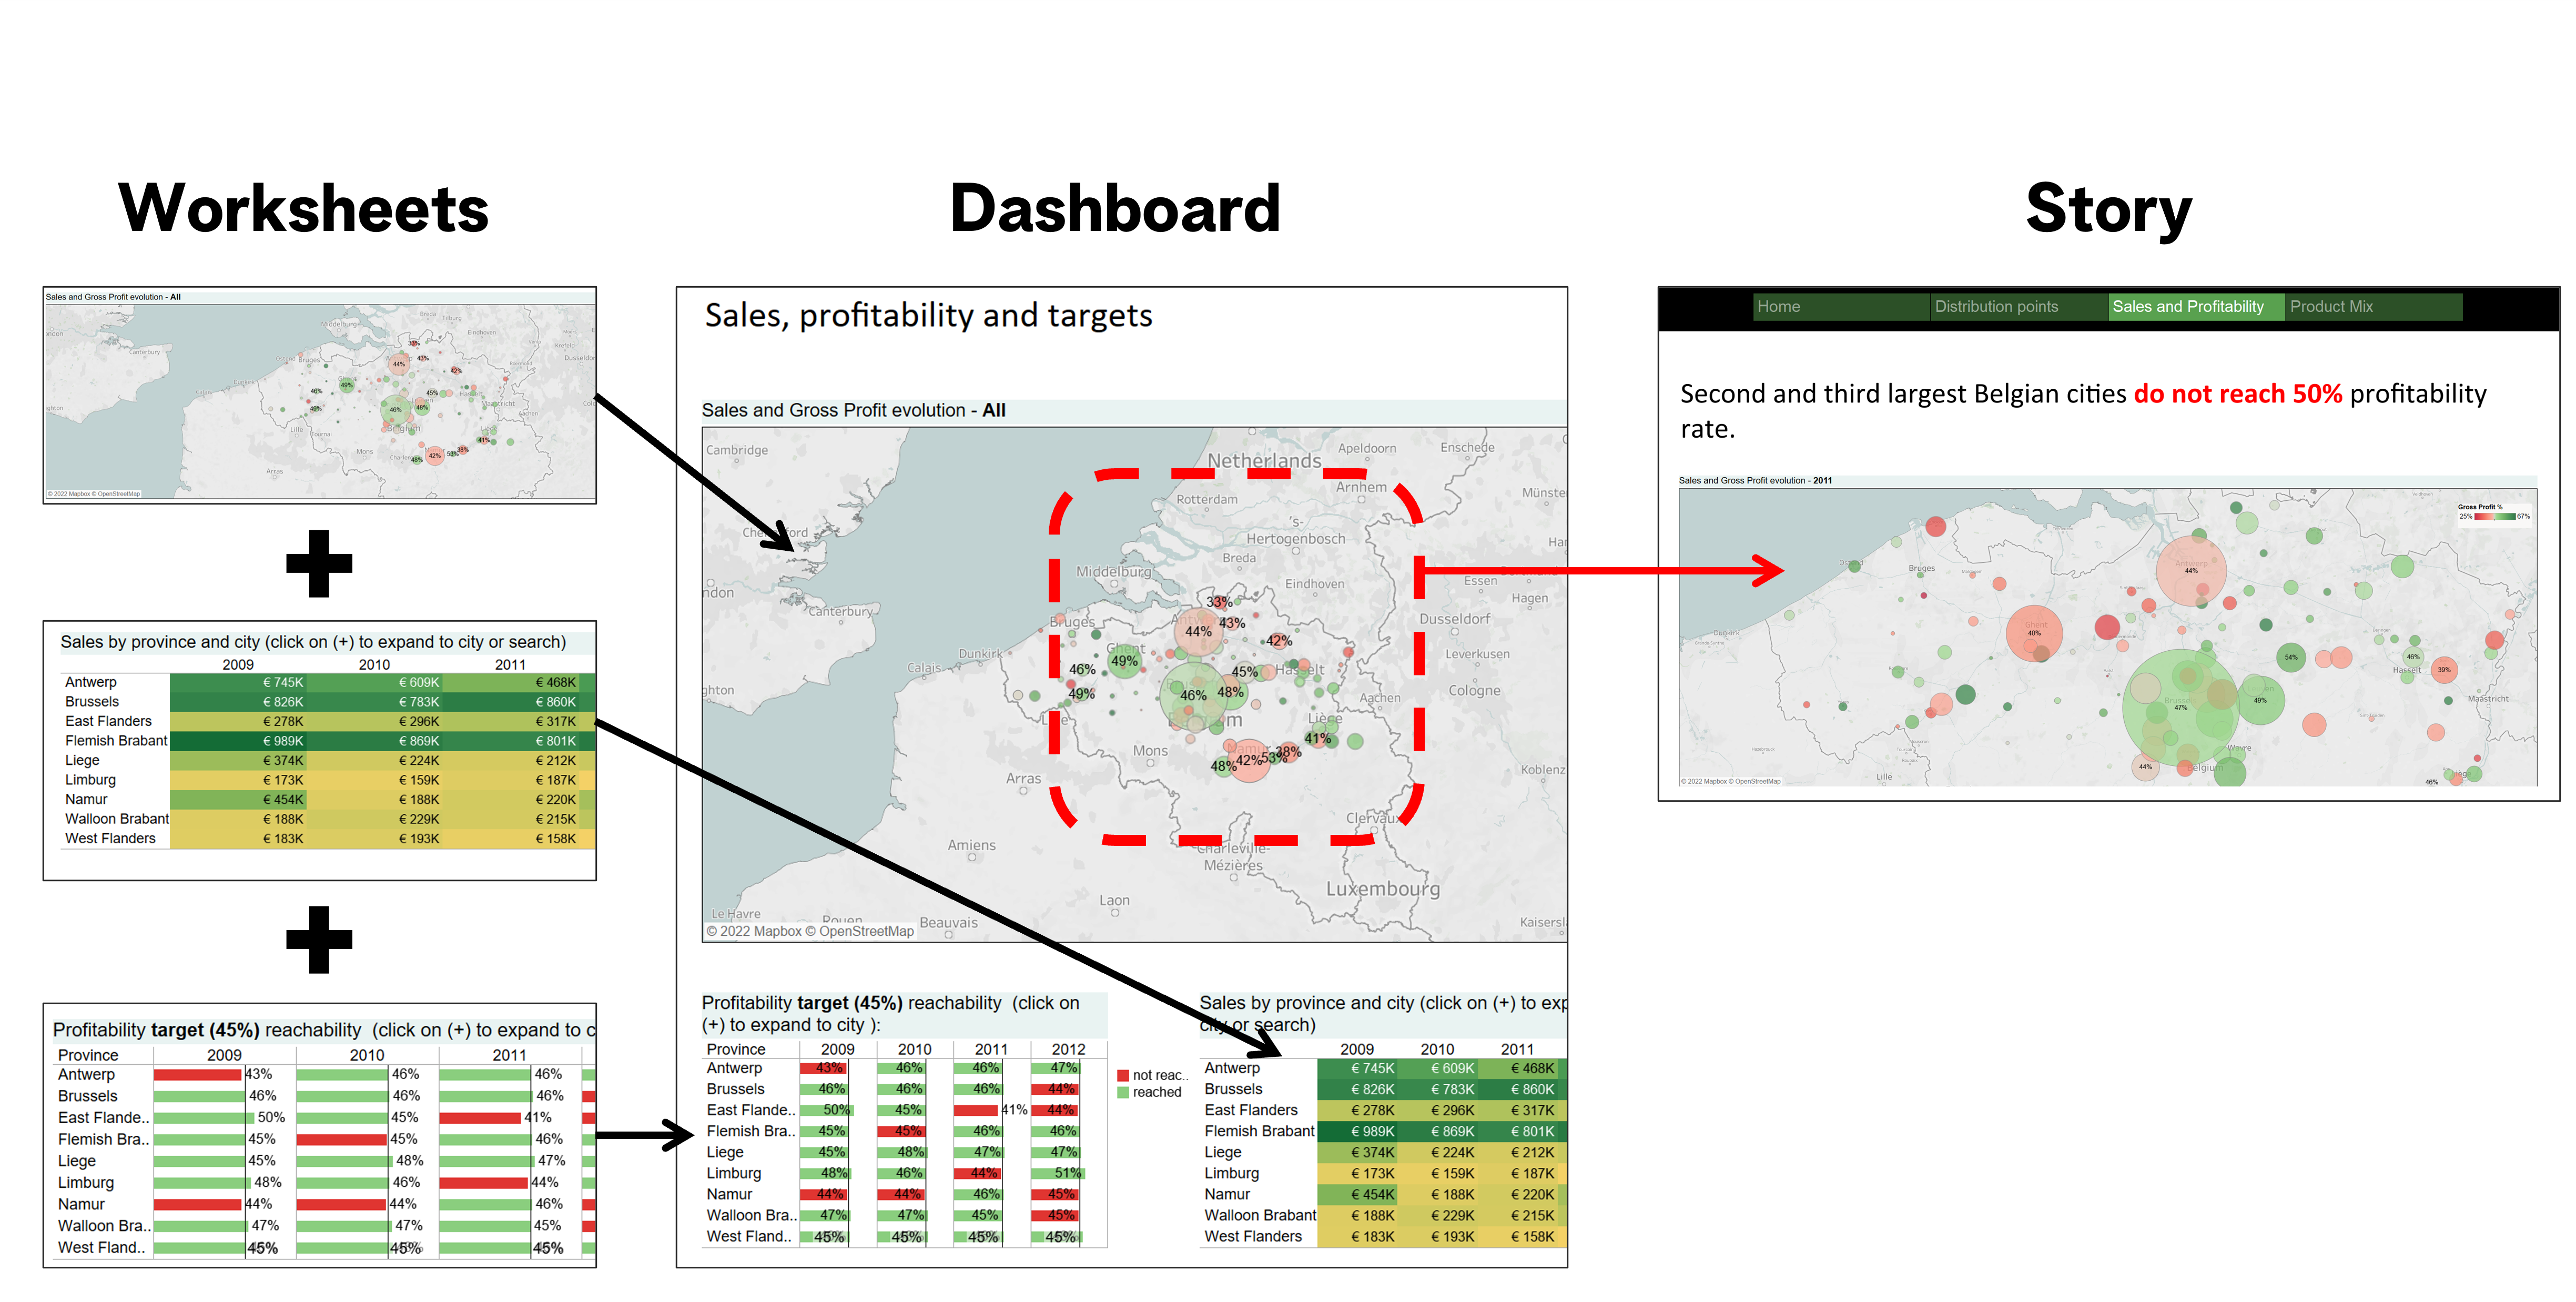
From worksheets...
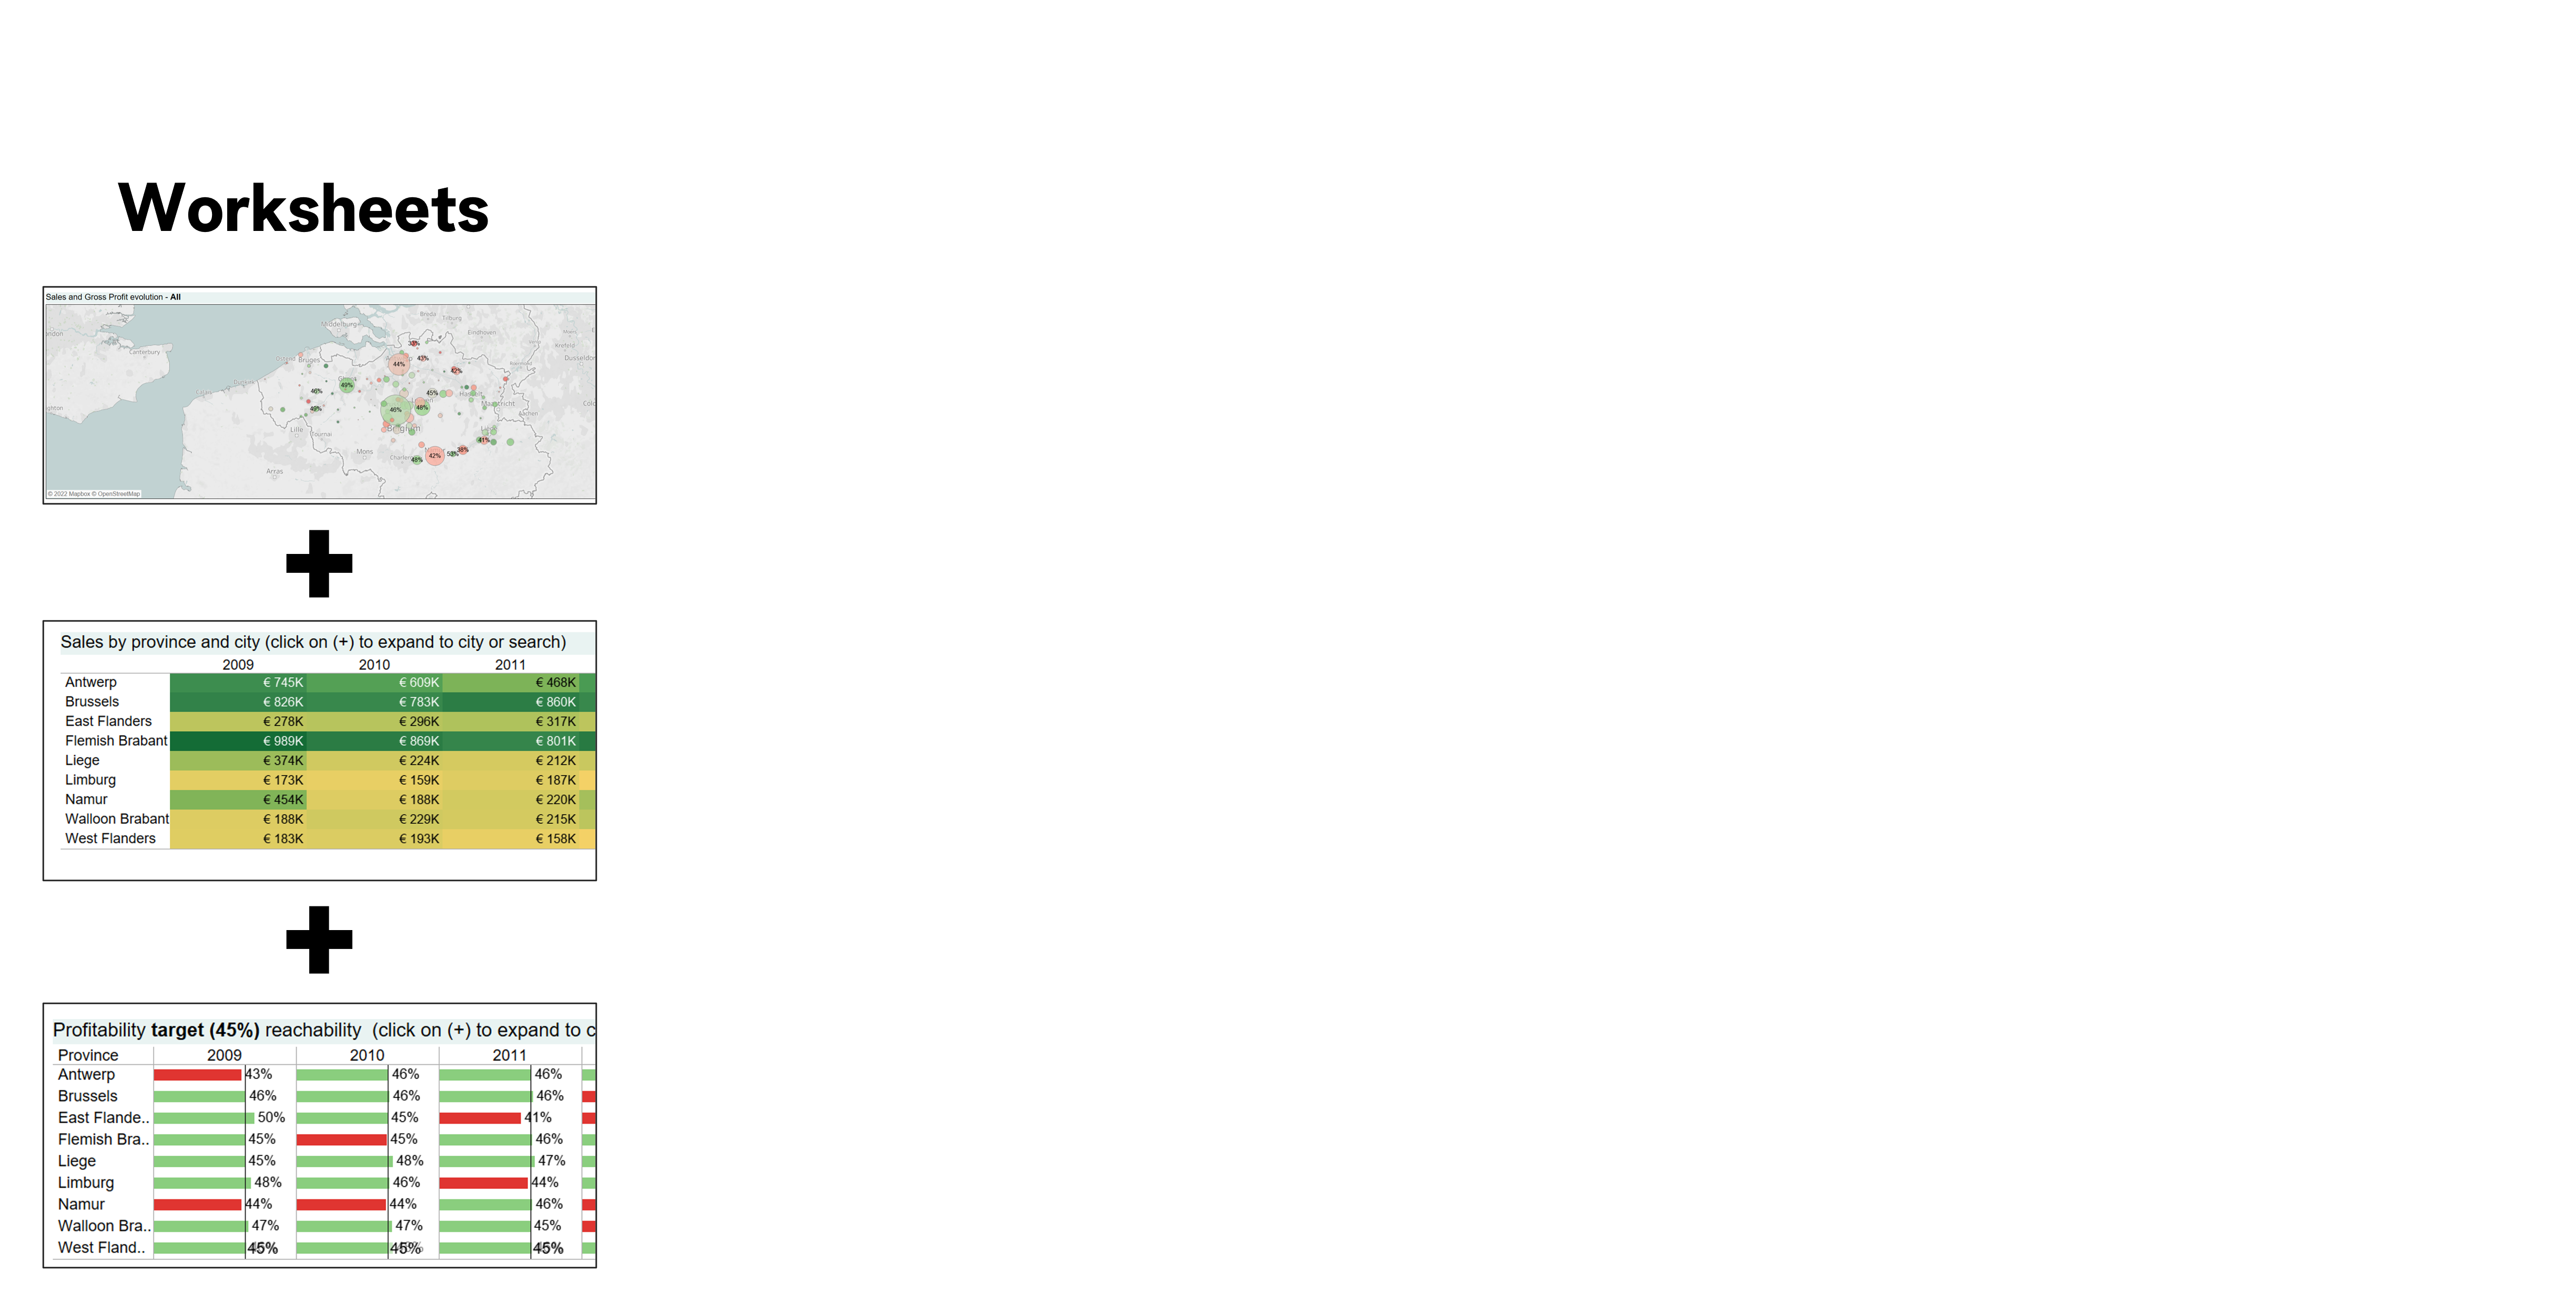
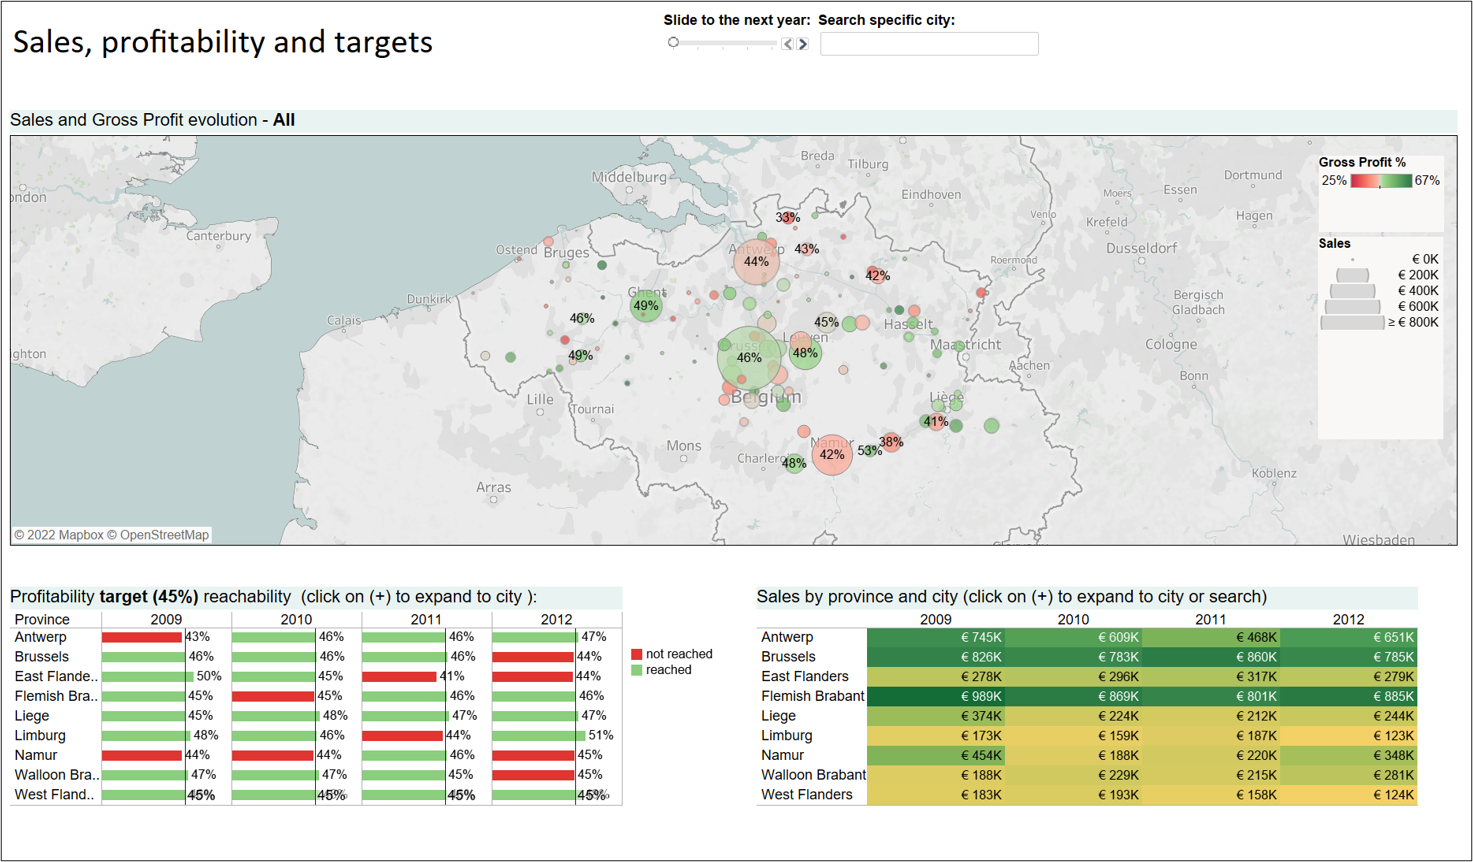
From worksheets to dashboards...
From worksheets to dashboards and data stories.
Looks matter - pretty and simple catches the eye!

Appealing design:
- Branding and styling
- Efficient use of space
- Self-explanatory (labels, titles)
Consider:
- Start small and expand
- Bounce ideas by non-data people
- Test meticulously and document
Design for any device
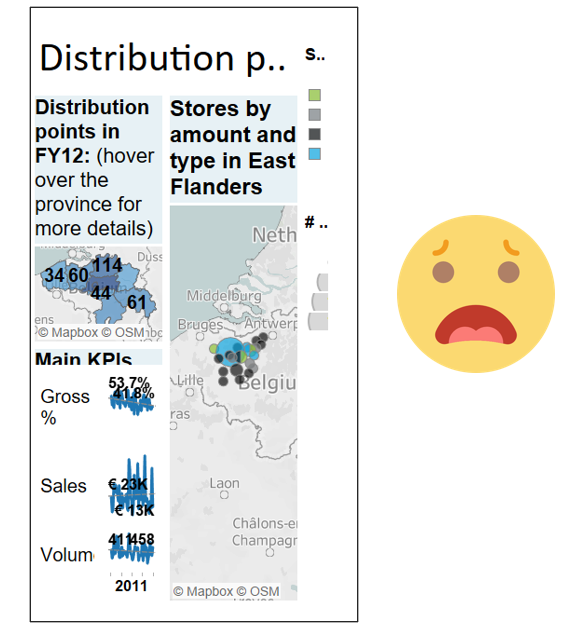
- Dashboard not designed for a mobile device
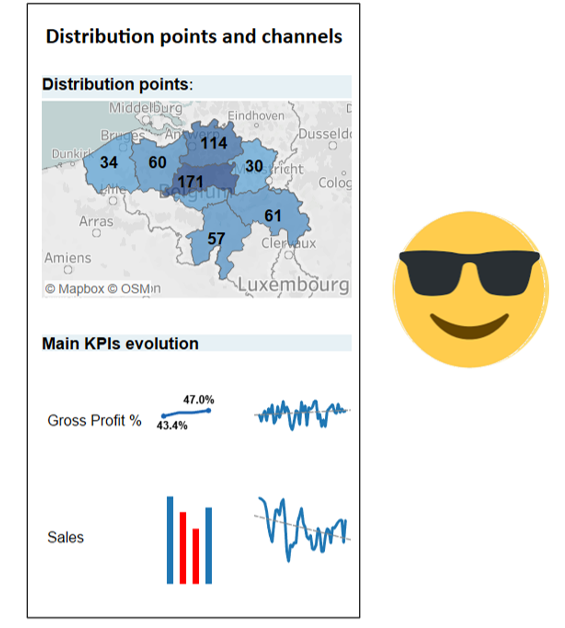
- Mobile device ready dashboard
Don't lose your audience!
- Work on your dashboard and story performance
- Aim at < 10 seconds of load time
- Identify the "heaviest" visualizations
- Limit the number of data marks
- Consider creating a data extract

1 https://www.datacamp.com/courses/connecting-data-in-tableau

