Time Series Decomposition for Outlier Detection

Anomaly Detection in Python

Bekhruz (Bex) Tuychiev

Kaggle Master, Data Science Content Creator
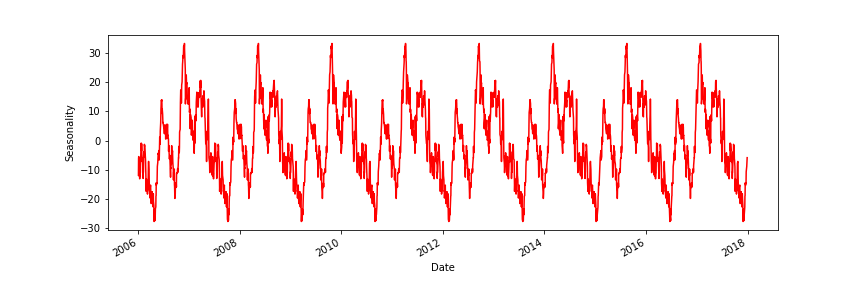
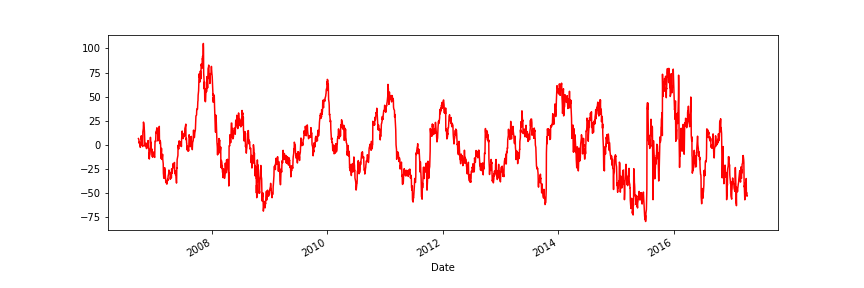
Seasonality

  • Repeating patterns in the time series
  • Has a fixed frequency:
    • hourly
    • daily
    • weekly
    • monthly, etc.
  • Examples:
    • Daily temperatures
    • Ice-cream sales
Anomaly Detection in Python

Seasonality

A lineplot of opening prices of Google stocks.

Anomaly Detection in Python

seasonal_decompose

from statsmodels.tsa.seasonal import seasonal_decompose

results = seasonal_decompose(google['Open'], period=365)

print(results)
<statsmodels.tsa.seasonal.DecomposeResult object at 0x7f0a67fac820>
Anomaly Detection in Python

Plotting seasonality

results.seasonal.plot(color="red", figsize=(12, 4))

A plot of seasonality of the opening prices of Google stocks

Anomaly Detection in Python

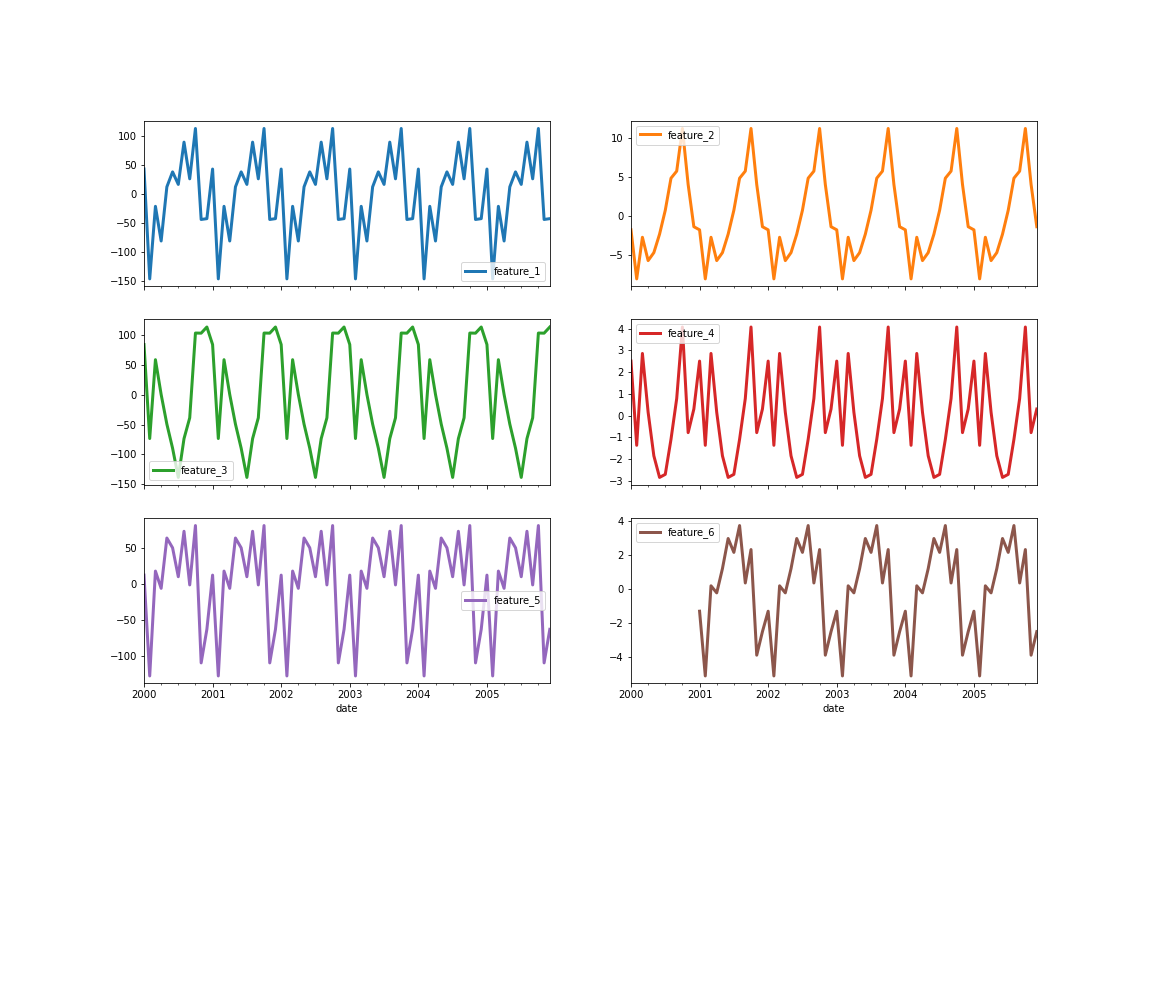
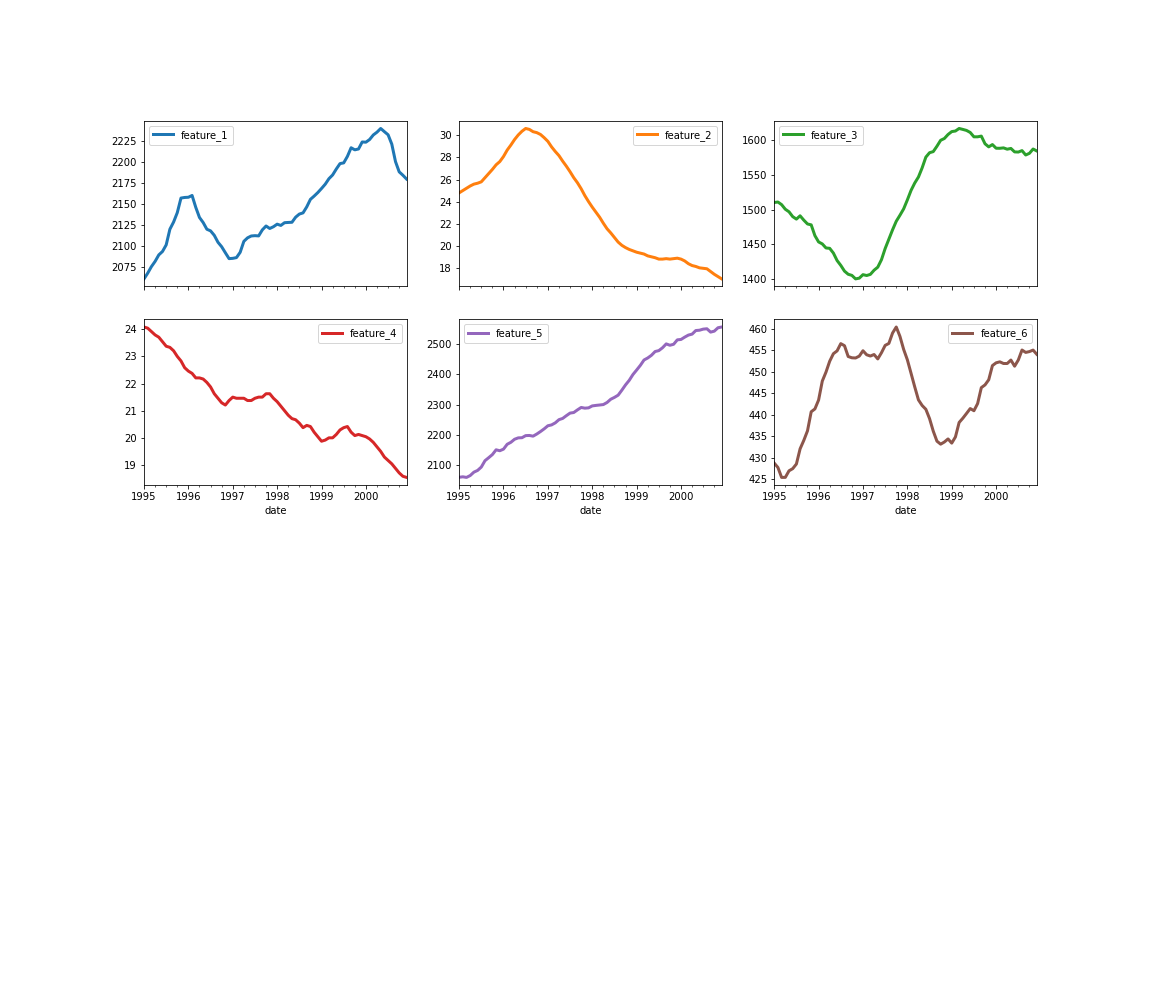
Seasonality examples

Examples of time series seasonality.

Anomaly Detection in Python

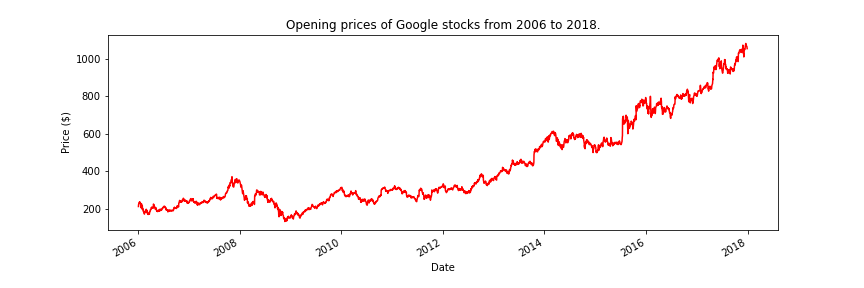
Initial plot of stocks

An initial plot of the opening prices of Google stocks

Anomaly Detection in Python

Trend

results.trend.plot(color="red", figsize=(12, 4))

Anomaly Detection in Python

Trend examples

Examples of time series trends.

Anomaly Detection in Python

Residuals

results.resid.plot(color="red", figsize=(12, 4))
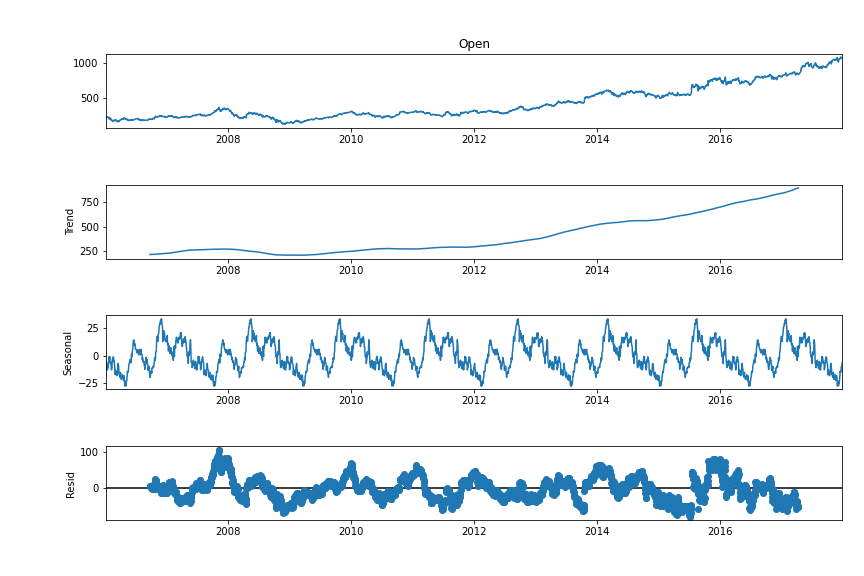
A plot of the residuals of the opening prices of Google stocks.

Anomaly Detection in Python

Decomposition

figure = results.plot()

figure.set_figwidth(12)
figure.set_figheight(8)

All three components of time series visualized.

Anomaly Detection in Python

Fitting a classifier

# Extract and reshape residuals
results = seasonal_decompose(google['Volume'], period=365)
residuals = results.resid
residuals = residuals.values.reshape(-1, 1)


# Fit MAD mad = MAD().fit(residuals)
# Find the outliers is_outlier = mad.labels_ == 1 outliers = google[is_outlier] print(len(outliers))
81
Anomaly Detection in Python

Let's practice!

Anomaly Detection in Python

Preparing Video For Download...