Box plots and IQR
Anomaly Detection in Python

Bekhruz (Bex) Tuychiev
Kaggle Master, Data Science Content Creator
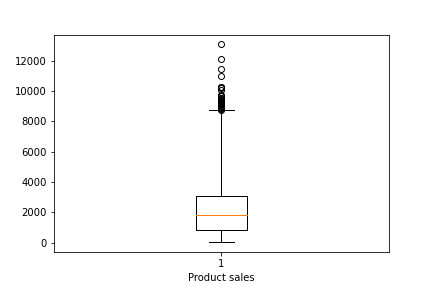
Boxplots recap
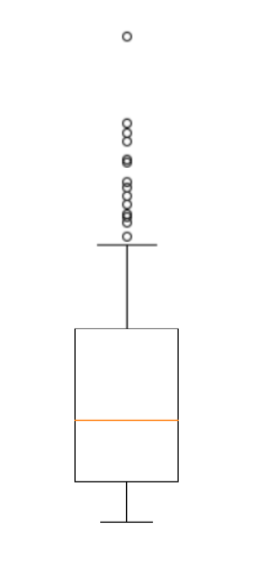
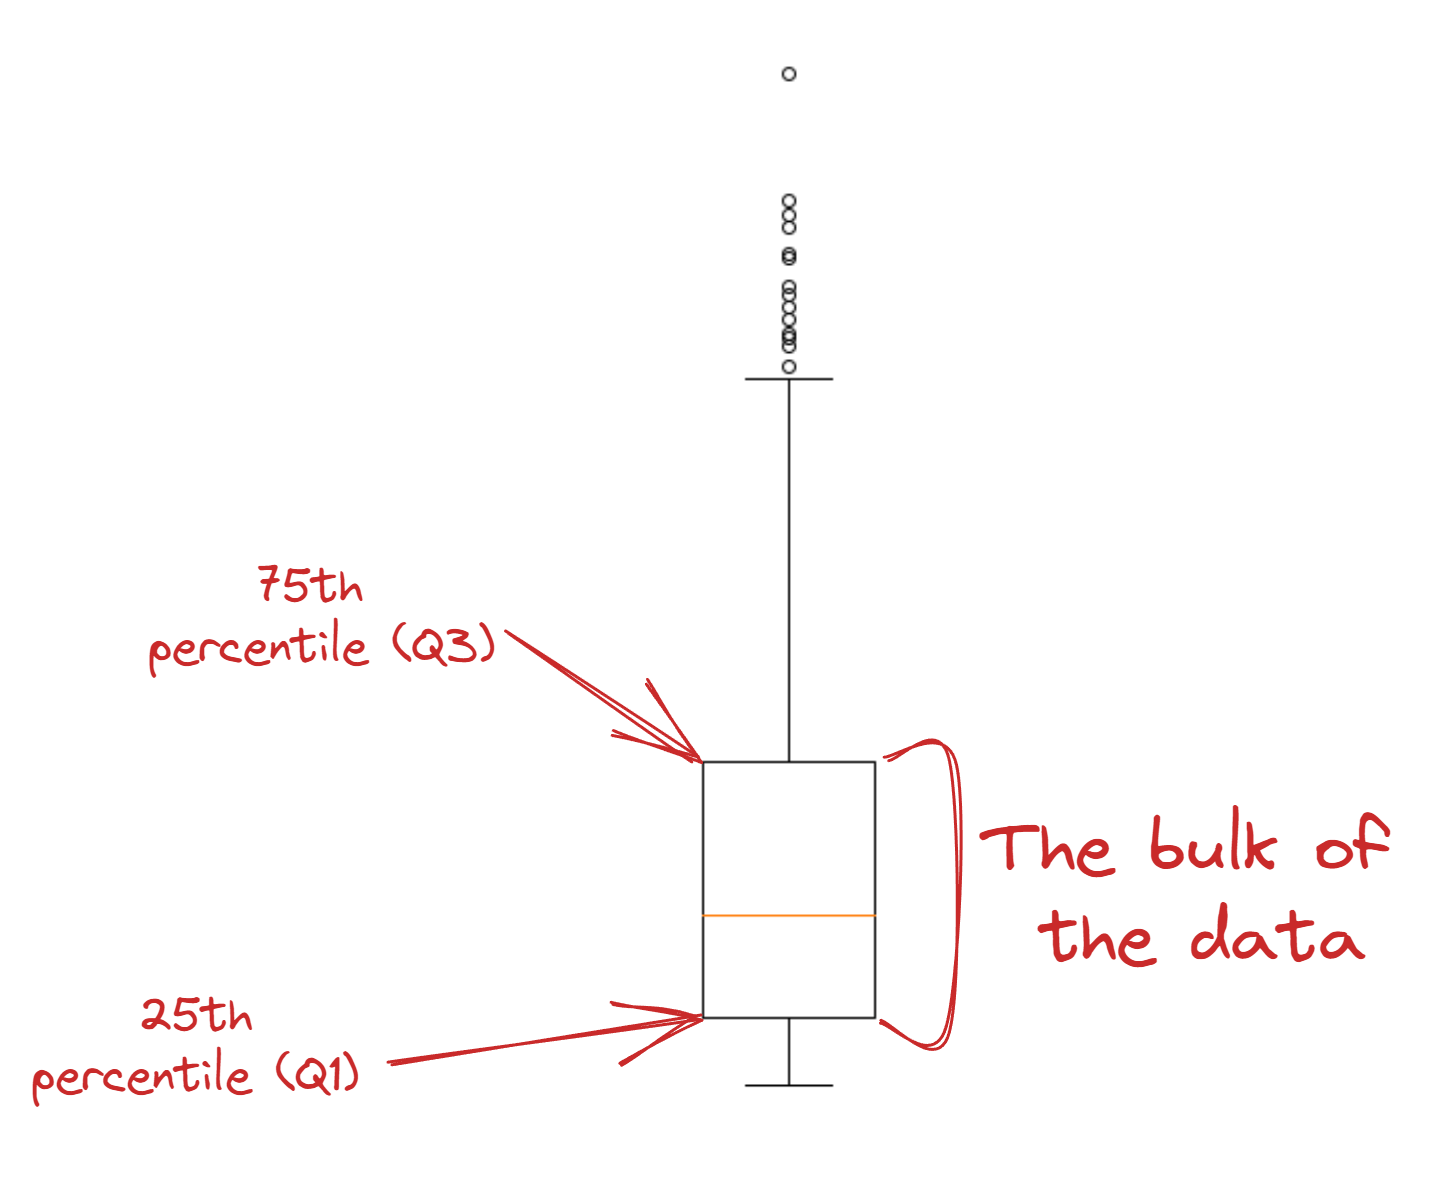
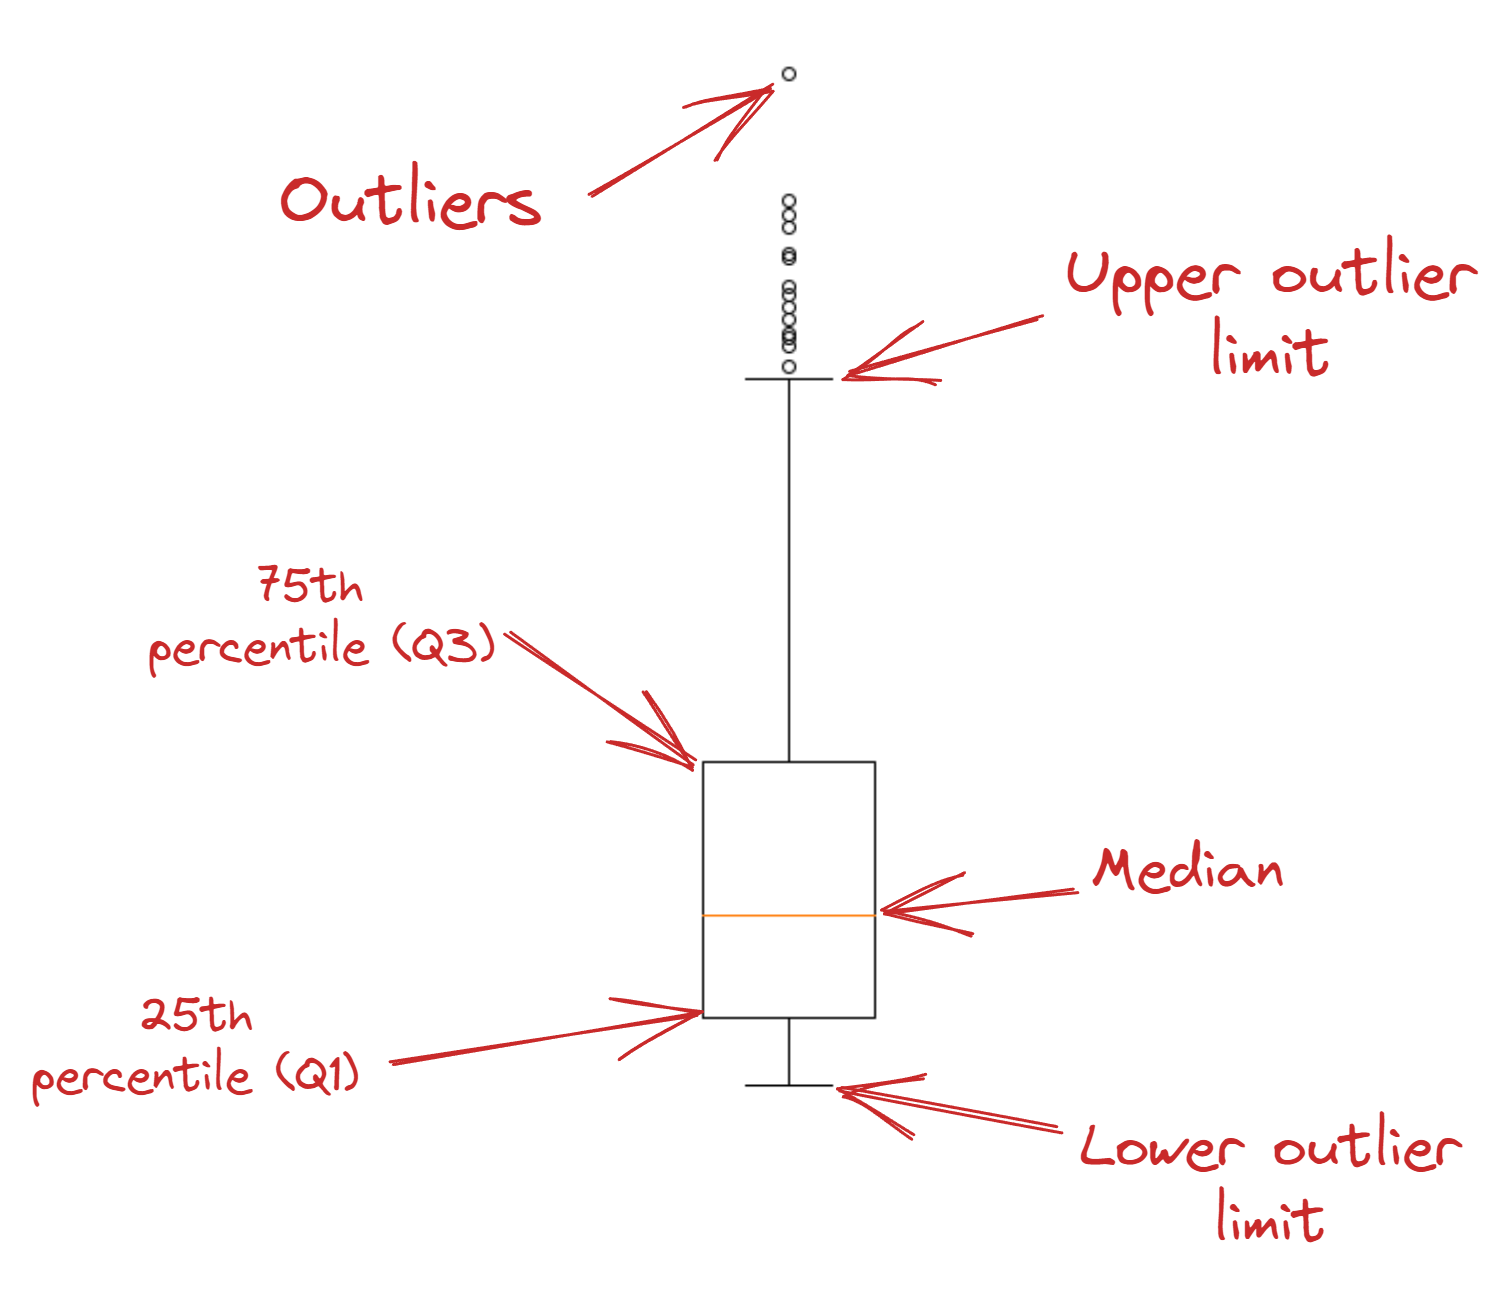
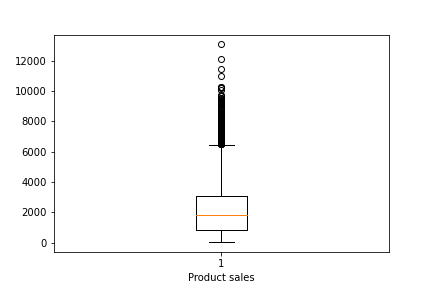
Boxplot components
Whiskers
Inter Quartile Range (IQR)
Calculating whisker lengths
Drawing boxplots
Controlling whisker lengths