Analysis for Inventory Control and Management

Case Study: Inventory Analysis in Power BI

Danny Cevallos

Statistician and Data Scientist

Analysis workflow

Data analysis process, with only the analyze and visualize data section highlighted.

Case Study: Inventory Analysis in Power BI

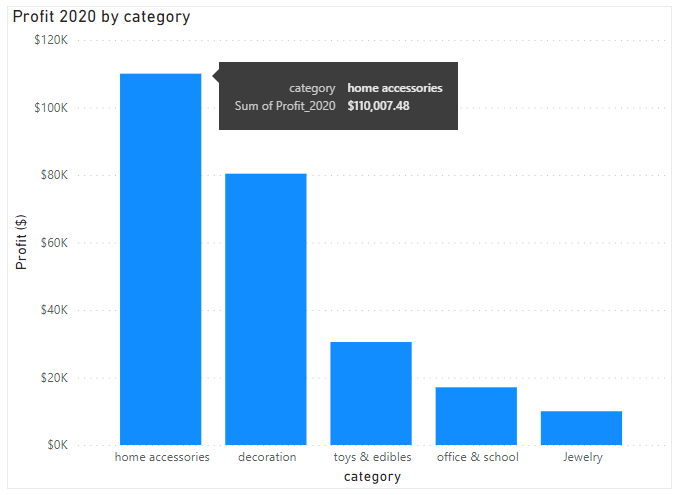
Preliminary insights

 
A column chart showing the gross profit in 2020 by category.


  • Decoration and Jewelry items have COGS of around $5
  • Profit dominated by Home & accessories in 2020, with $110K
  • "Grow a flytrap or sunflower" is a top seller
Case Study: Inventory Analysis in Power BI

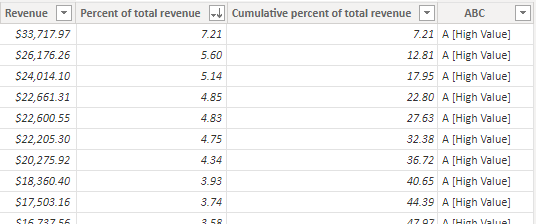
Inventory analysis metrics

More insightful calculations:

  • Average inventory value
  • Inventory turnover
  • ABC analysis

Cartoon image of a man carrying out calculations on a large  calculator.

Case Study: Inventory Analysis in Power BI

Average inventory and turnover


Average inventory value


$\frac{Starting\;value\;+\;Ending\;value}{2}$


Inventory turnover


$\frac{COGS}{Average\;value\;of\;inventory}$

1 https://www.investopedia.com/terms/i/inventoryturnover.asp
Case Study: Inventory Analysis in Power BI

ABC analysis

Four steps:

  1. Revenue

  2. Percent of total revenue

  3. Cumulative increase

  4. ABC

  Table showing four columns - revenue, percent of total revenue, cumulative percent of total revenue, and ABC.

1 Handanhal and Misra (2014). ABC Analysis for Inventory Management: Bridging the Gap between Research and Classroom.
Case Study: Inventory Analysis in Power BI

Following steps

Using these new metrics will allow you to see hidden relations in your data.

  Cartoon image showing two people looking at data visualizes with a magnifying glass.

Case Study: Inventory Analysis in Power BI

Let's practice!

Case Study: Inventory Analysis in Power BI

Preparing Video For Download...