Reporting analytics

Case Study: Inventory Analysis in Power BI

Danny Cevallos

Statistician and Data Scientist
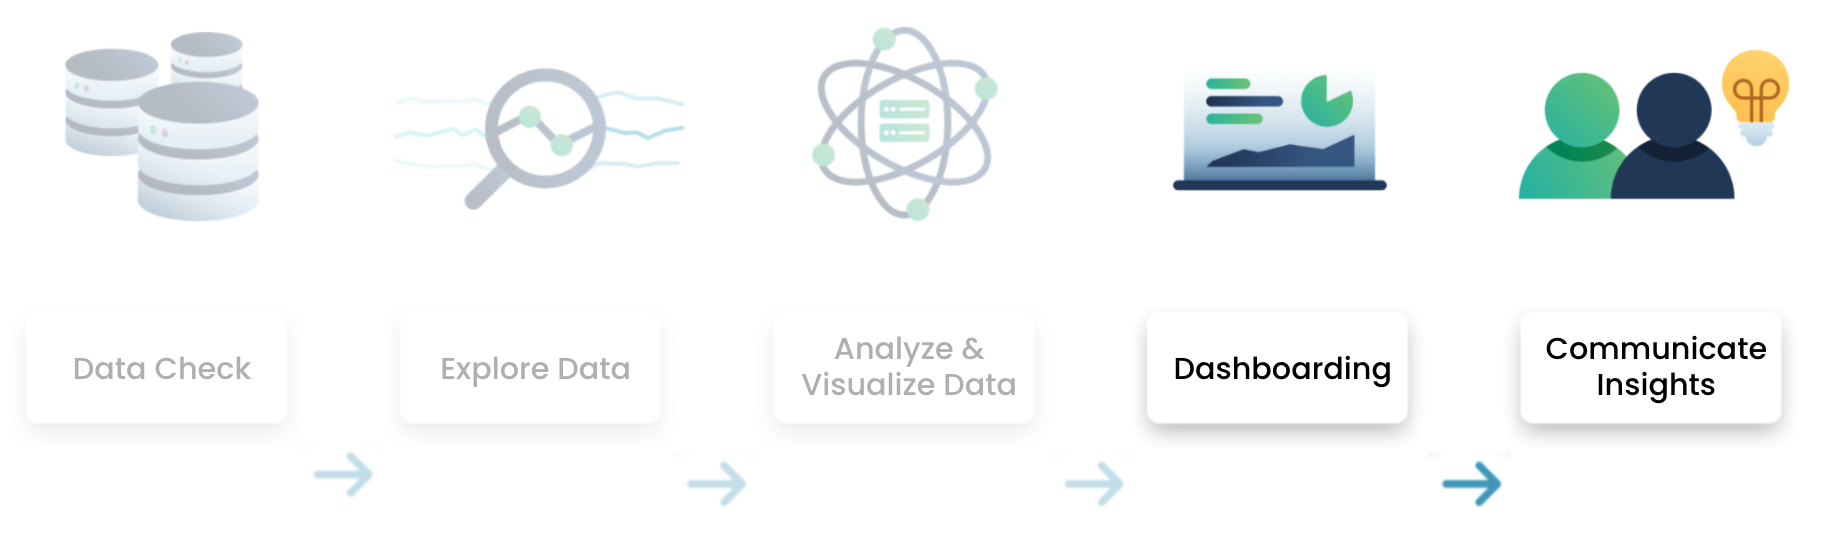
Analysis workflow

Data analysis process, with the dashboarding and communicating insights sections highlighted.

Case Study: Inventory Analysis in Power BI

Objectives

Cartoon image of a computer screen displaying a data visualization dashboard.

  • Which items would be best for renewing or increasing inventory?
  • How would you understand this by category?
  • What is the influence of the countries?
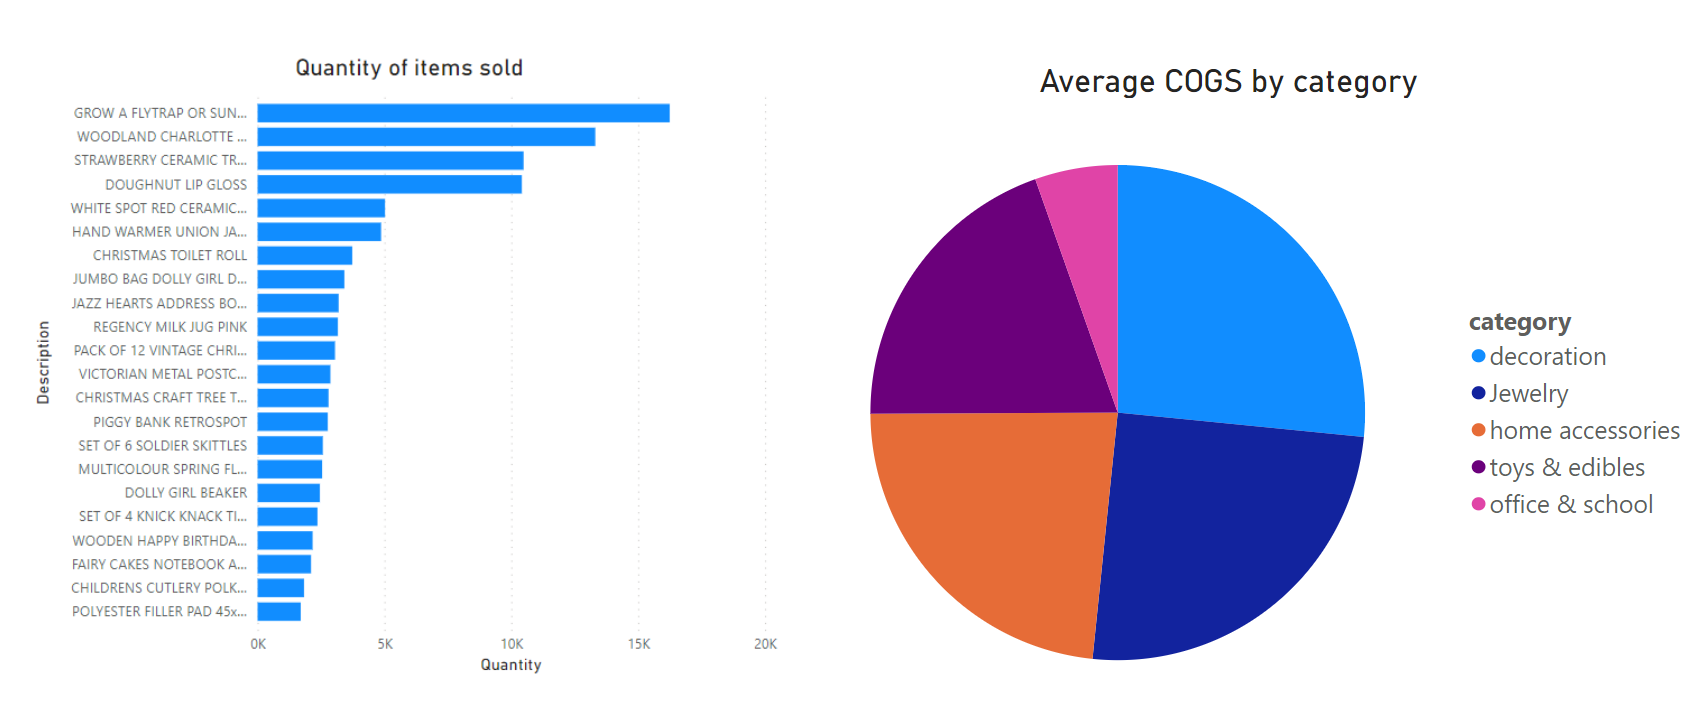
Case Study: Inventory Analysis in Power BI

Preliminary results

  • "Glow a Flytrap" leads in sales
  • "Doughnut lip gloss" sells faster
  • "Set of 6 soldier skittles" has increased in sales
  • All three belong to class A

Cartoon image of a group of people discussing different topics displayed on a whiteboard.

Case Study: Inventory Analysis in Power BI

Telling a story

Cartoon image of a man holding a briefcase, selecting specific data visualizations from a number of visualization options in front of him.

Focus your presentation on good inventory management practices:

  • Smart purchasing
  • Control policies
  • Stock management
Case Study: Inventory Analysis in Power BI

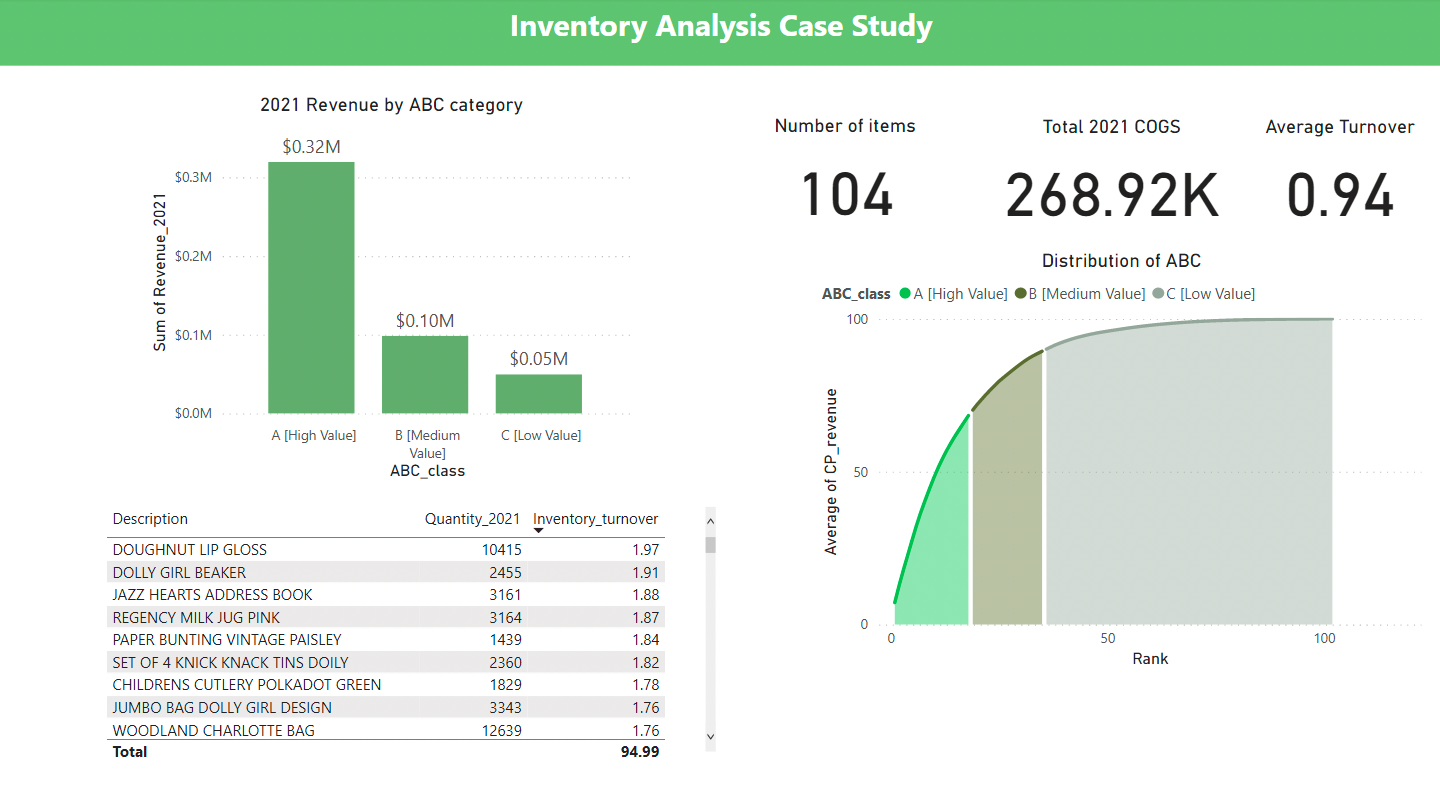
Building your dashboard

Example of a finished dashboard created for WarmeHands.

Case Study: Inventory Analysis in Power BI

Next steps

Image of two data visuals - one of a bar chart for the quantity of items sold, and the other of a pie chart for the average COGS be category.

Case Study: Inventory Analysis in Power BI

Let's practice!

Case Study: Inventory Analysis in Power BI

Preparing Video For Download...