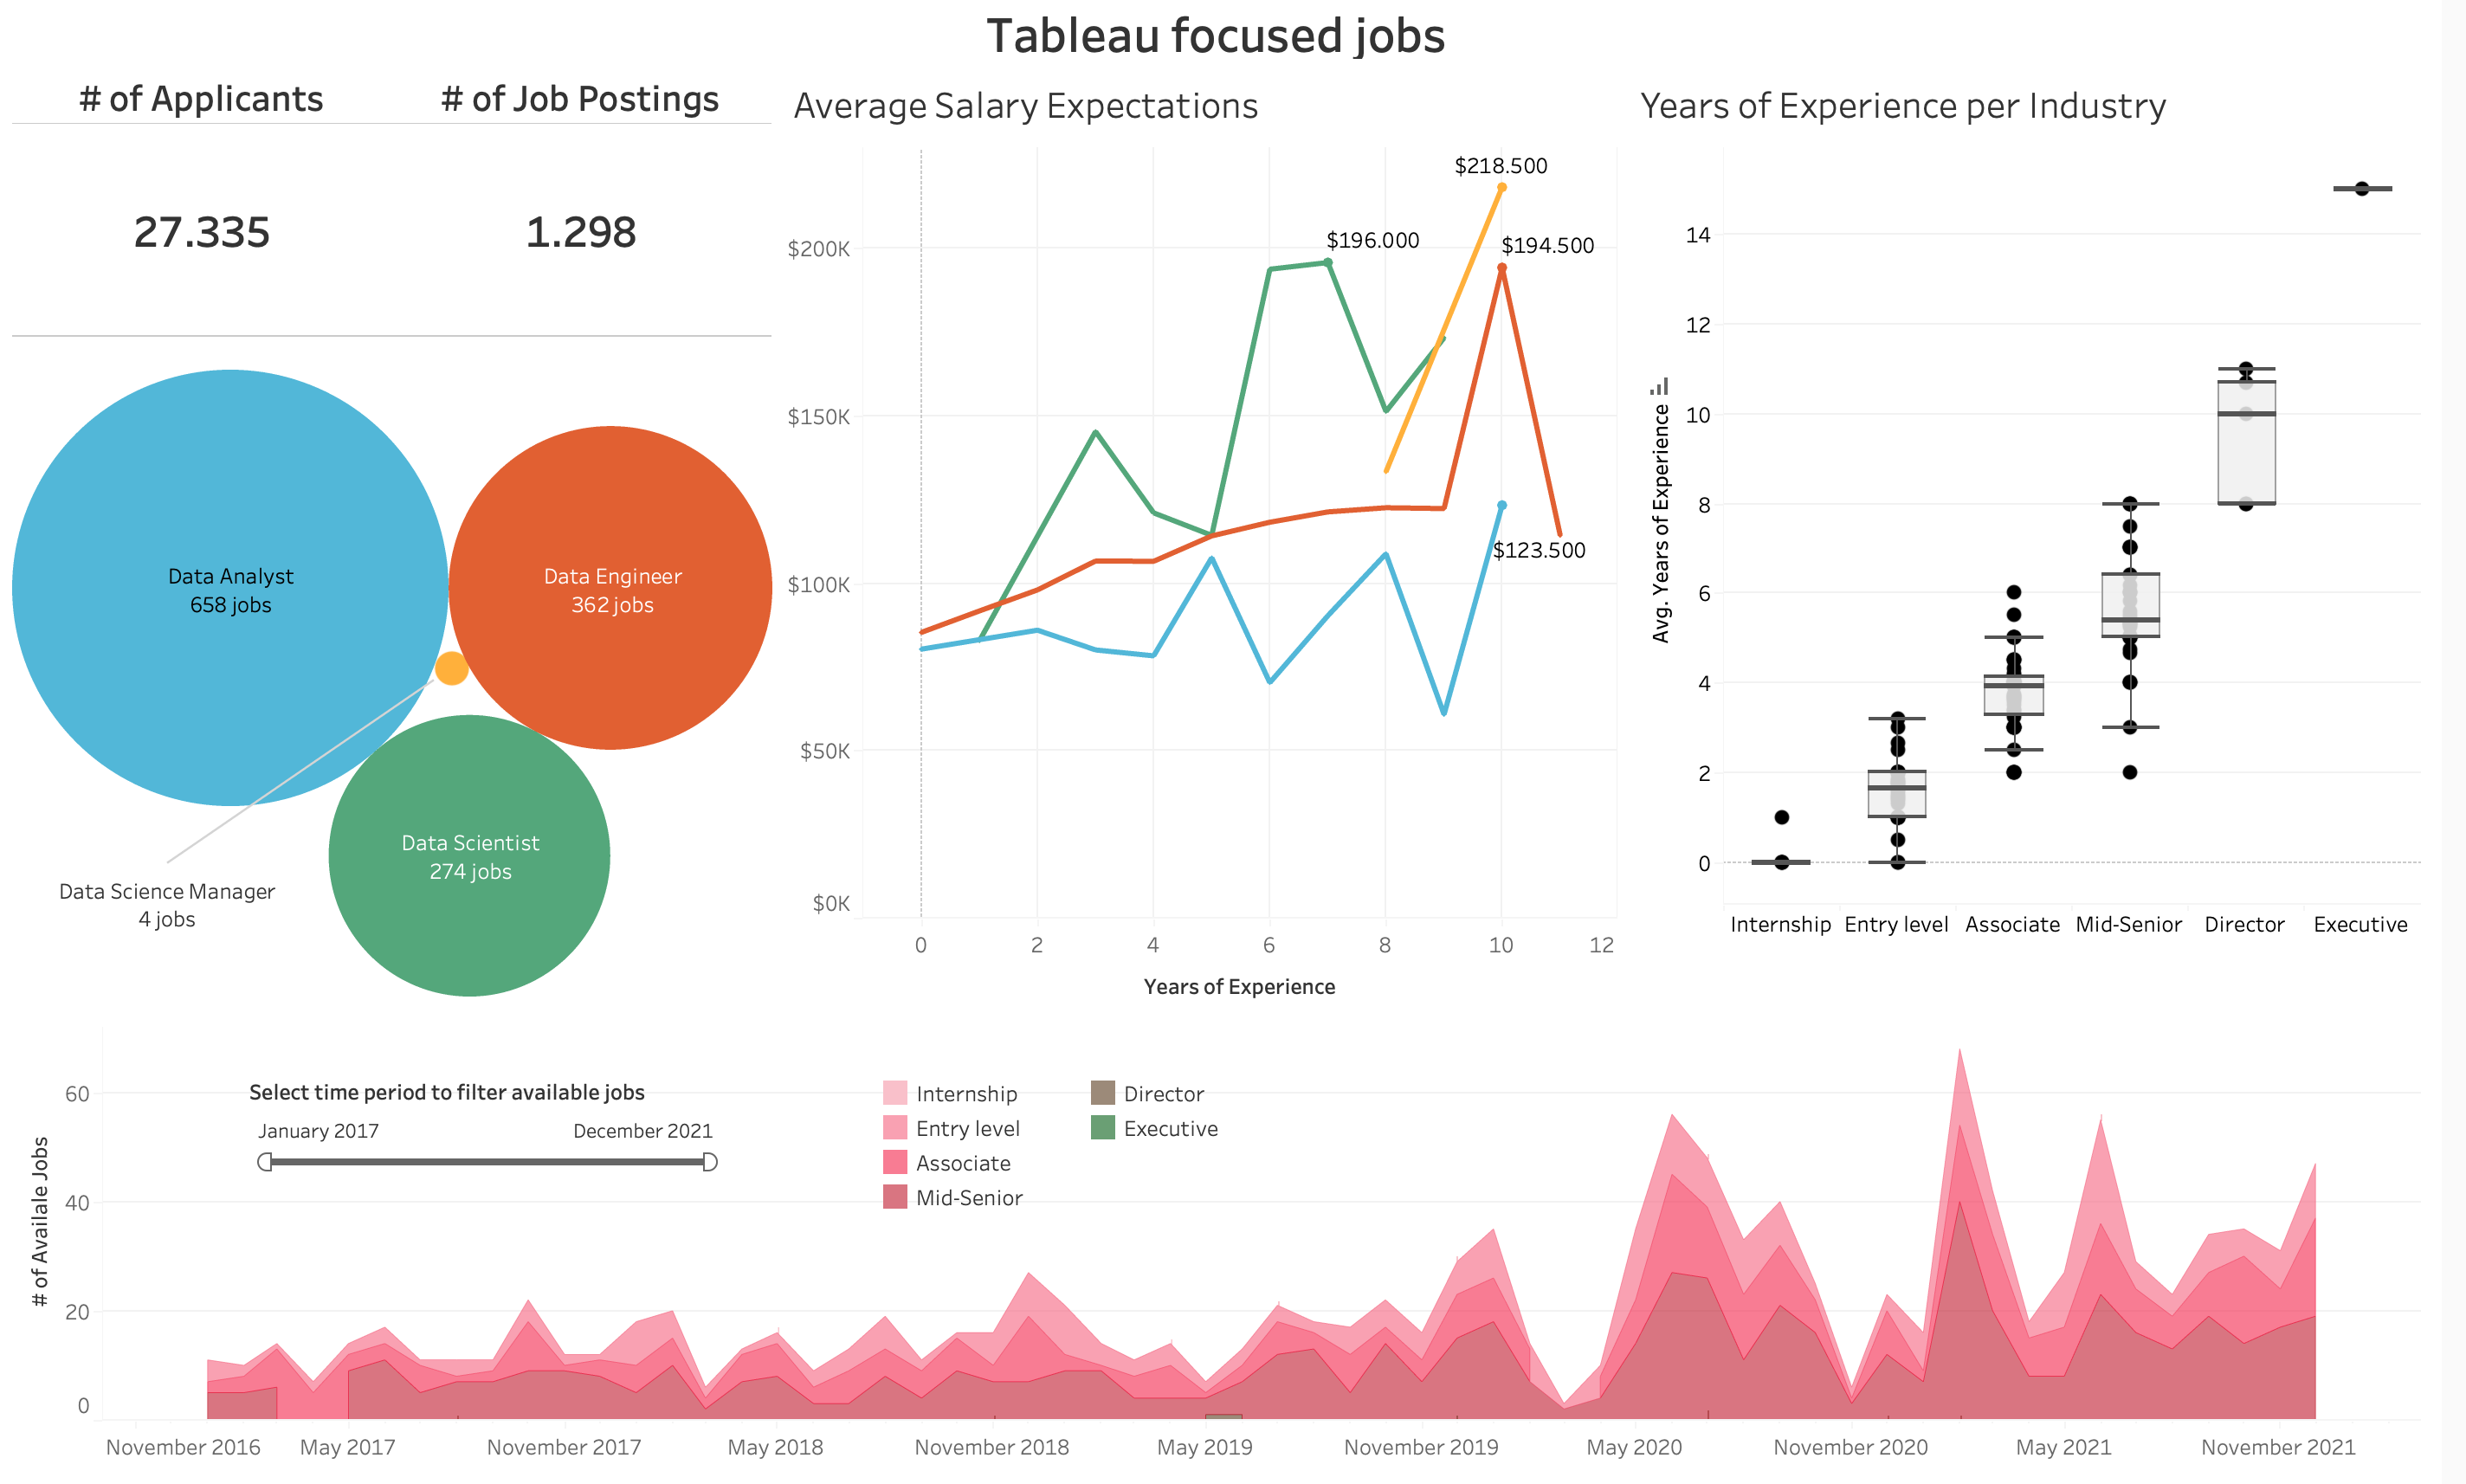
Building job market analysis dashboard
Case Study: Analyzing Job Market Data in Tableau

Shivali Malhotra
Business Analyst and Musician
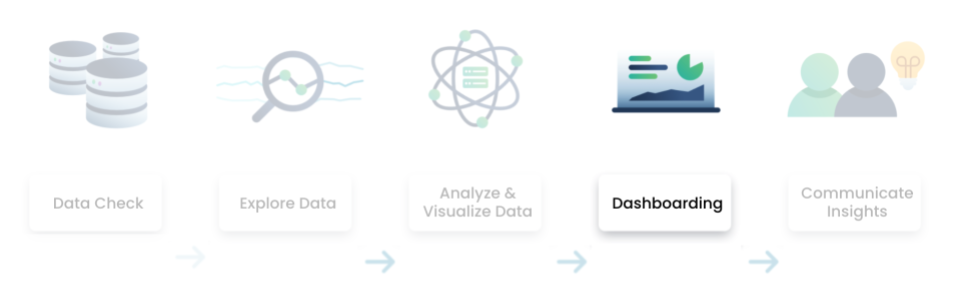
Data analytics process
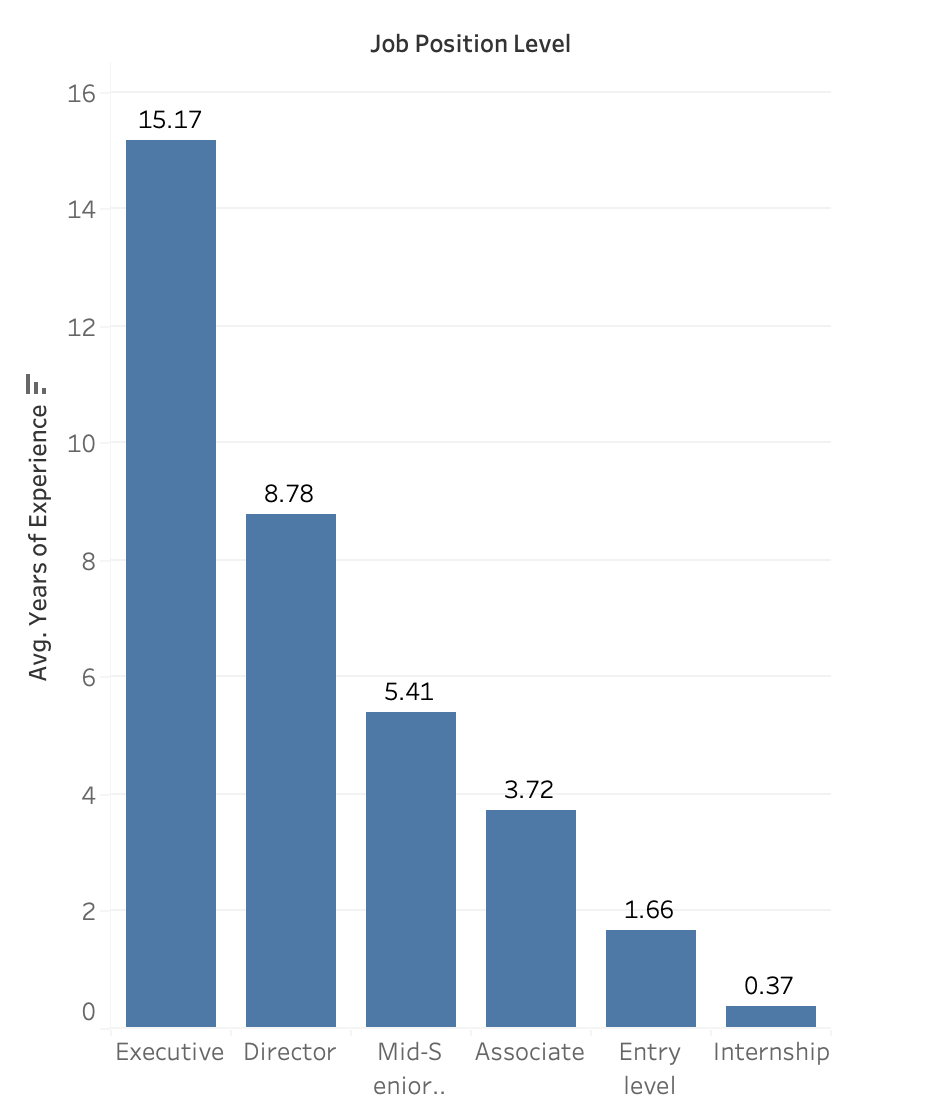
Dashboard focus areas

Dashboard focus areas
Dashboard components to include
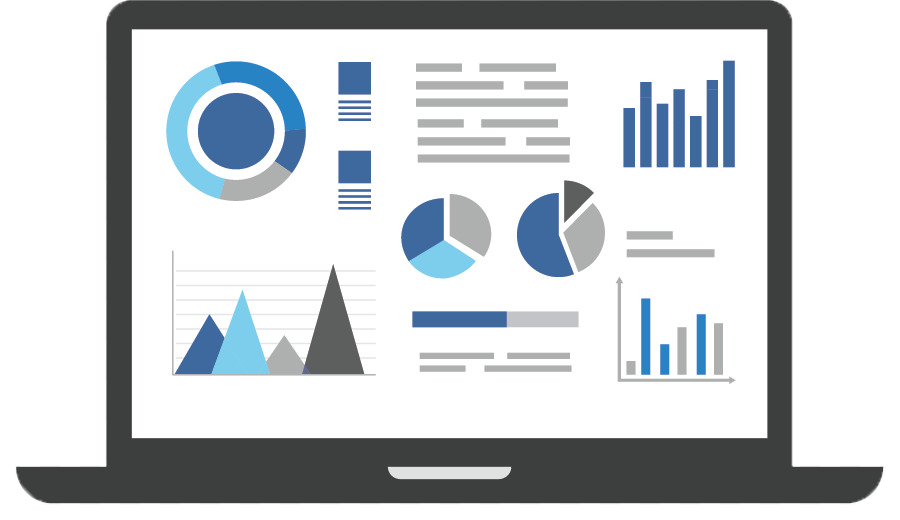
Designing a dashboard
Our final deliverable