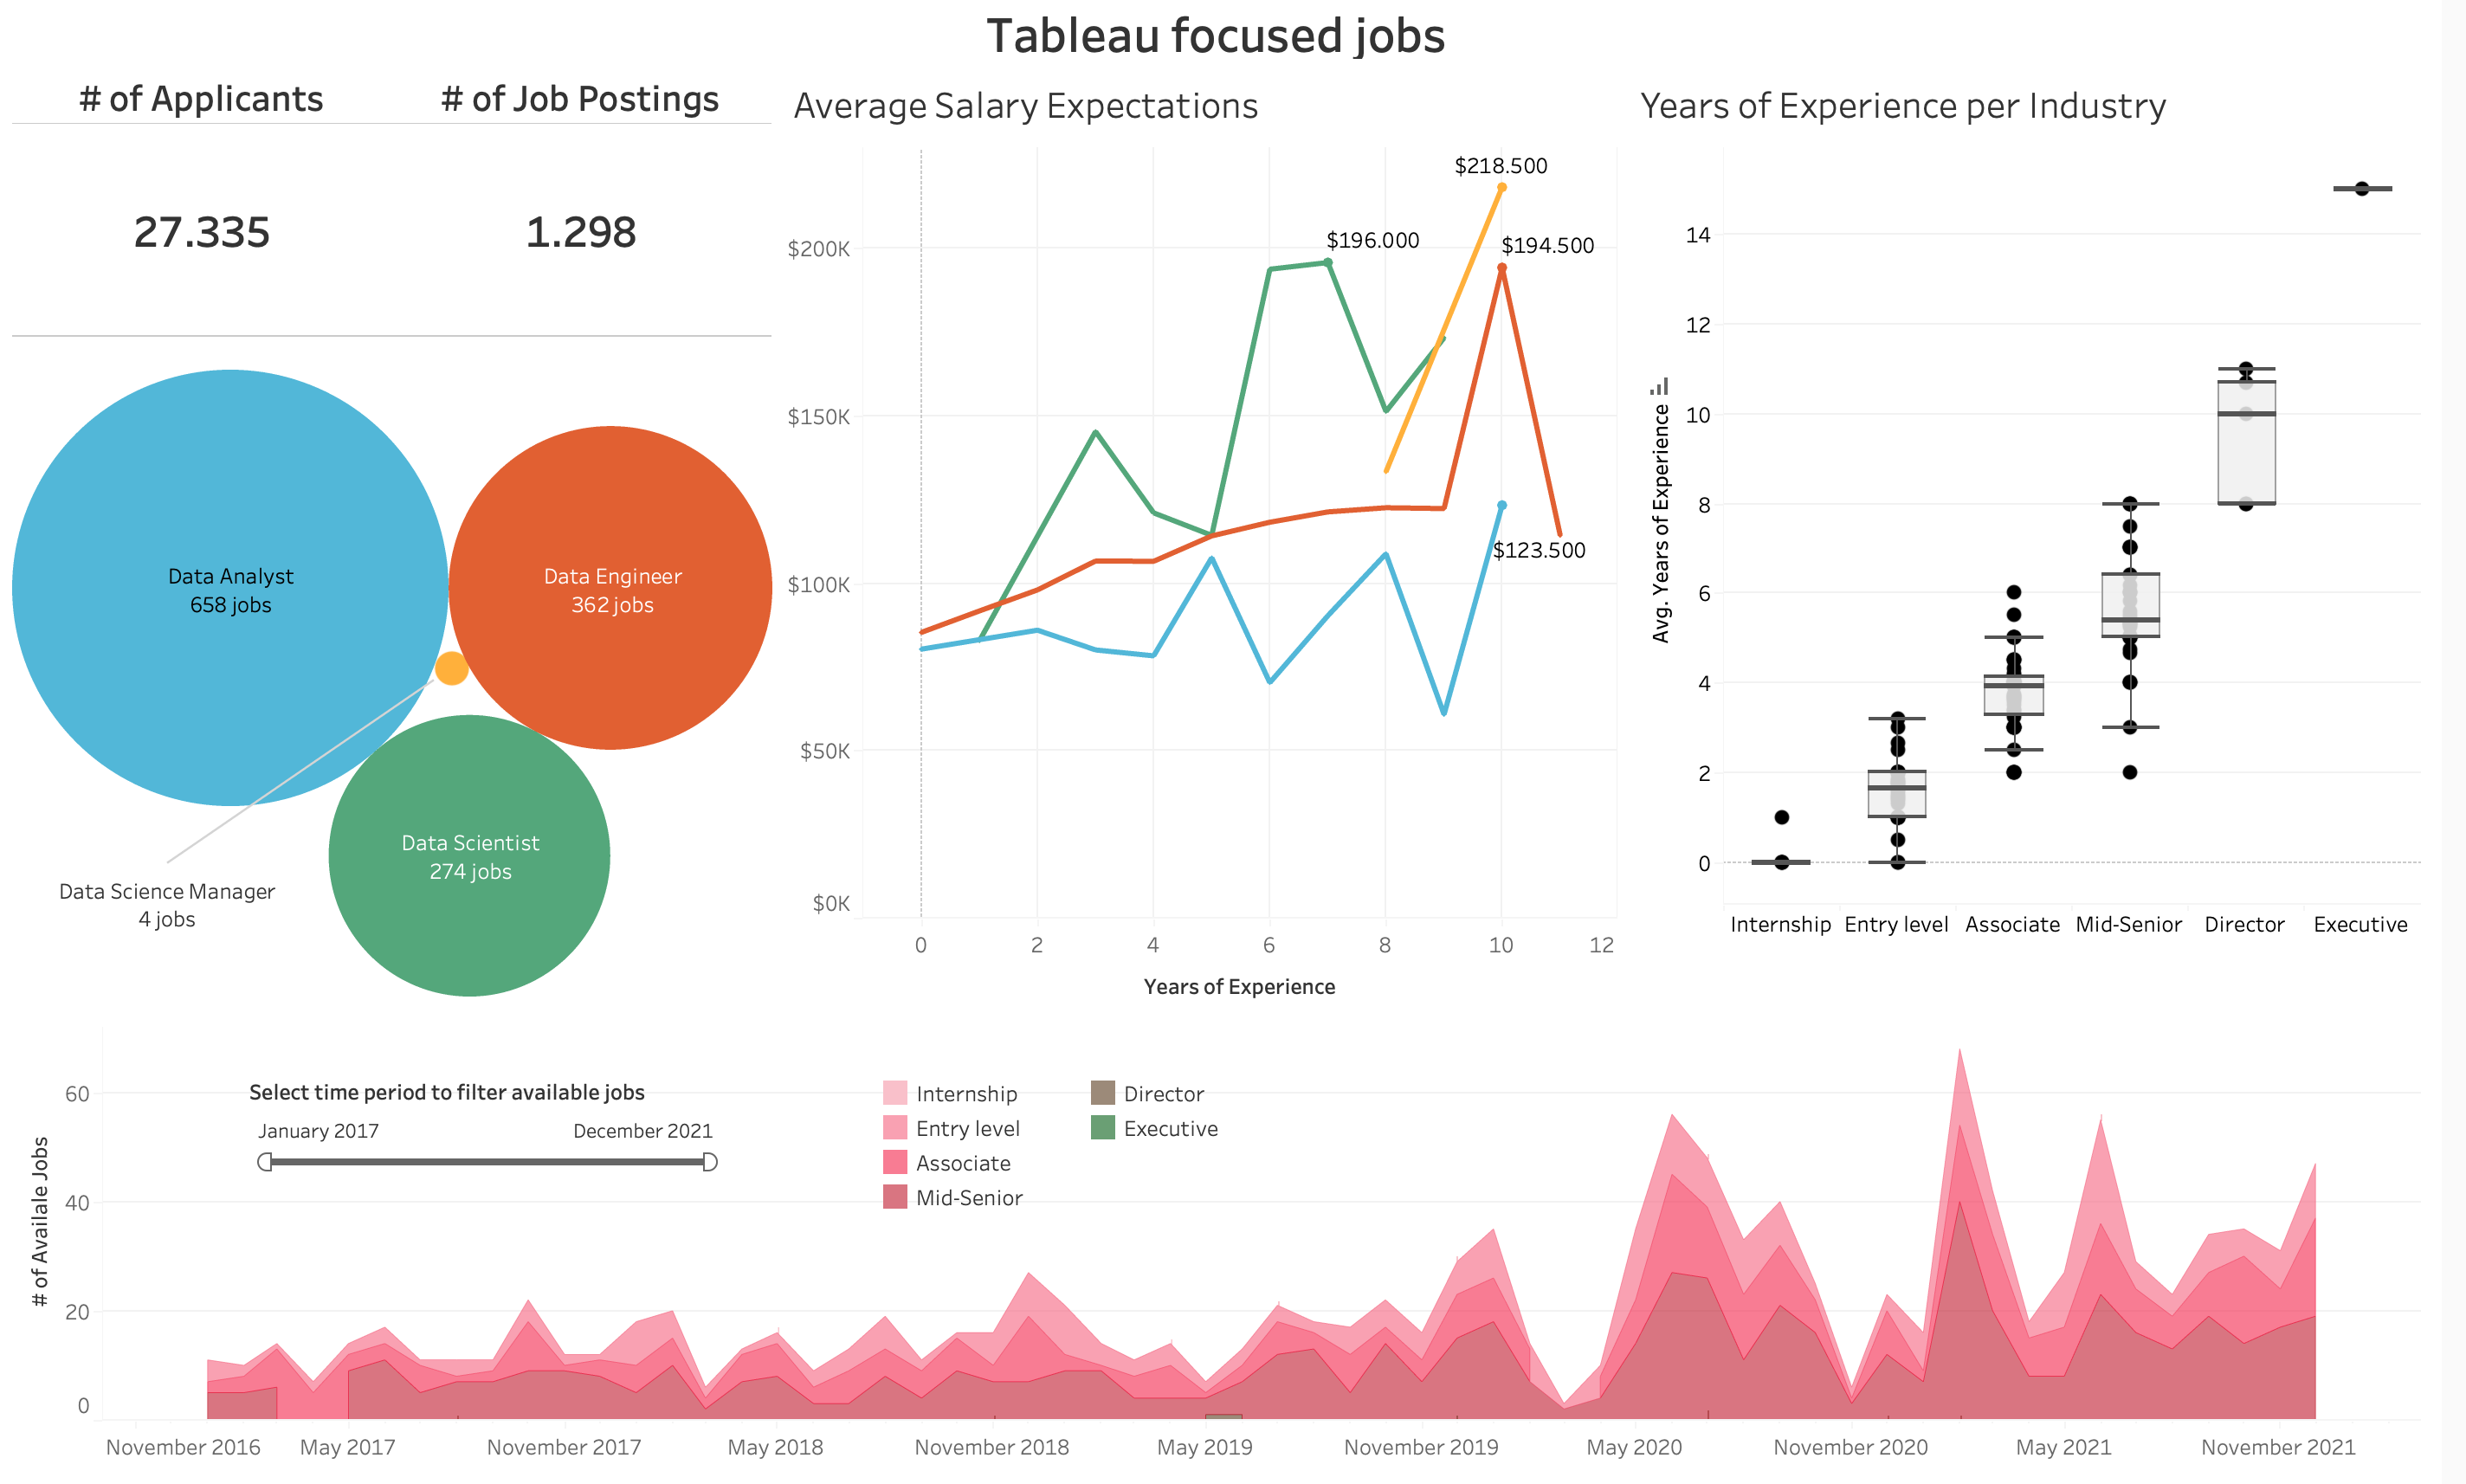
Job market analysis in Tableau
Case Study: Analyzing Job Market Data in Tableau

Shivali Malhotra
Business Analyst and Musician
What is a case study?

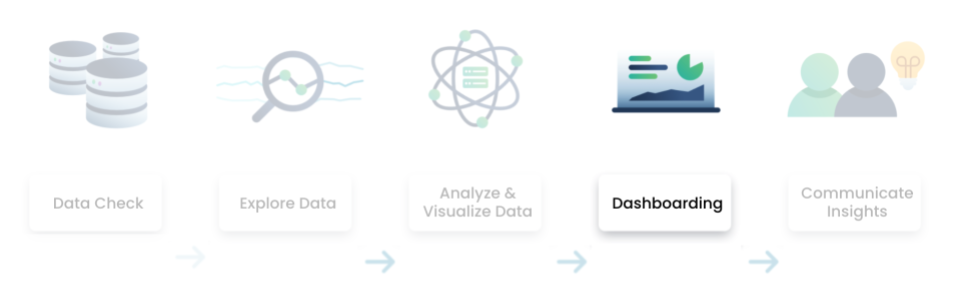
Data analysis process with Tableau
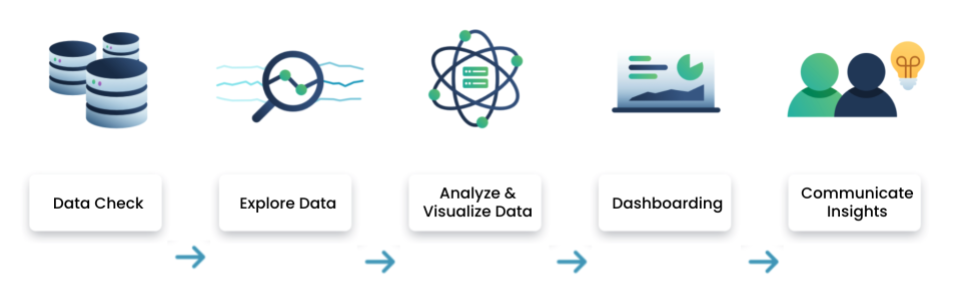
Data analysis process with Tableau
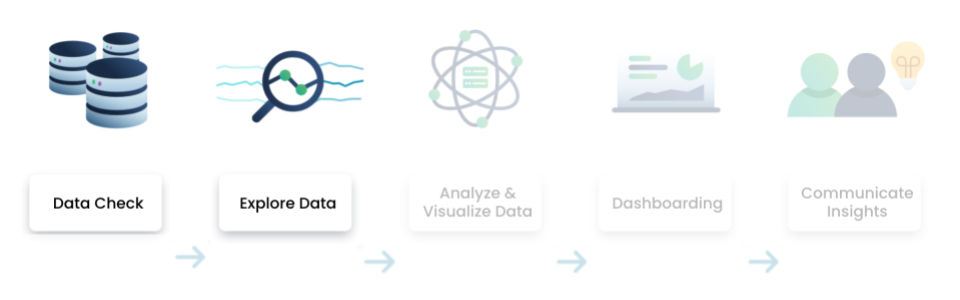
Data analysis process with Tableau
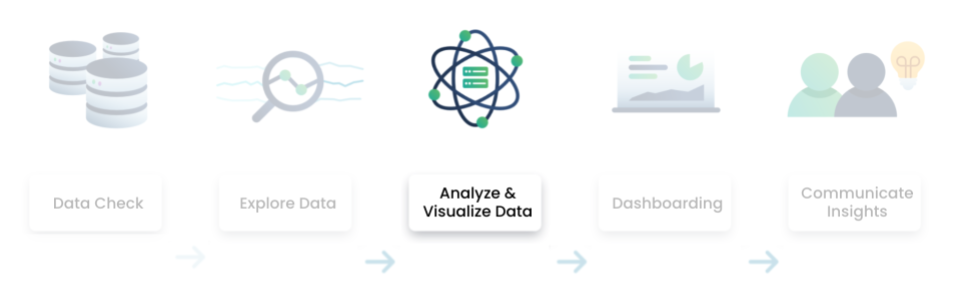
Data analysis process with Tableau
Problem to solve
$$

The data

Final deliverable