Effect size
Foundations of Inference in Python

Paul Savala
Assistant Professor of Mathematics
What is effect size?

- Effect size: Measure of strength between two variables

Why measure effect size
- Measures strength of relationship
- Smoking: Large effect size
- Poor diet: Small effect size
P-Values
- Does a relationship exist?
- Comes from hypothesis test
Effect size
- How strong is the relationship?
- Separate from a hypothesis test
Effect size for means - Cohen's d
$n_1 = \text{Sample size of group one}$
$n_2 = \text{Sample size of group two}$
$s_1 = \text{Standard deviation of group one}$
$s_2 = \text{Standard deviation of group two}$
$\overline{x}_1 = \text{Mean of group one}$
$\overline{x}_2 = \text{Mean of group two}$
$s = \displaystyle\sqrt{\frac{(n_1-1)s_1^2 + (n_2-1)s_2^2}{n_1 + n_2 - 2}}$
Cohen's $d = \displaystyle\frac{\overline{x}_1 - \overline{x}_2}{s}$
Interpreting Cohen's d
- 0.01 - Very small
- 0.20 - Small
- 0.50 - Medium
- 0.80 - Large
- 1.20 - Very large
Cohen's $d = 0.6$
Medium-to-large effect size
1 https://books.google.com/books?id=2v9zDAsLvA0C&pg=PP1 https://doi.org/10.22237%2Fjmasm%2F1257035100
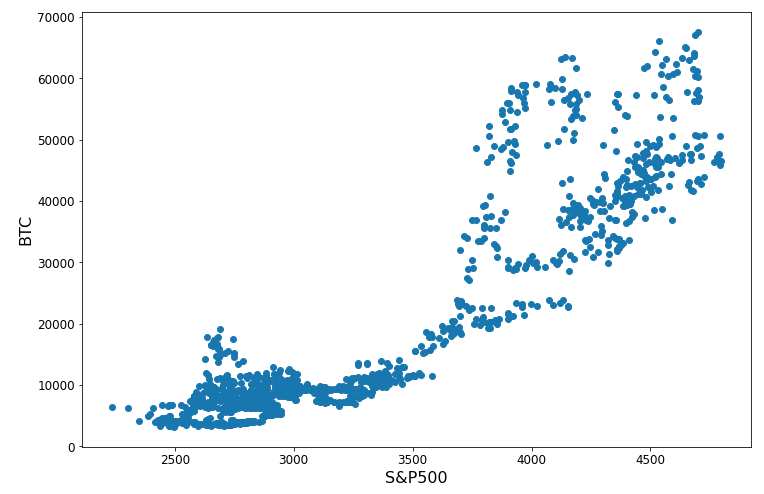
Effect size for correlation
r, p_value = stats.pearsonr( btc_sp_df['Close_BTC'], btc_sp_df['Close_SP500'] )print(r**2)
0.82
$R^2:$ Percent of variation in one variable explained by knowing the other

Effect size for categorical variables
- $\chi^2$ = Chi-squared statistic from contingency table
- $n$ = total number of data points
- $d$ = degrees of freedom = $min(\text{rows}-1, \text{cols}-1)$
Cramer's $V = \displaystyle\sqrt{\frac{\chi^2/n}{d}}$
Calculating Cramer's V
chi2, p, d, e = stats.chi2_contingency( contingency_table)dof = min(6-1, 2-1) = 1 n = 3394v = np.sqrt((chi2 / n) / dof)
v = 0.52

1 https://en.wikipedia.org/wiki/Degrees_of_freedom_(statistics)
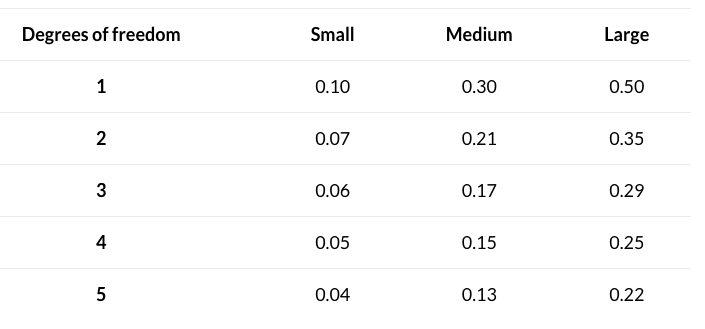
Interpreting Cramer's V
Cramer's V = 0.52, Degrees of Freedom = 1

1 https://www.statology.org/interpret-cramers-v
Let's practice!
Foundations of Inference in Python

