Fitted values and residuals
Forecasting in R

Rob J. Hyndman
Professor of Statistics at Monash University
Example: oil production
fc <- naive(oil)
autoplot(oil, series = "Data") + xlab("Year") +
  autolayer(fitted(fc), series = "Fitted") +
  ggtitle("Oil production in Saudi Arabia")
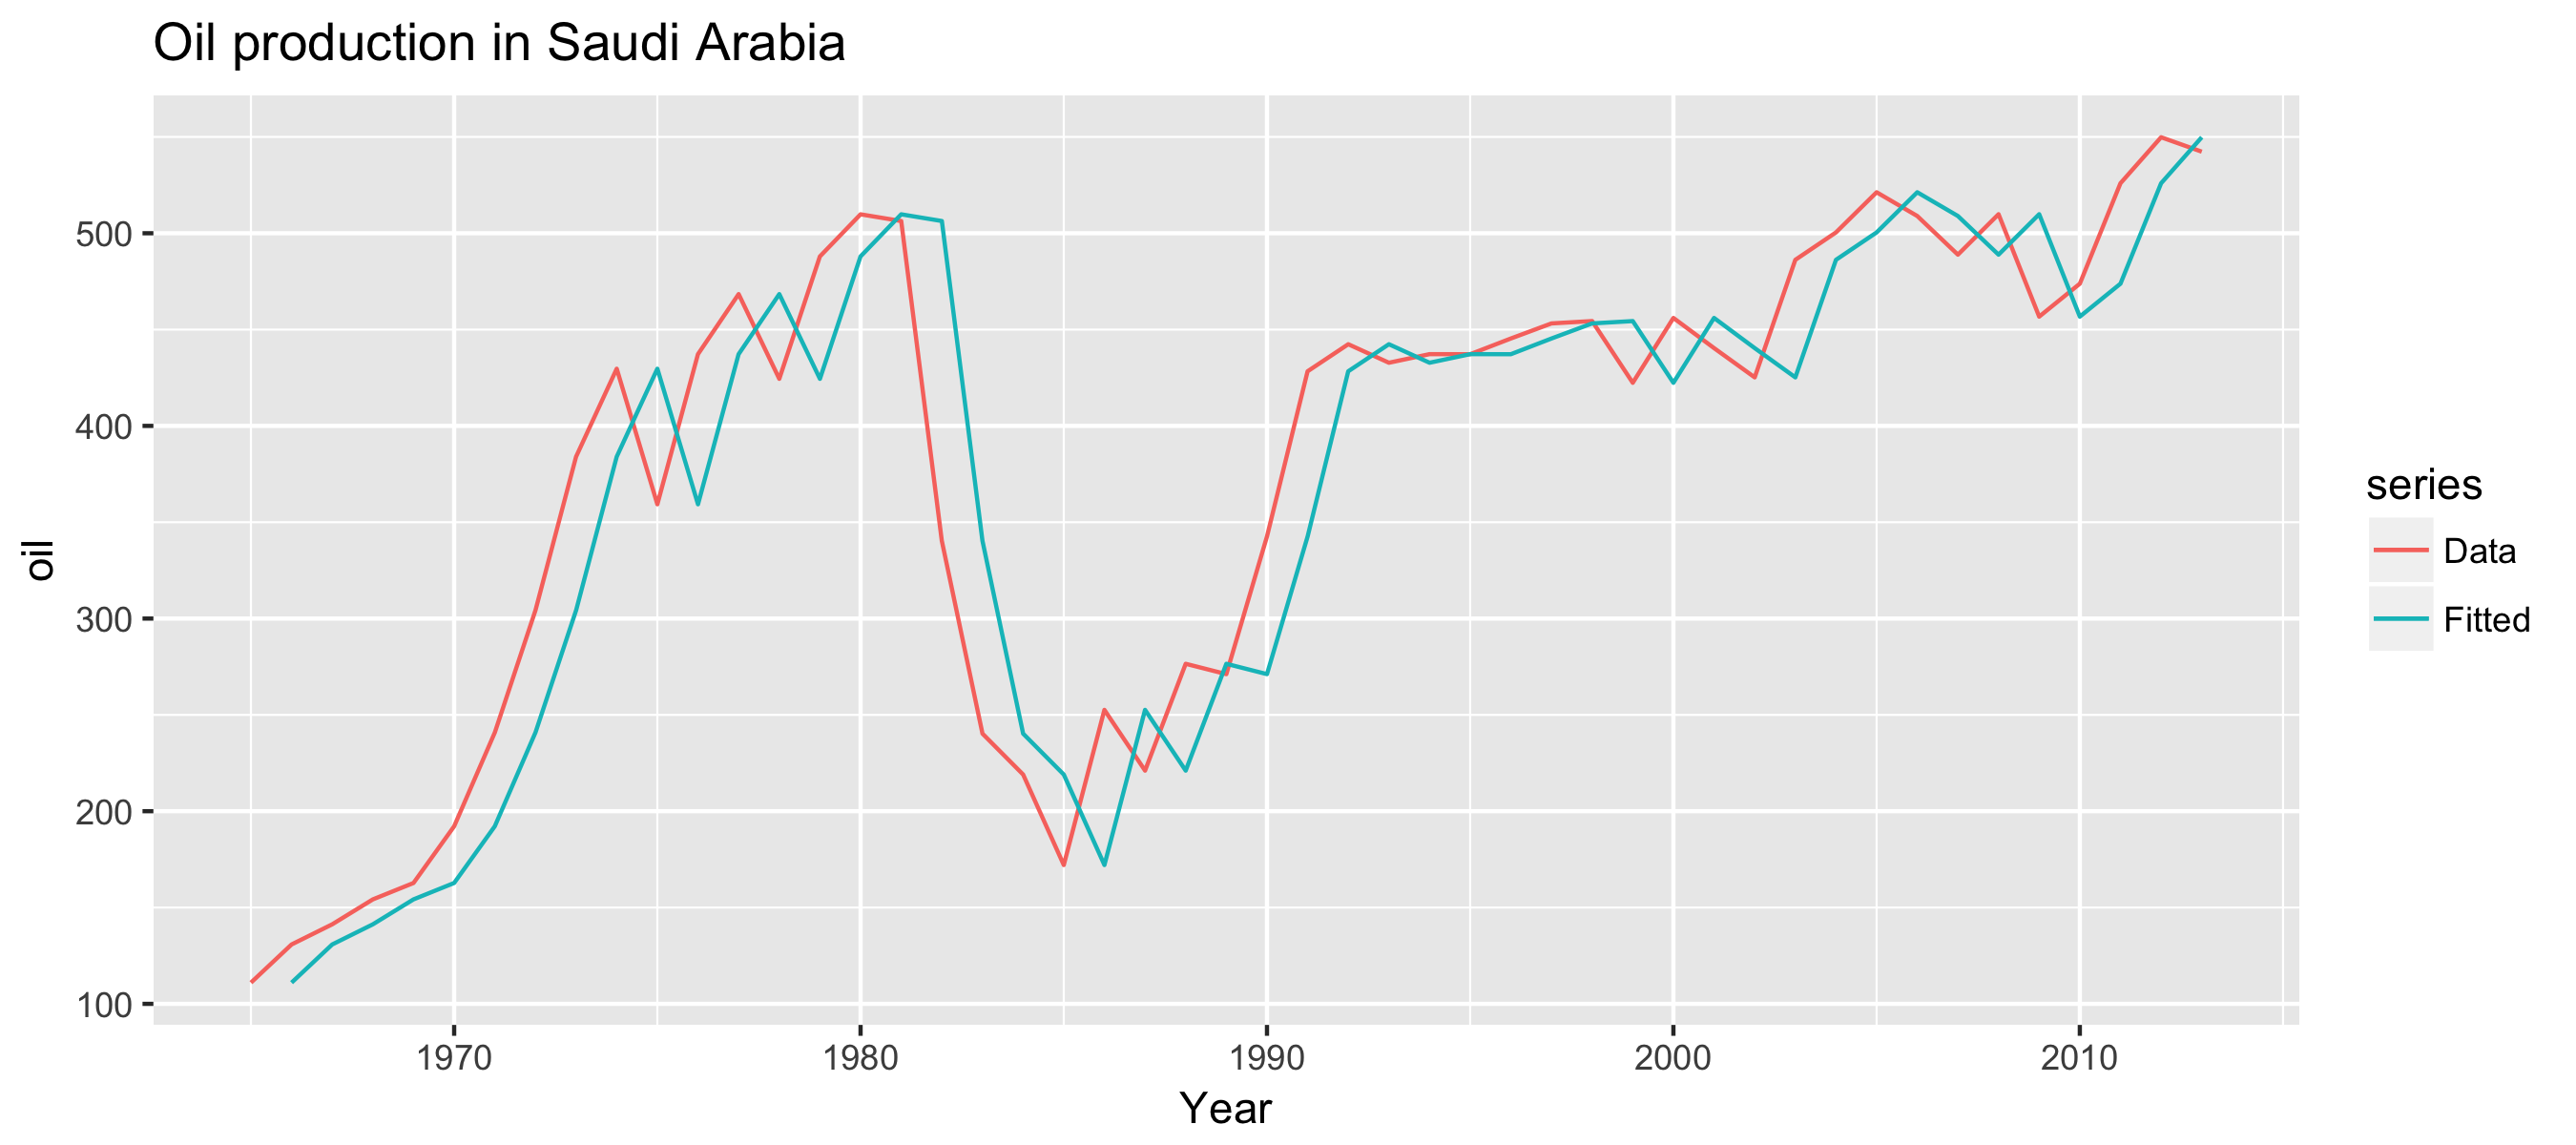
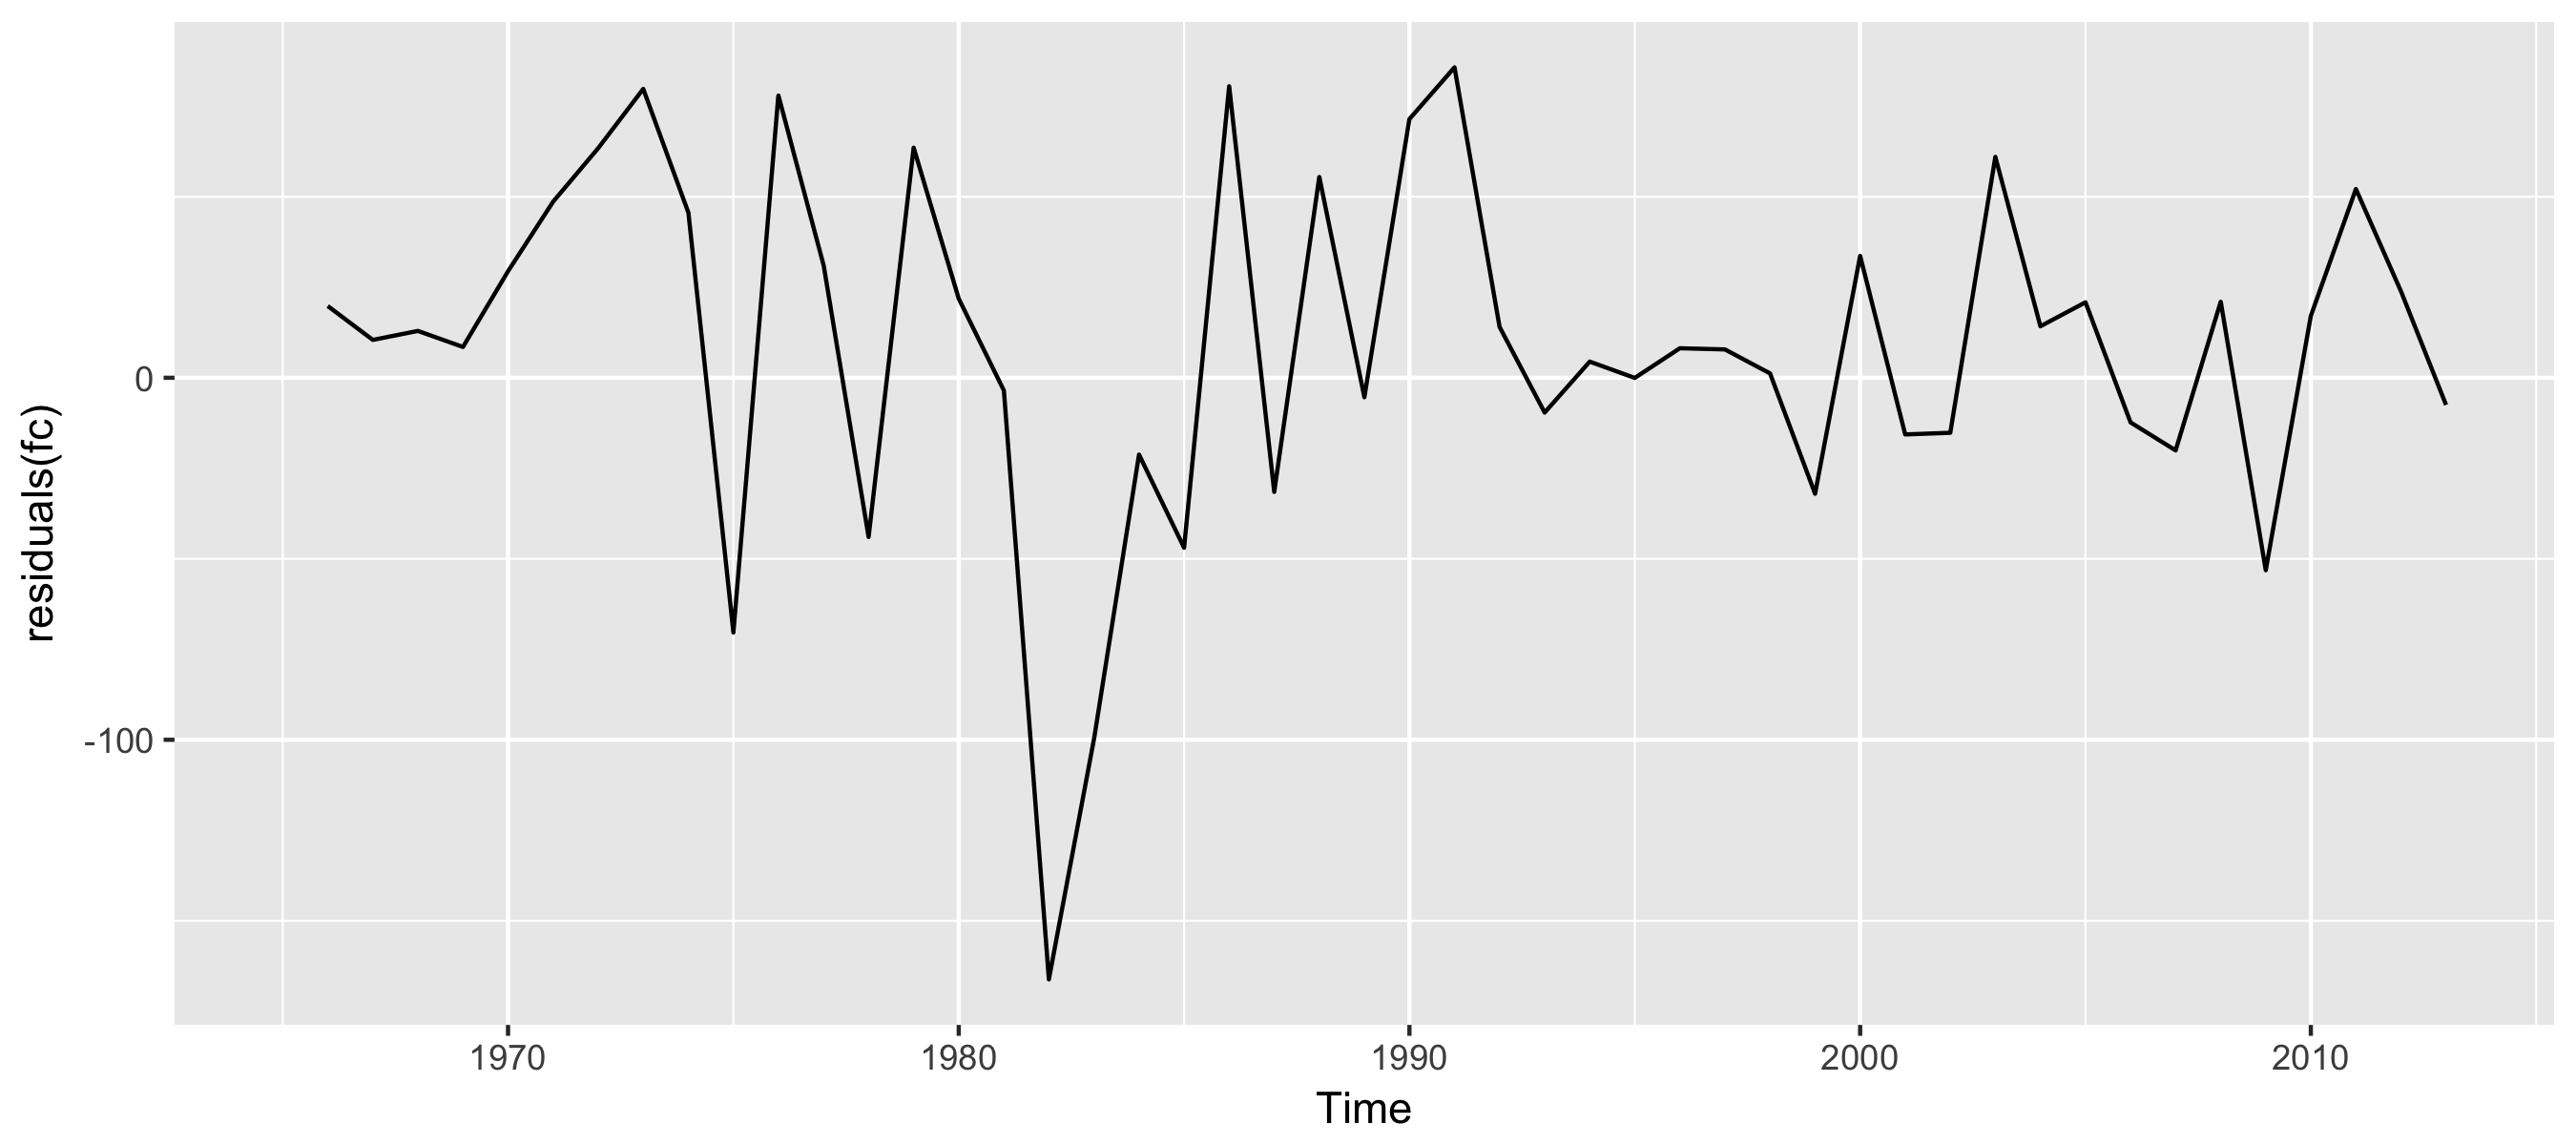
Example: oil production
autoplot(residuals(fc))
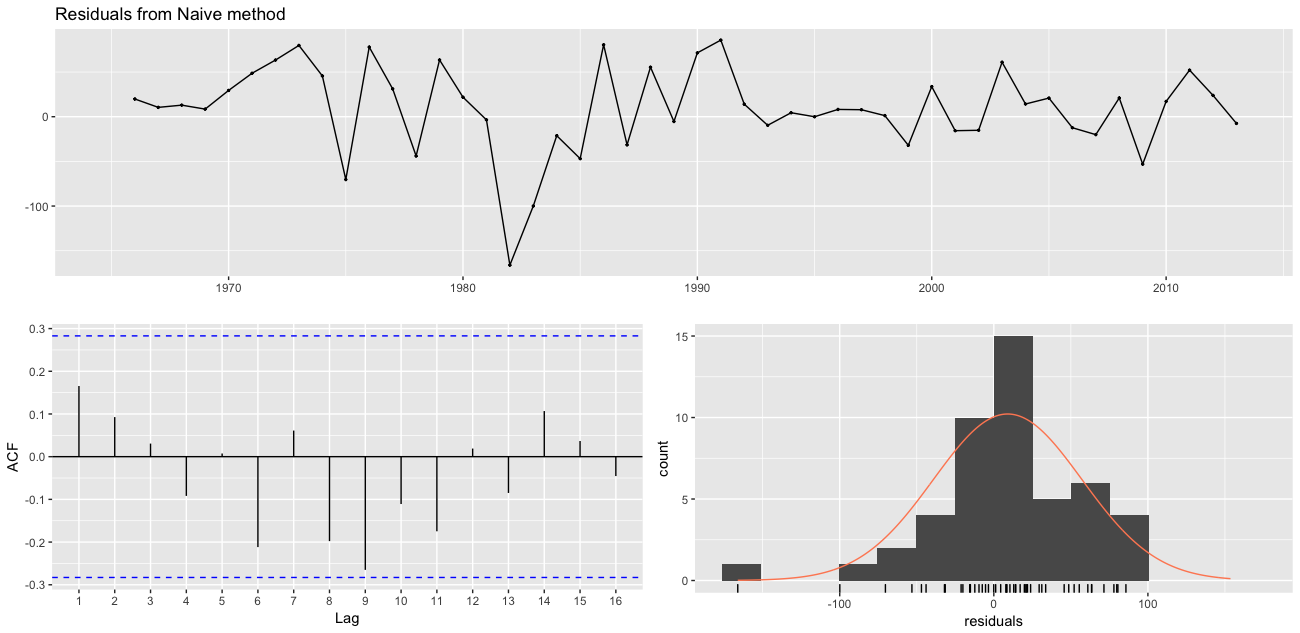
checkresiduals()
checkresiduals(fc)
    Ljung-Box test
data:  residuals
Q* = 12.59, df = 10, p-value = 0.2475
Model df: 0.   Total lags used: 10