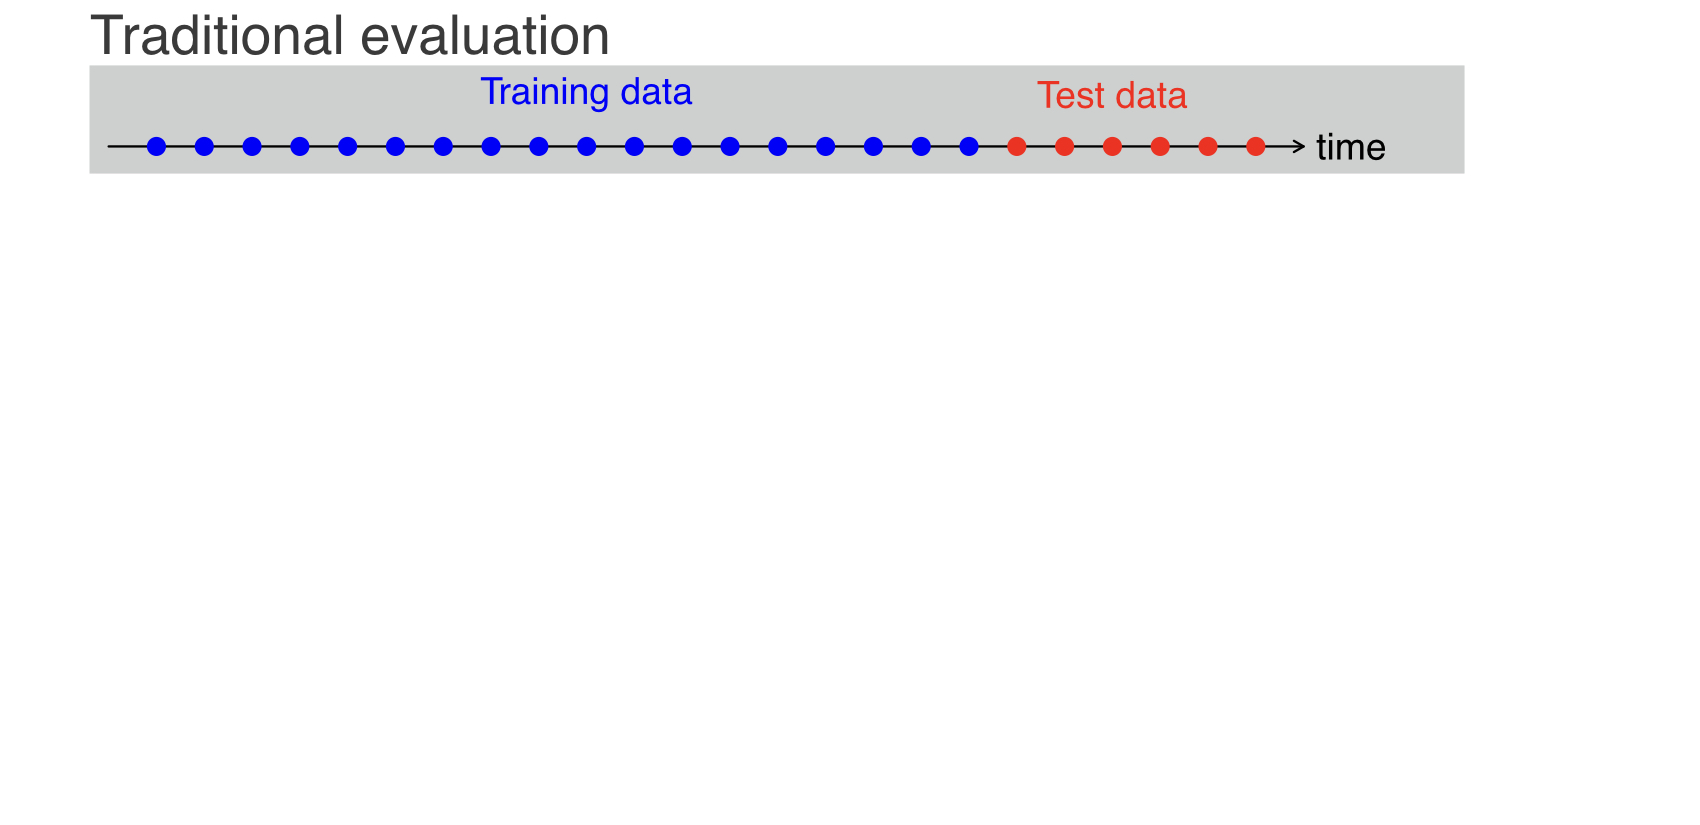
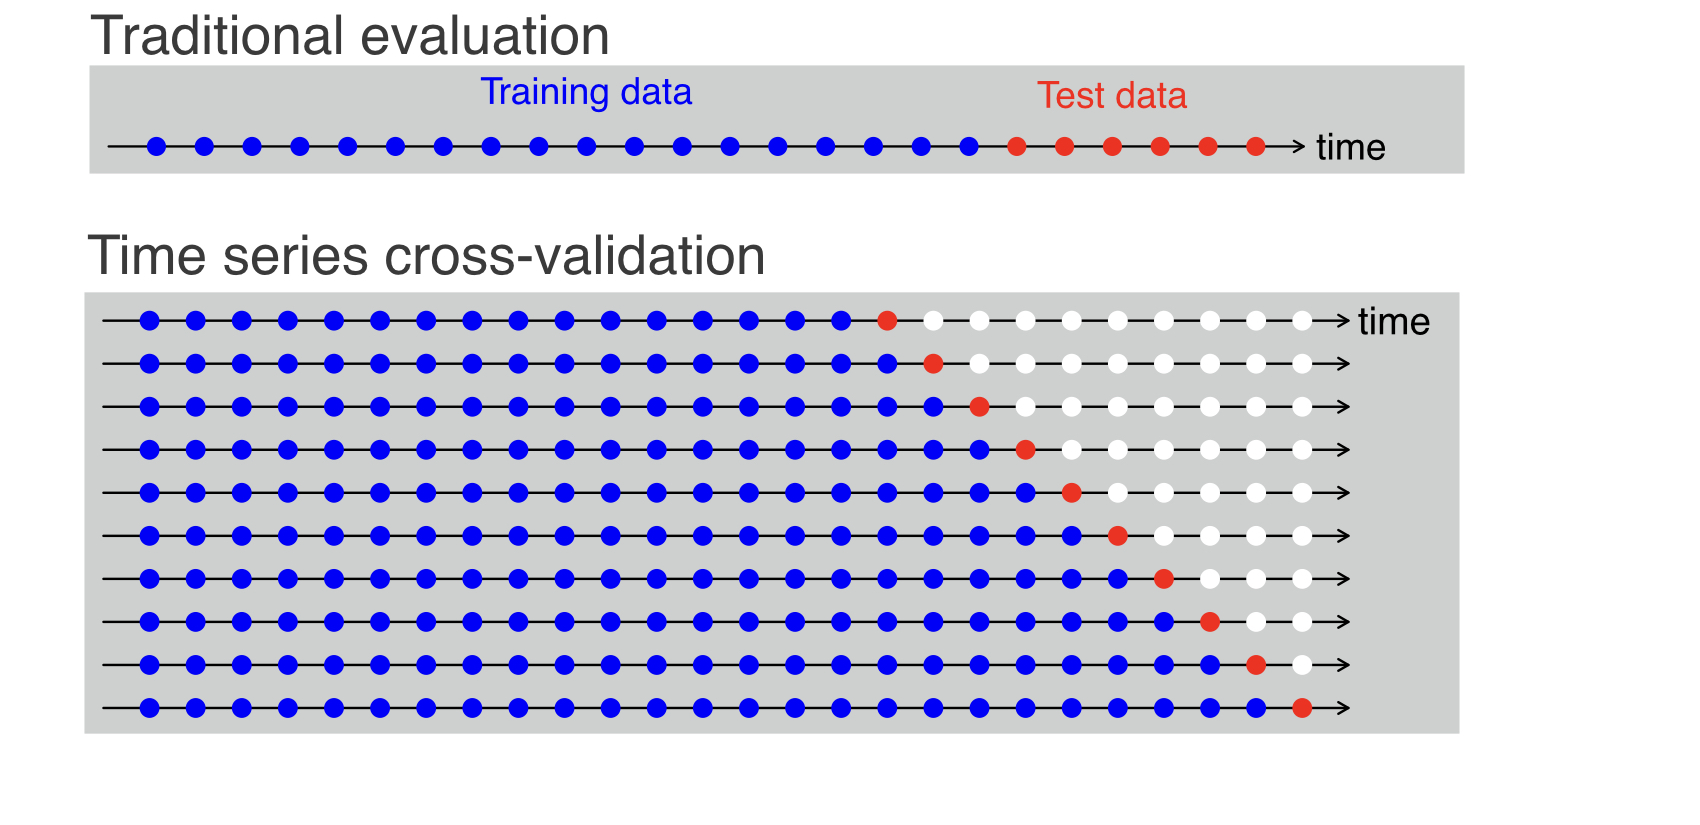
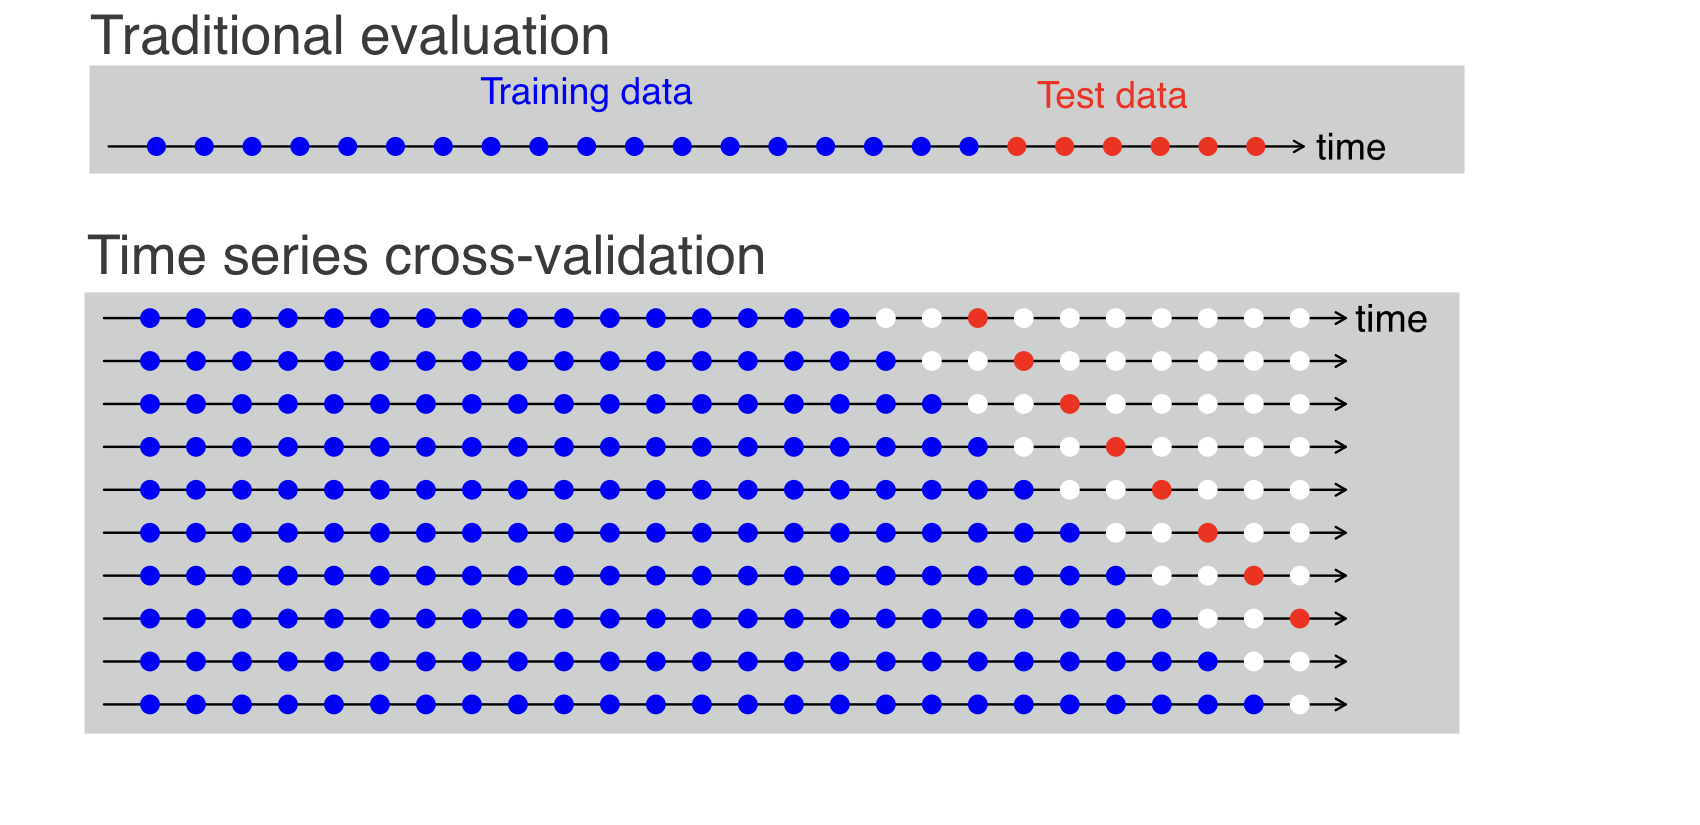
Time series cross-validation
Forecasting in R

Rob J. Hyndman
Professor of Statistics at Monash University
Time series cross-validation
Time series cross-validation
Time series cross-validation

Time series cross-validation
Forecasting in R
Rob J. Hyndman
Professor of Statistics at Monash University

