Training and test sets
Forecasting in R

Rob J. Hyndman
Professor of Statistics at Monash University
Training and test sets

Training and test sets
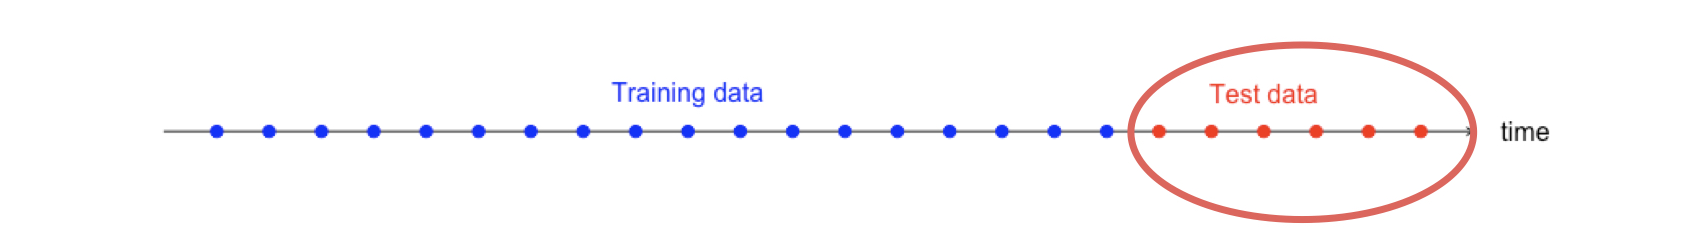
Training and test sets
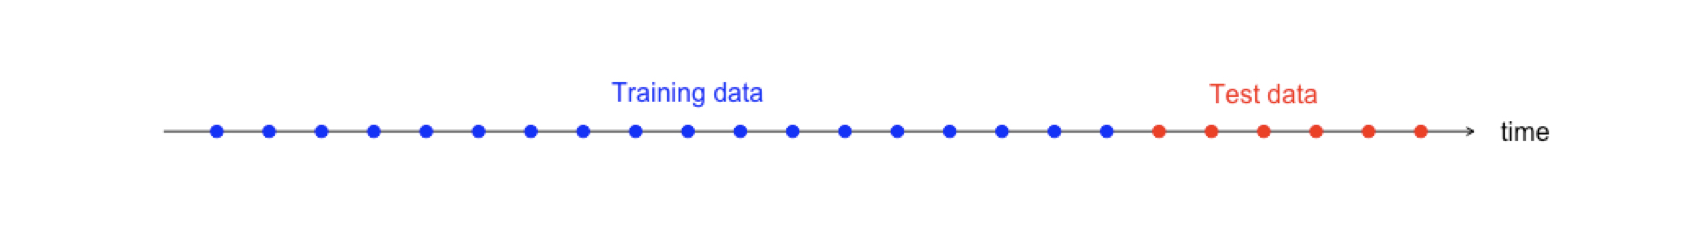
- The test set must not be used for any aspect of calculating forecasts
- Build forecasts using training set
- A model which fits the training data well will not necessarily forecast well
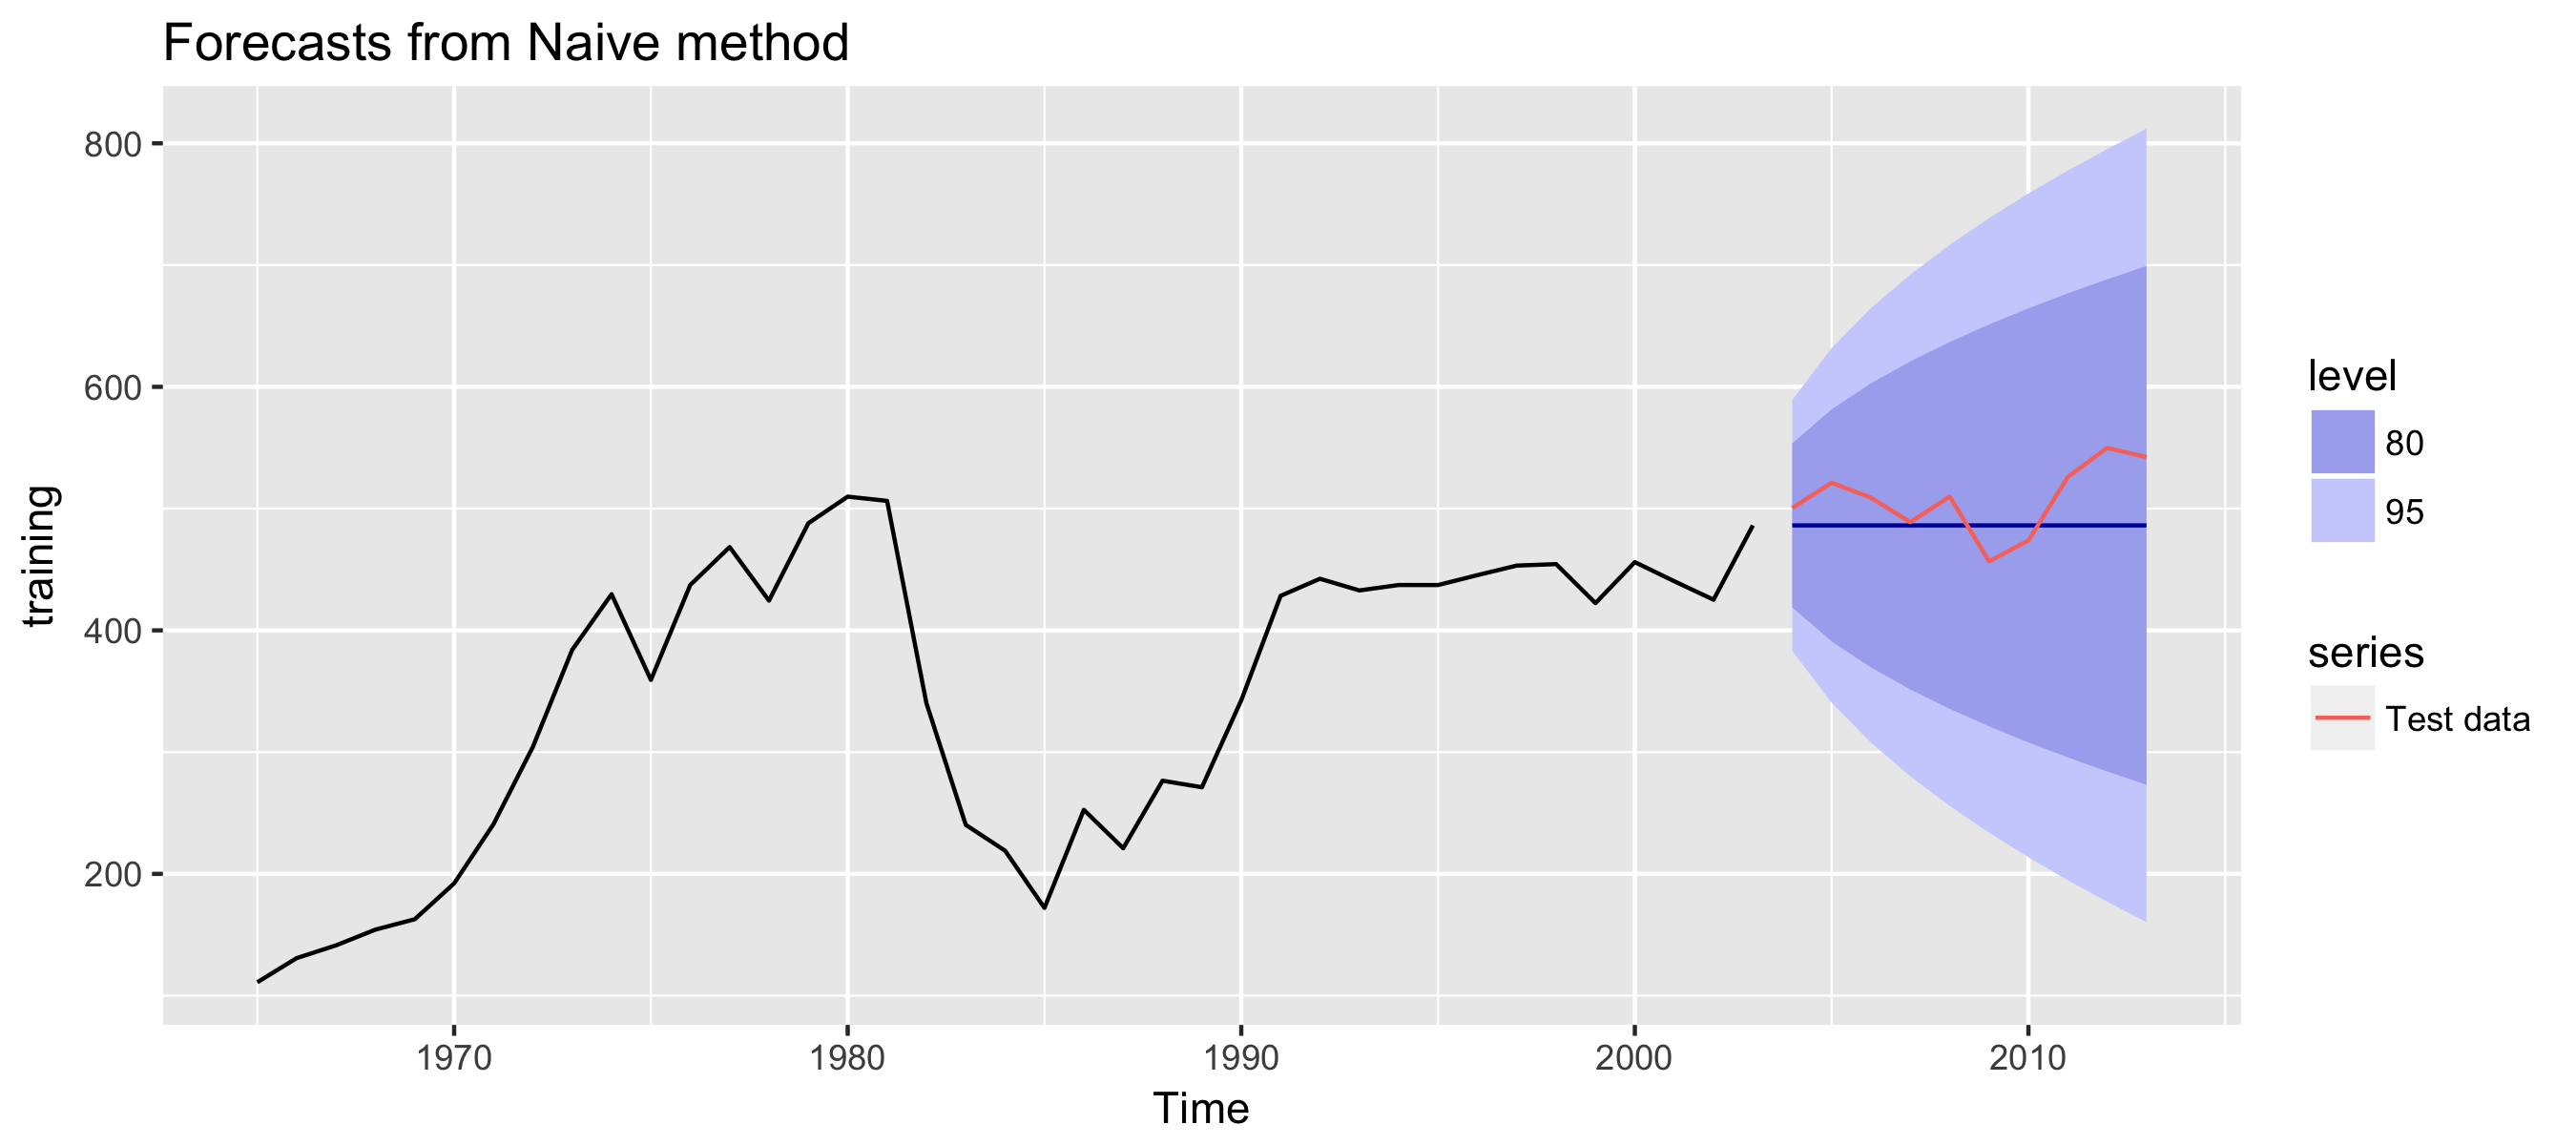
Example: Saudi Arabian oil production
training <- window(oil, end = 2003)
test <- window(oil, start = 2004)
fc <- naive(training, h = 10)
autoplot(fc) + autolayer(test, series = "Test data")