Operational dashboard
Dashboard Design Concepts

Olga Scrivner, PhD
President, Scrivner Solutions Inc
Dashboard taxonomies
1 Few, Stephen. (2006). Information dashboard design.
Business roles taxonomy

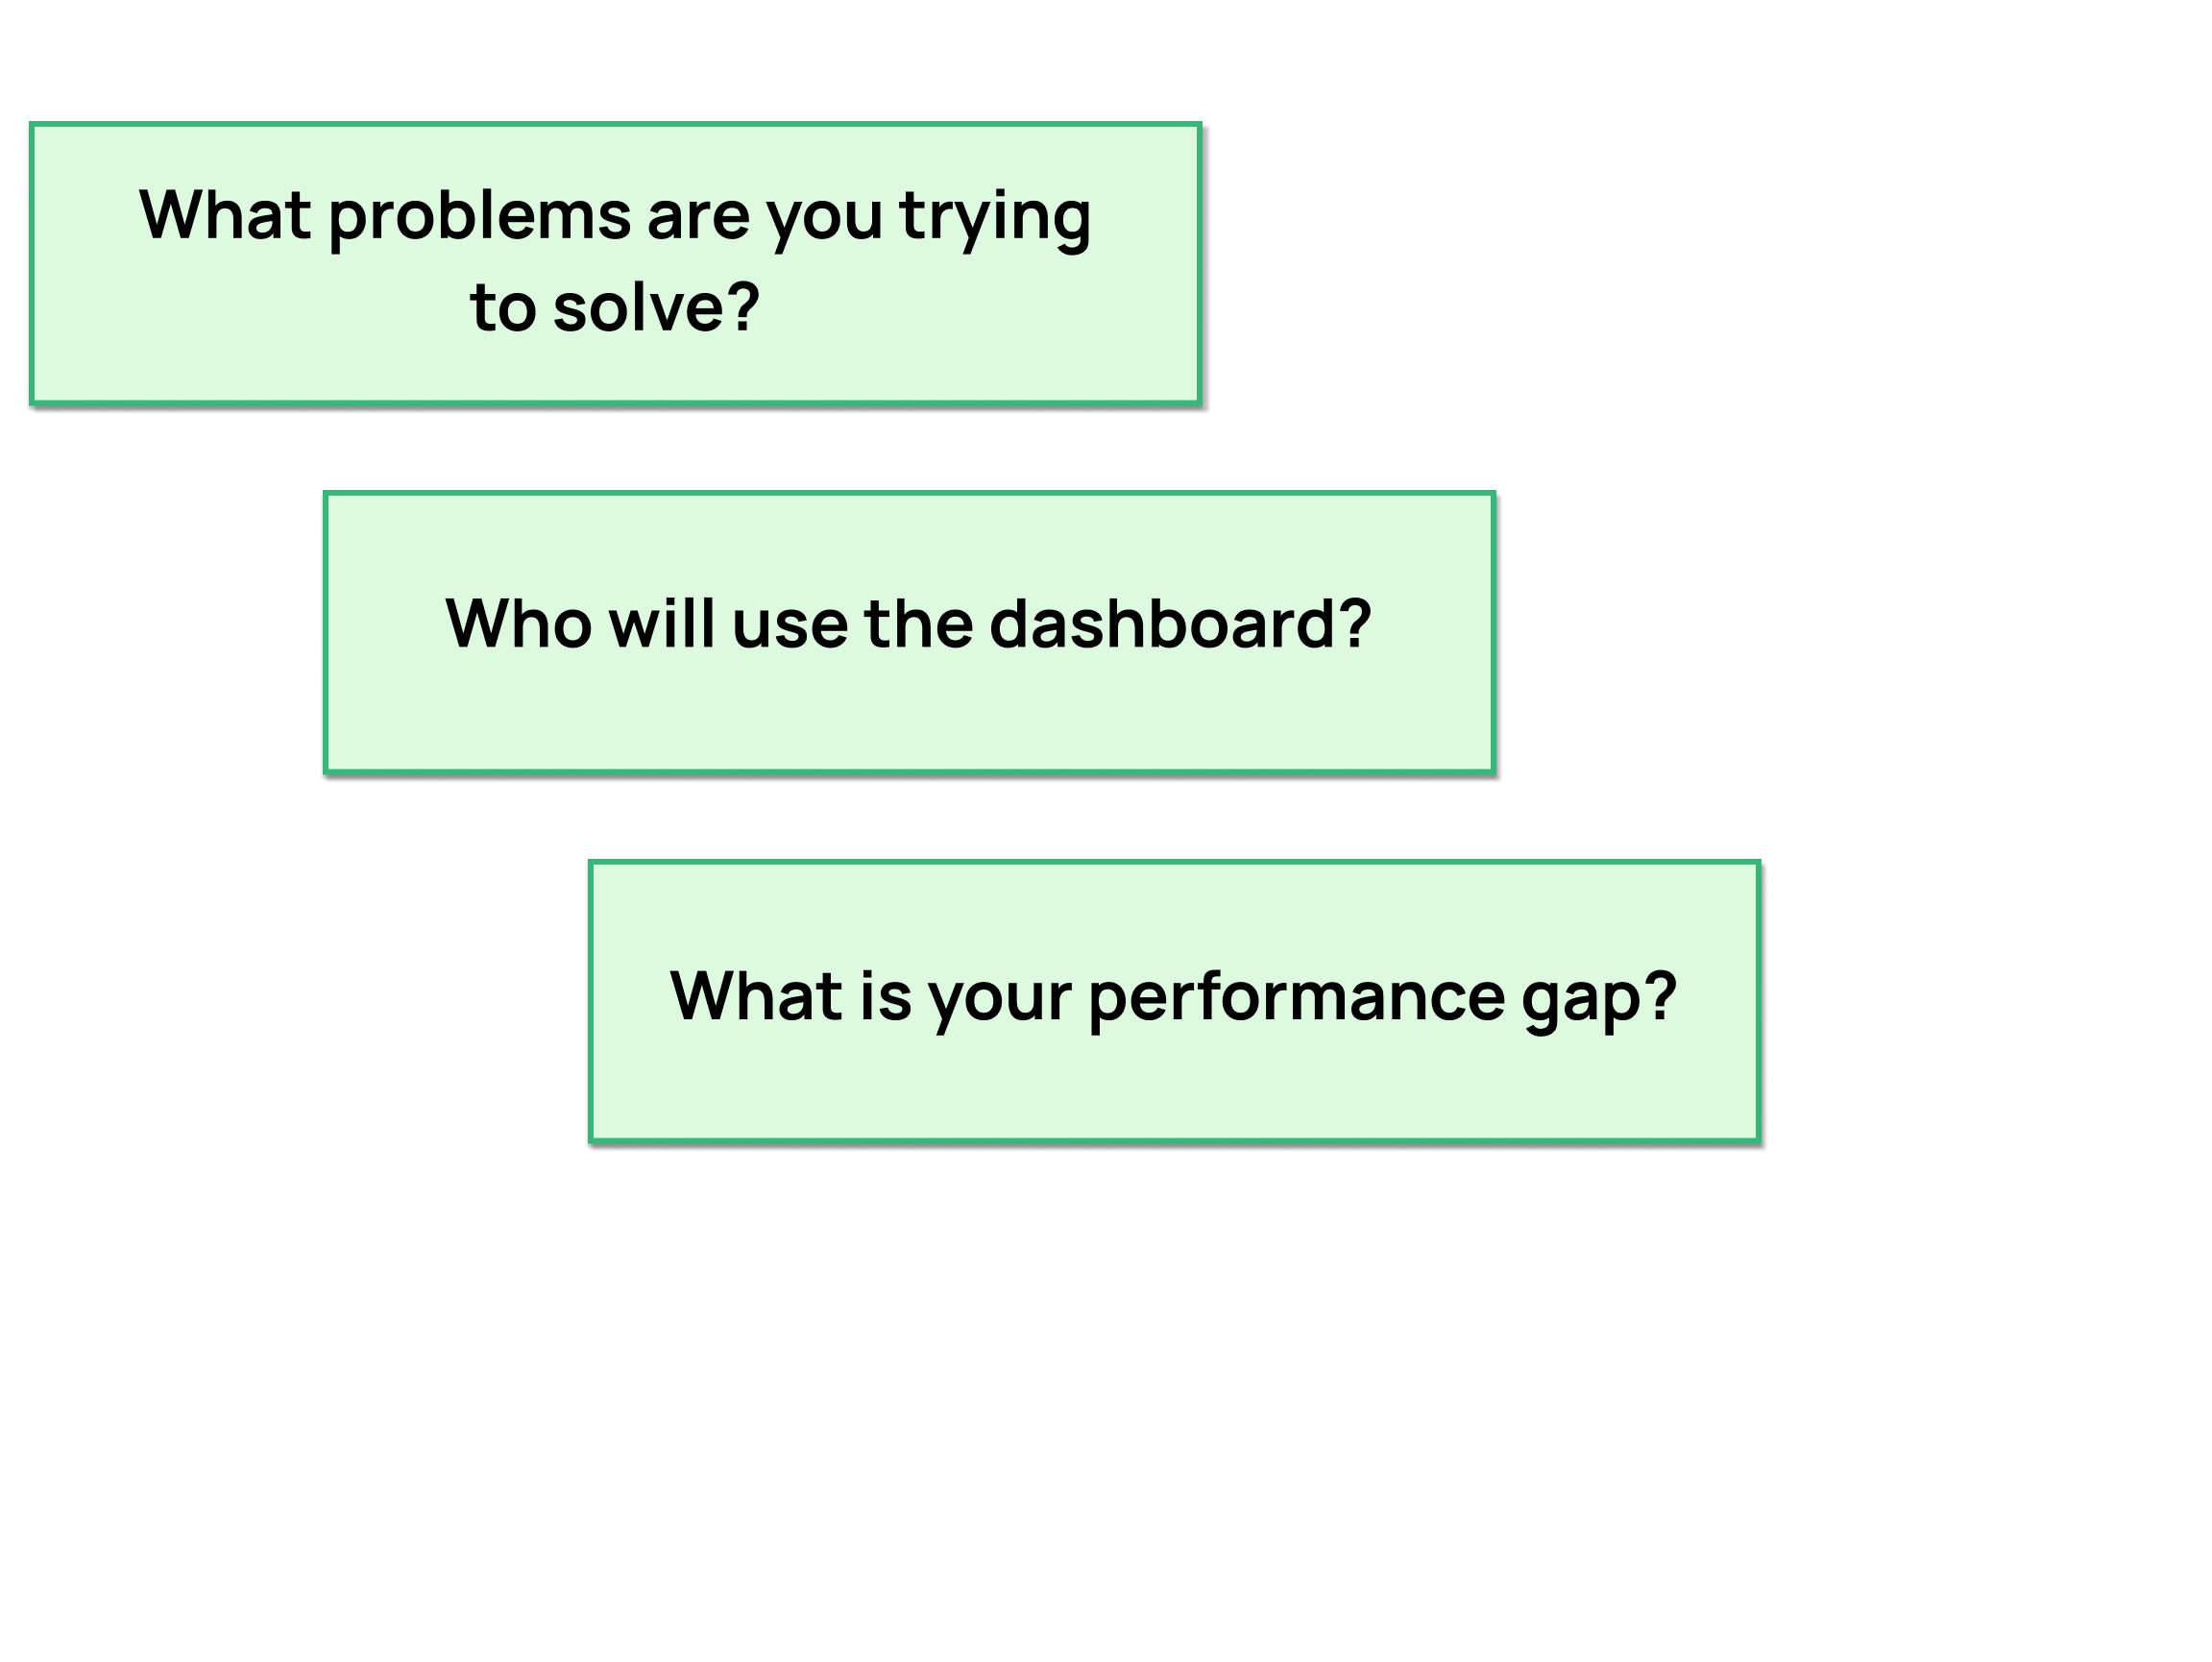
Choosing the right dashboard
1 Stojanovic, Filip. (2022). Understanding Business Dashboard Types.
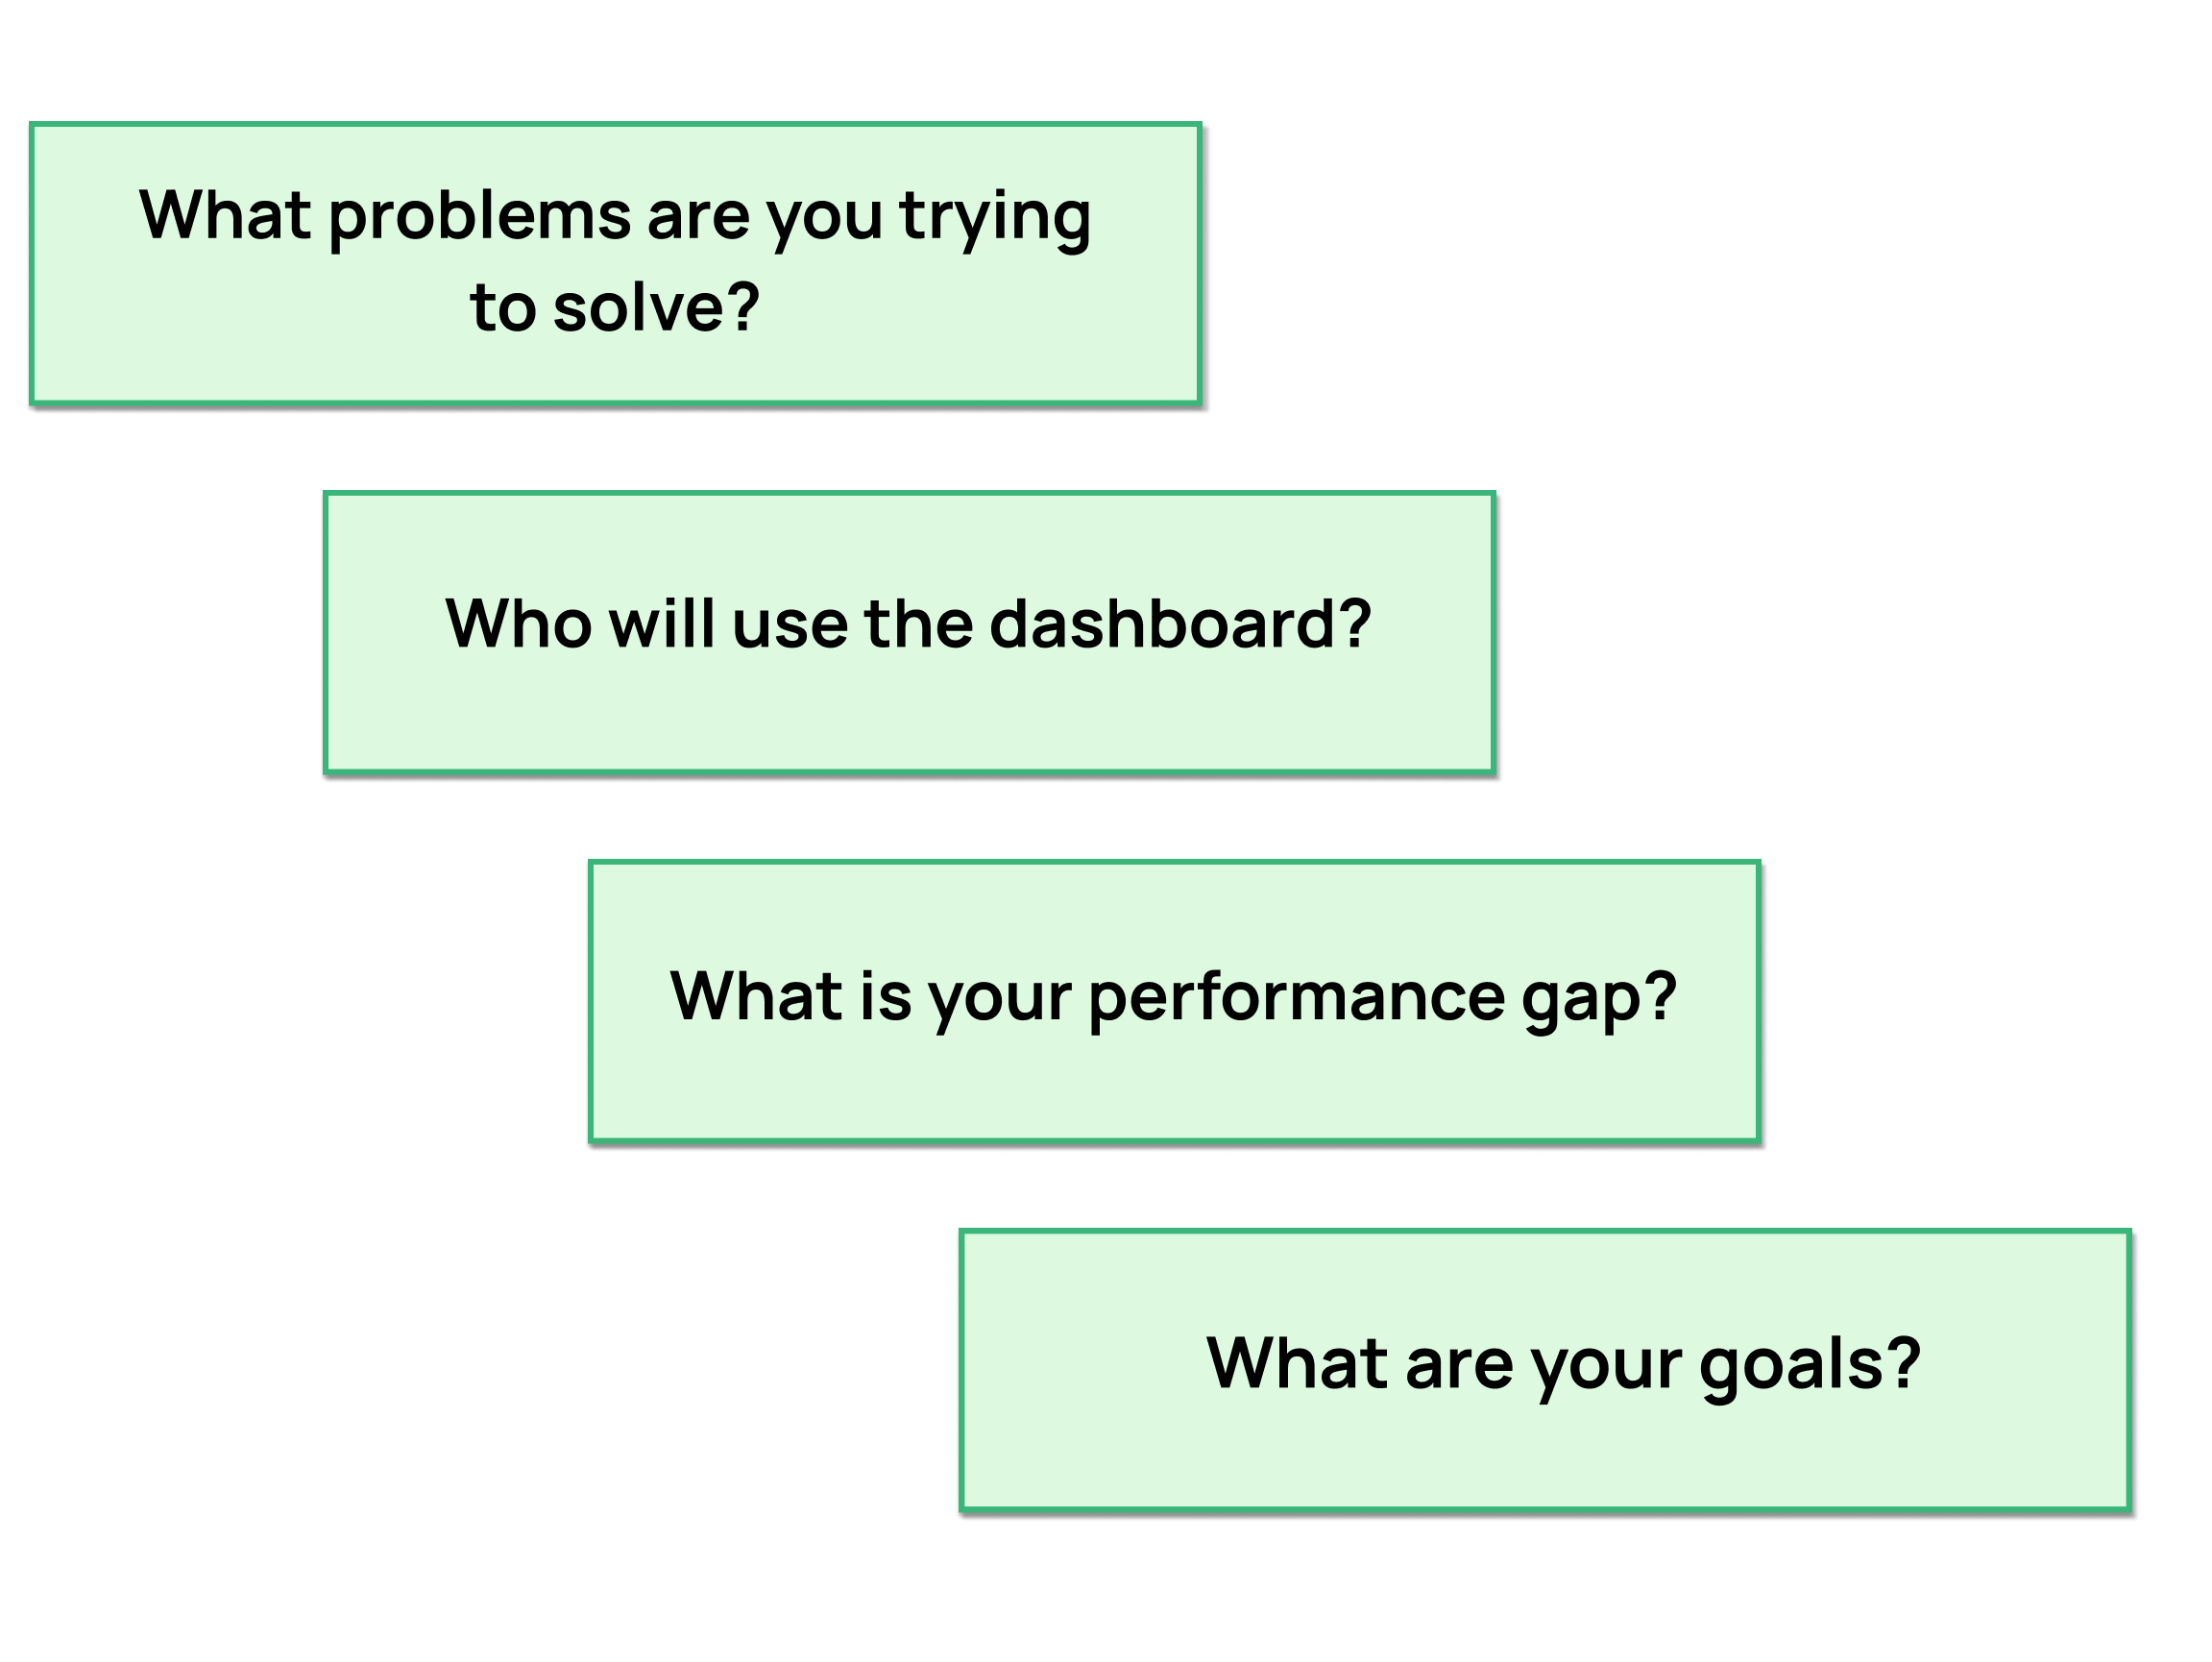
Choosing the right dashboard
1 Stojanovic, Filip. (2022). Understanding Business Dashboard Types.
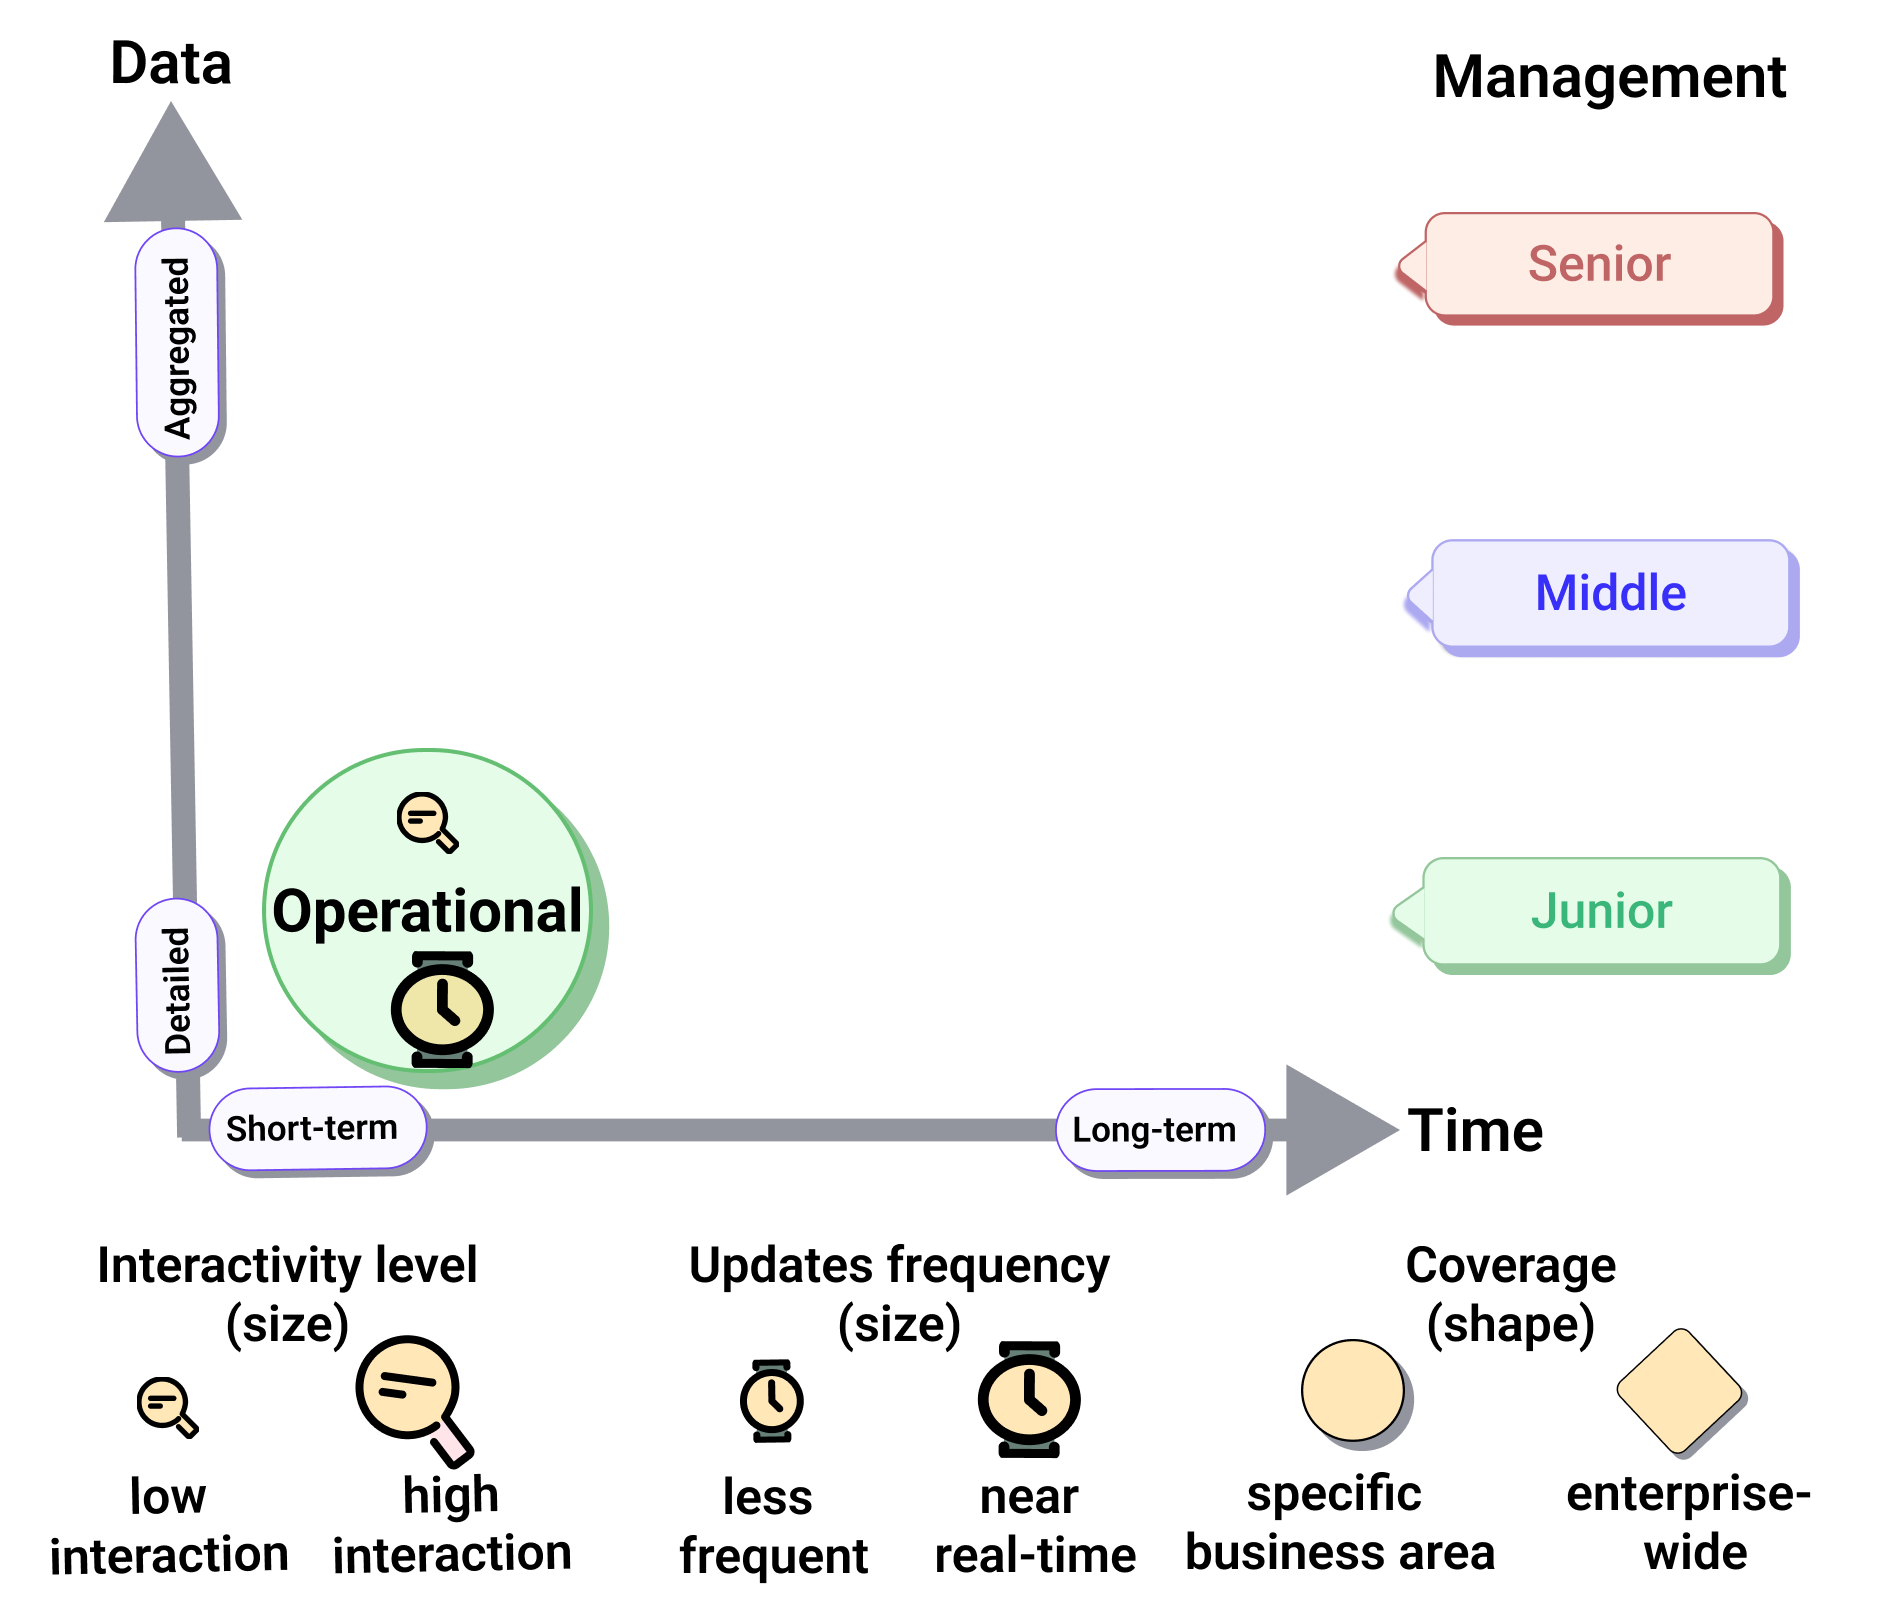
Choosing the right dashboard
1 Stojanovic, Filip. (2022). Understanding Business Dashboard Types.
Choosing the right dashboard
1 Stojanovic, Filip. (2022). Understanding Business Dashboard Types.
The everyday dashboard
Operational dashboard benefits
1 FineReport. (2021). Operational Dashboard.
Operational dashboard benefits
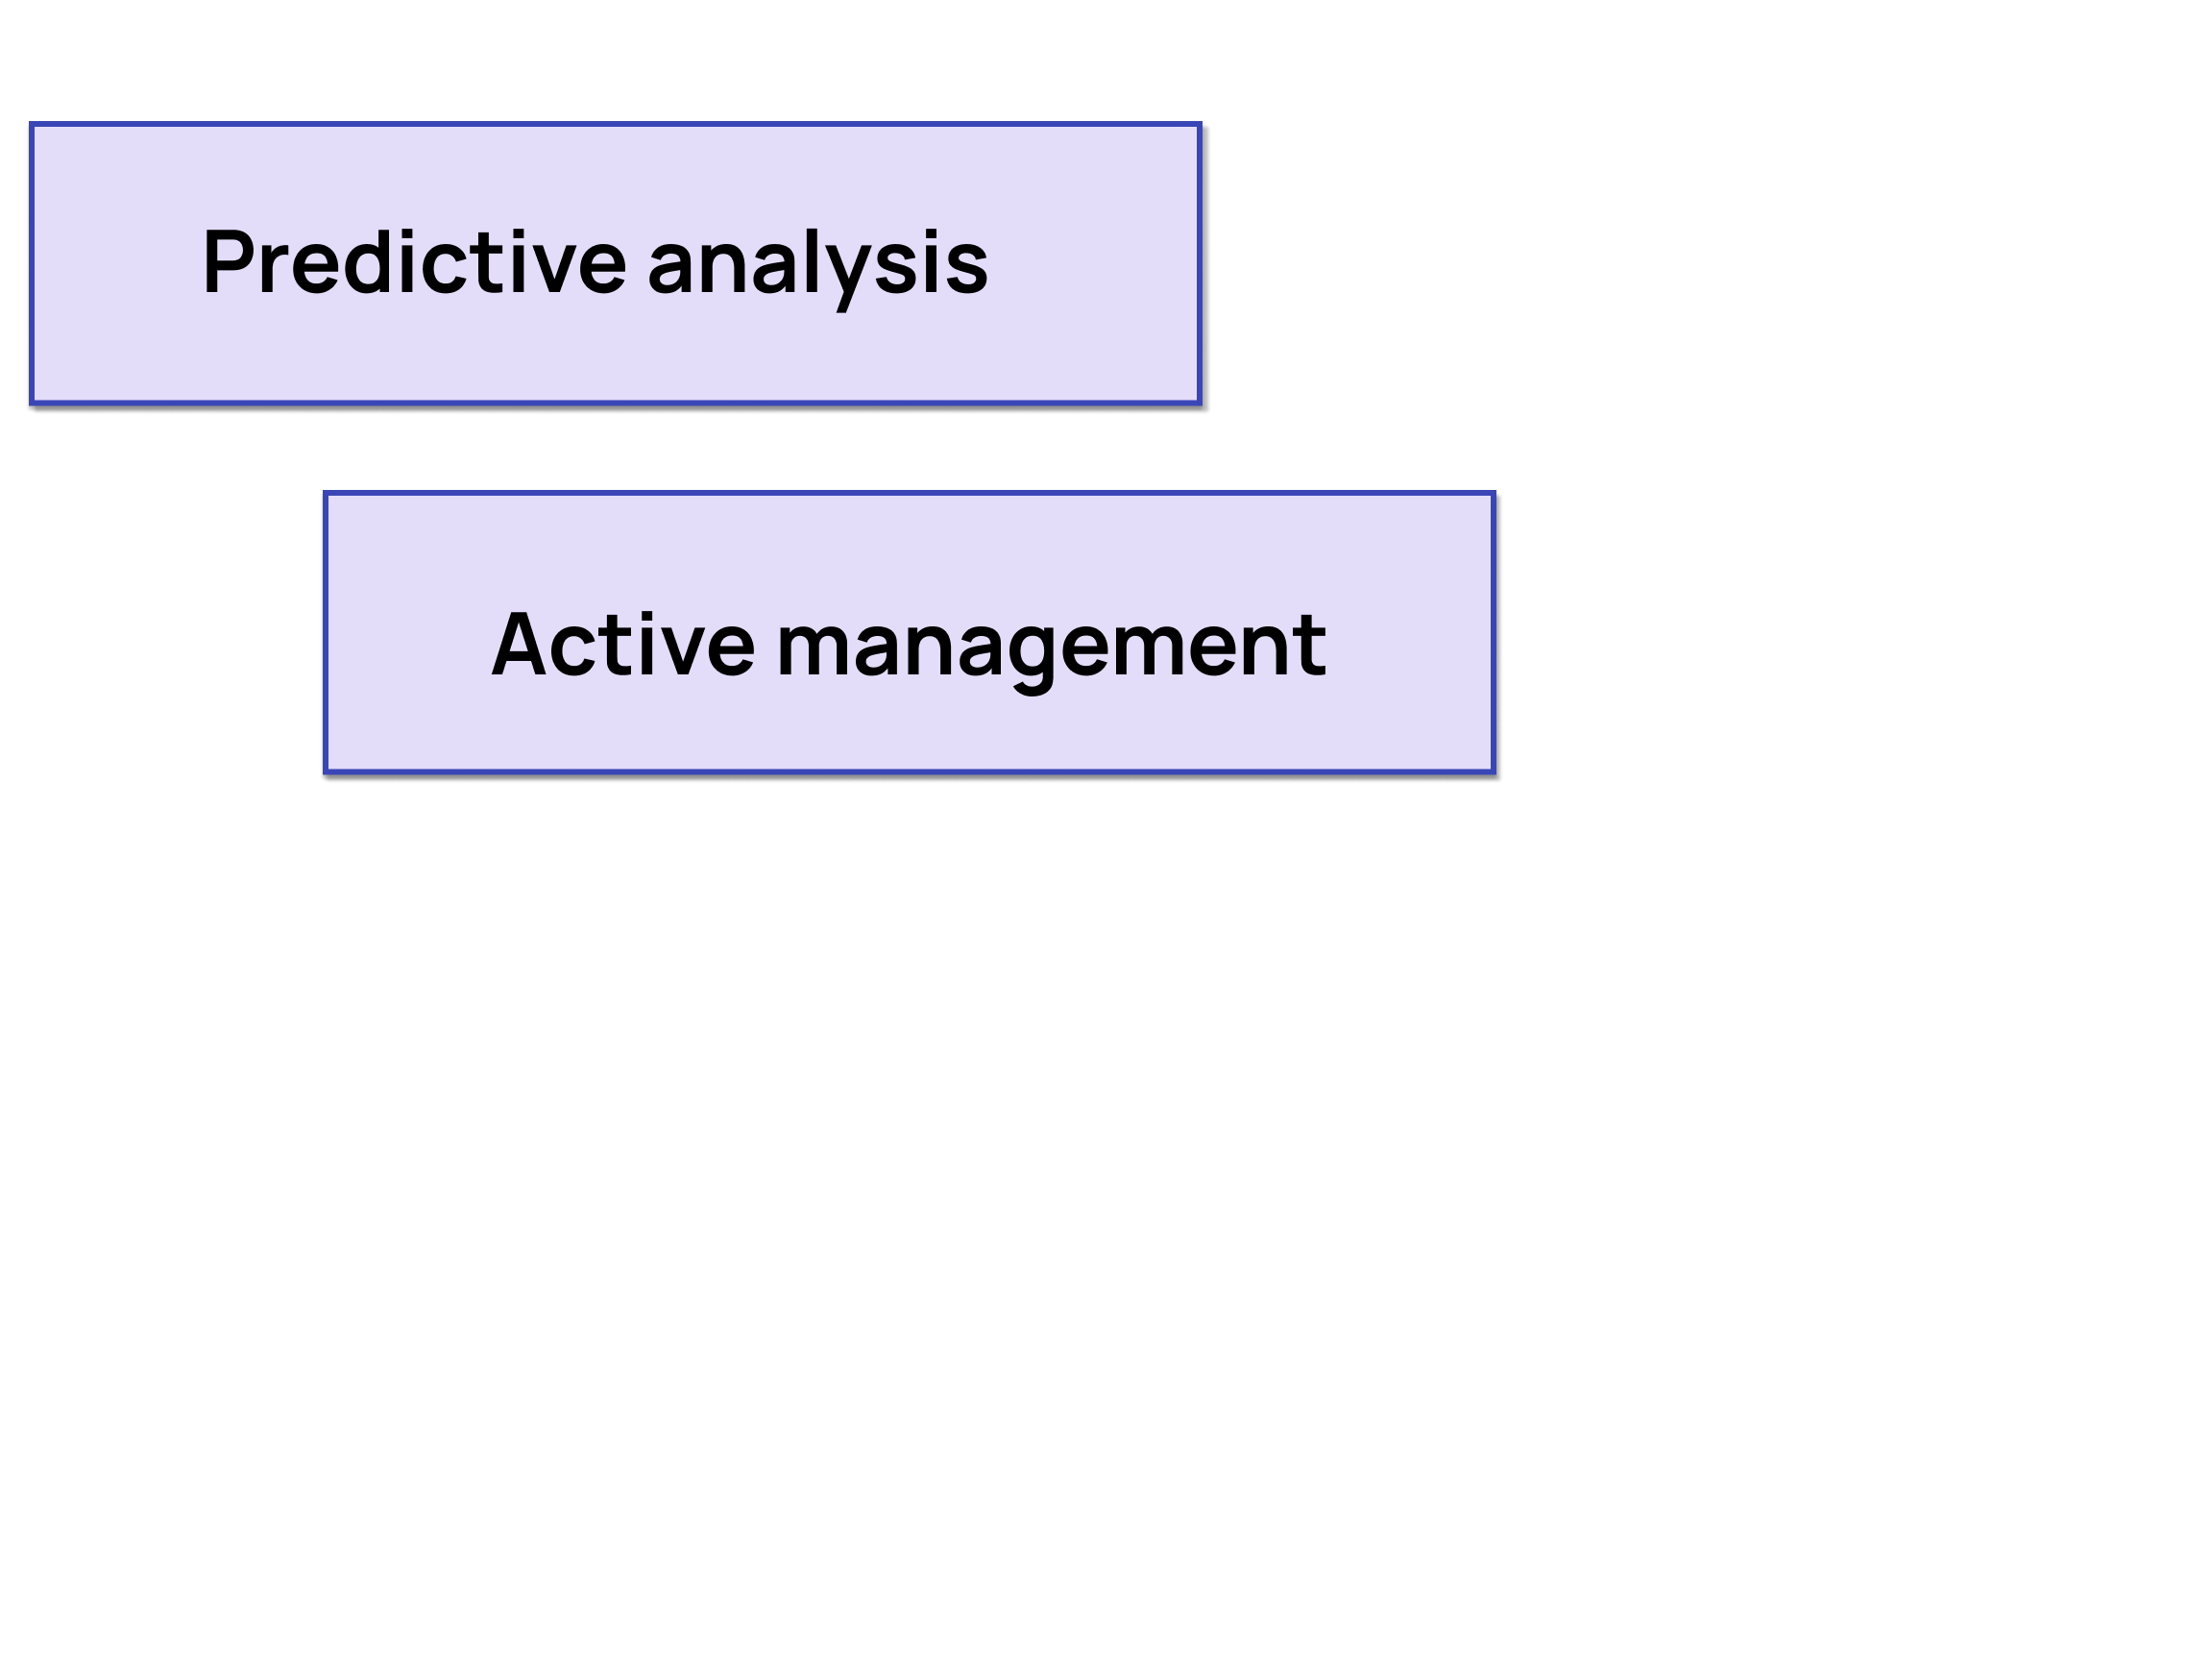
1 FineReport. (2021). Operational Dashboard.
Operational dashboard benefits
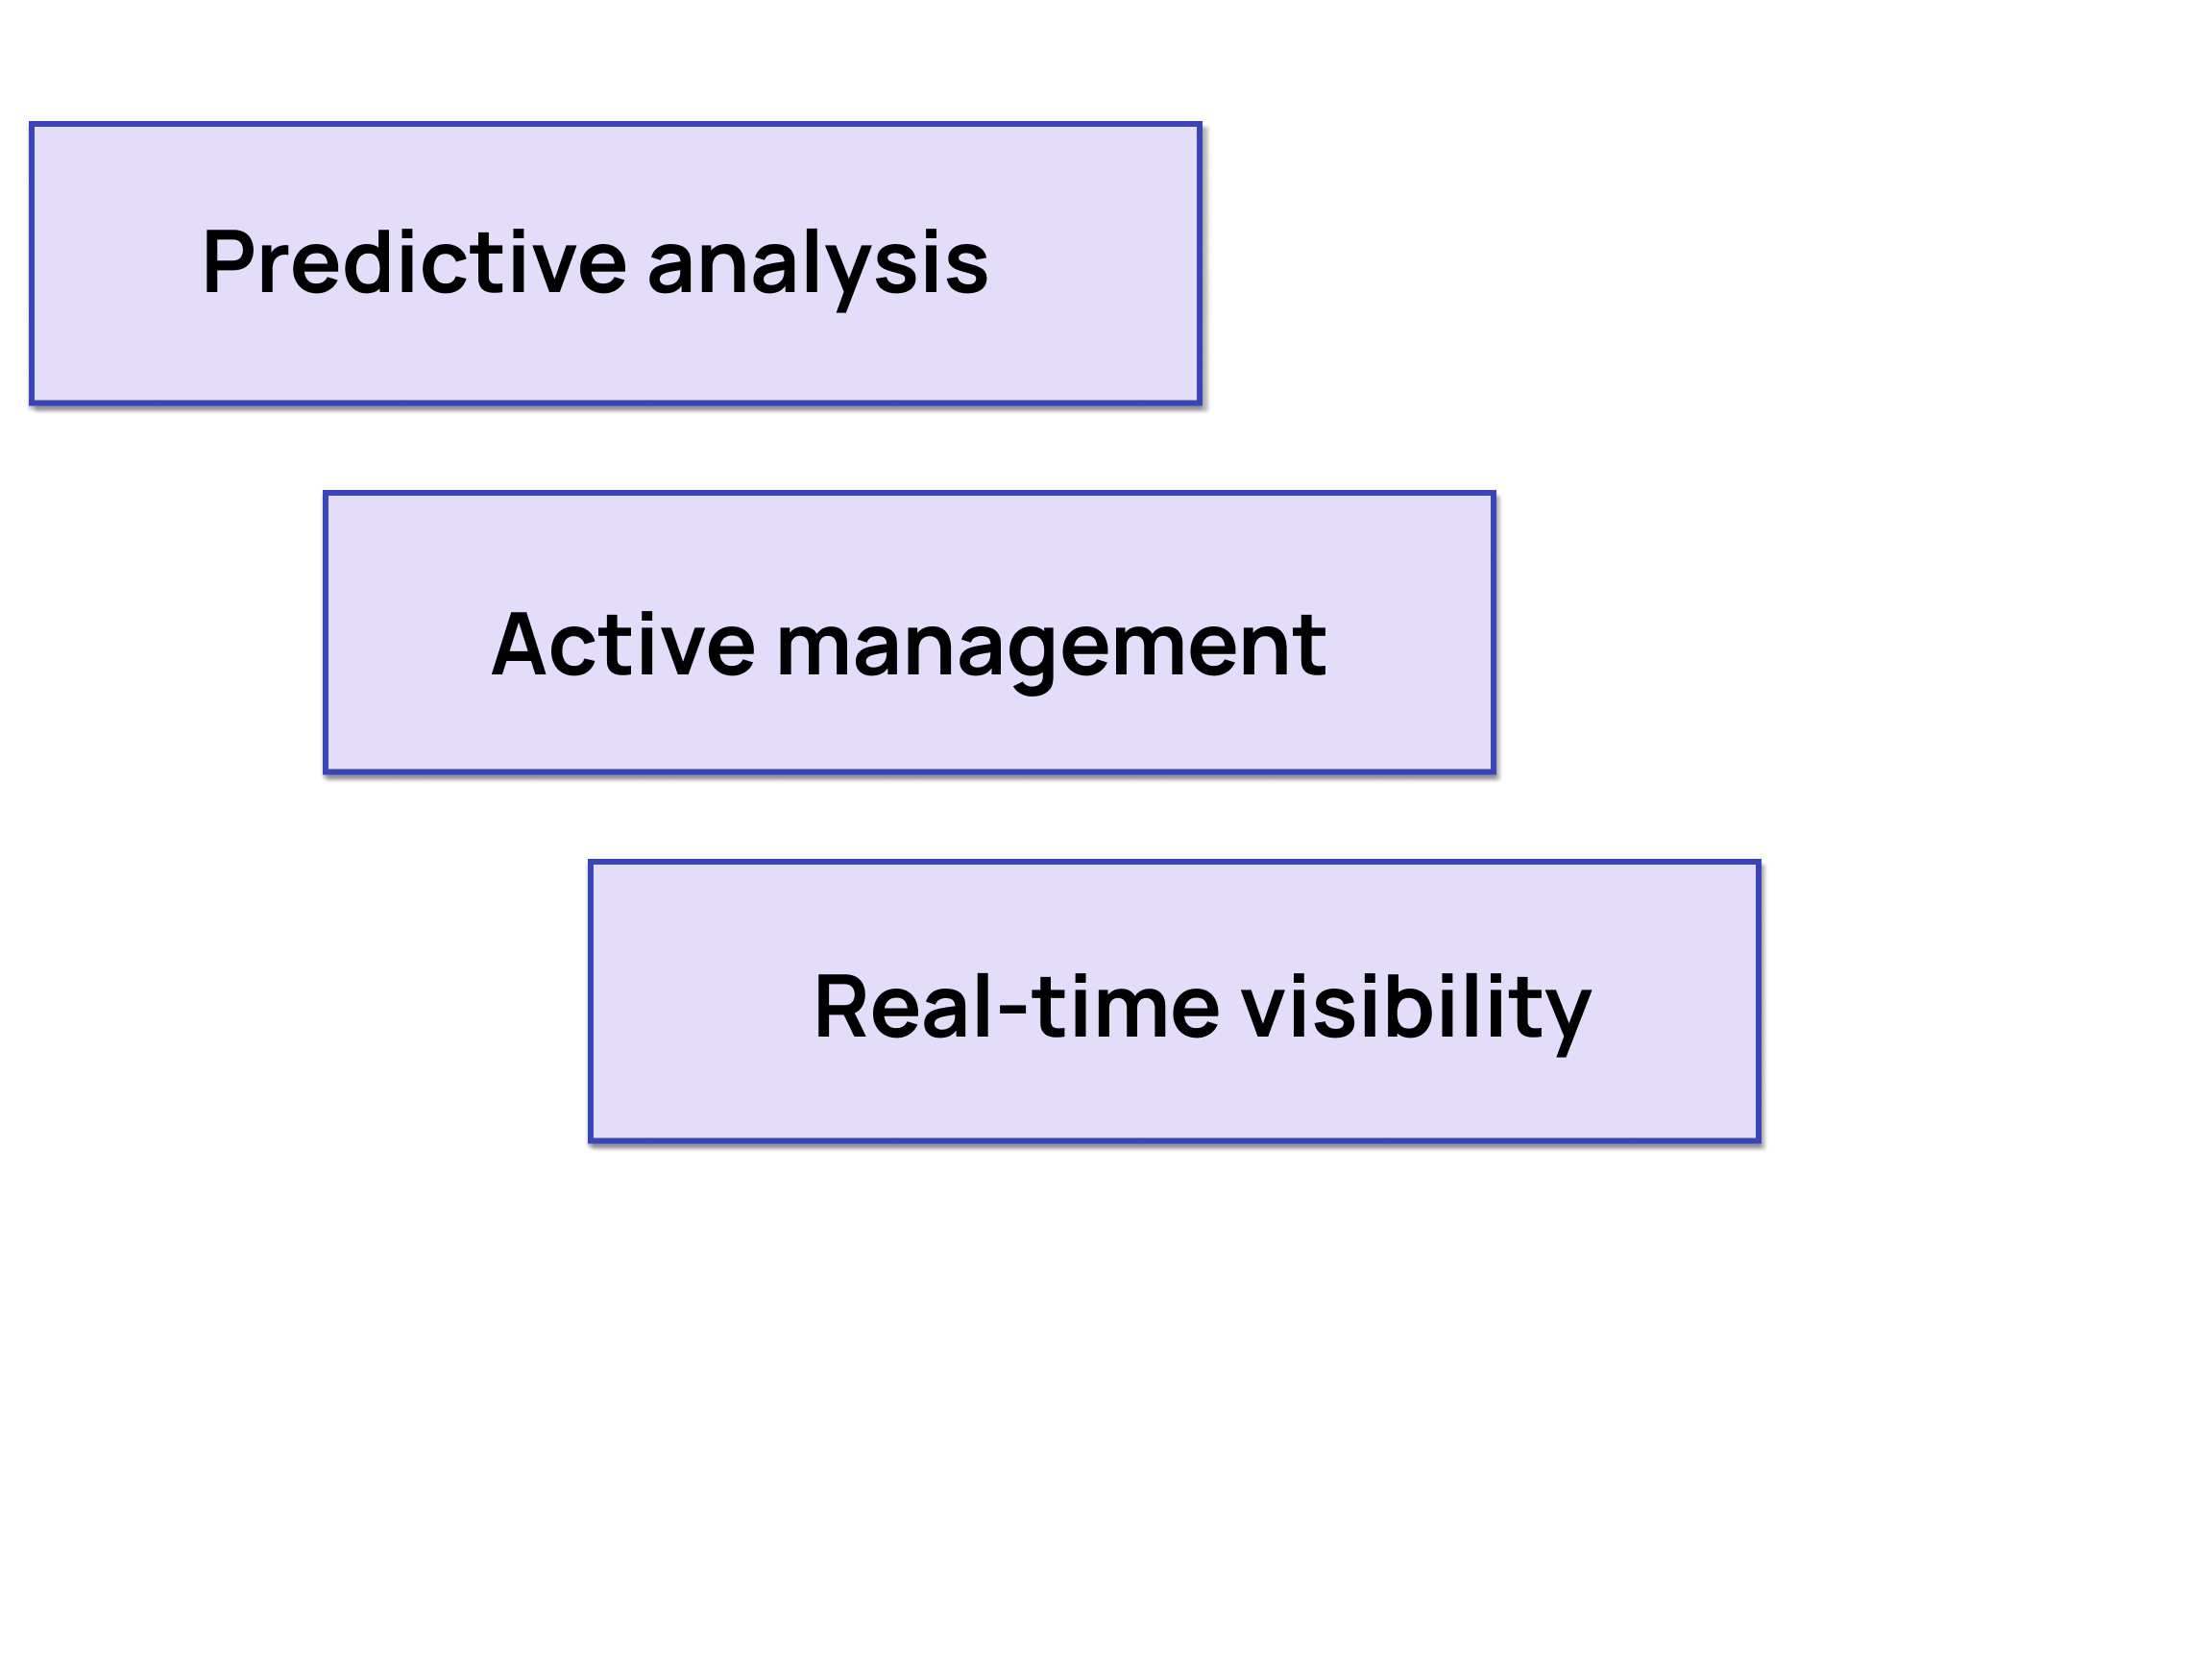
1 FineReport. (2021). Operational Dashboard.
Operational dashboard benefits
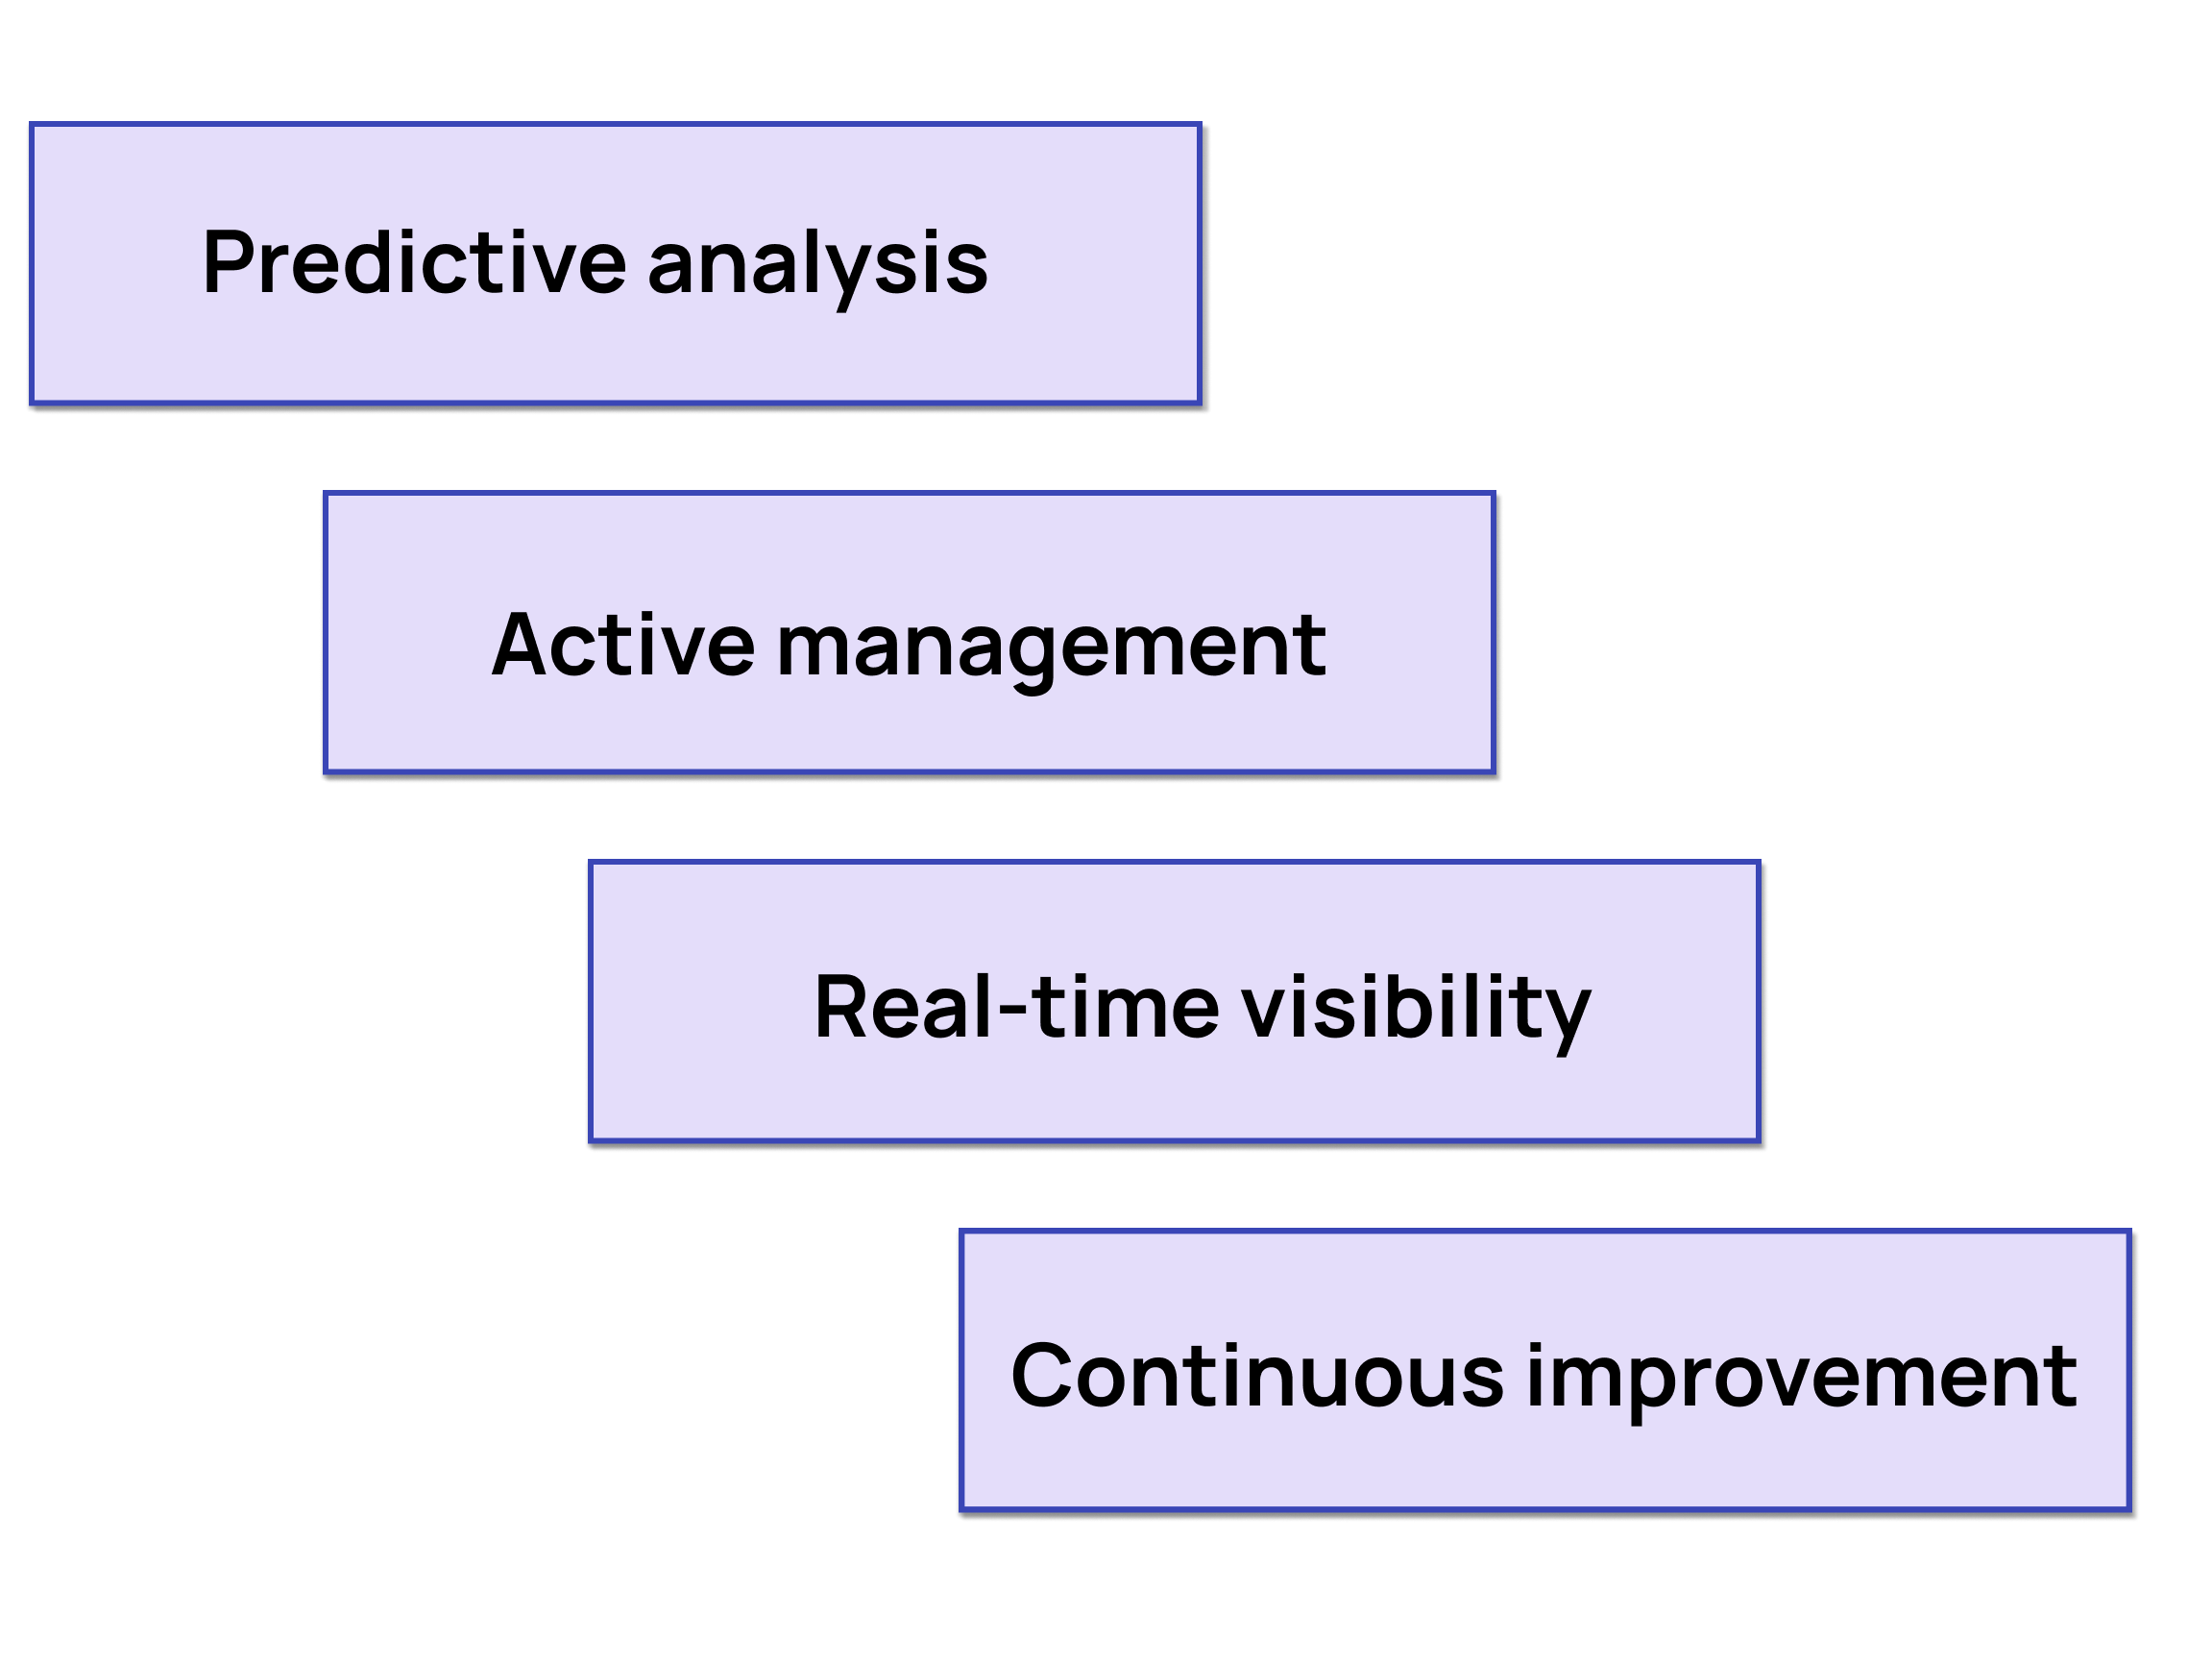
1 FineReport. (2021). Operational Dashboard.
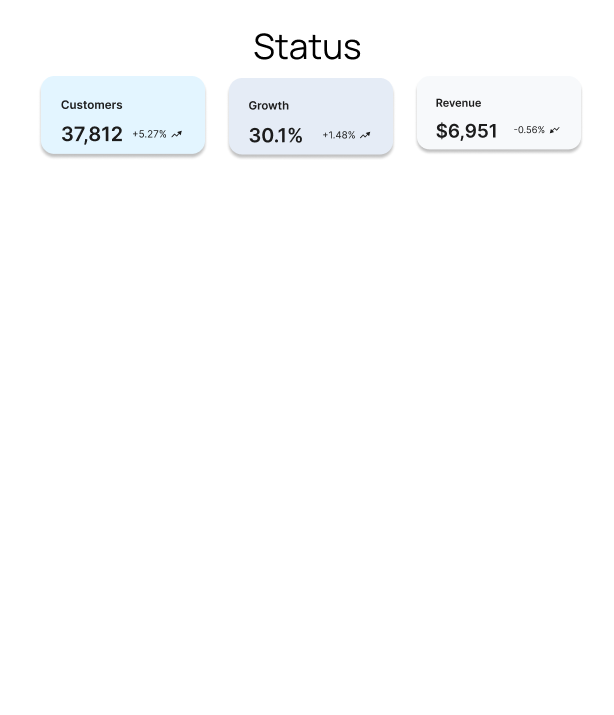
Operational dashboard types
Every business can monitor company's operations and activities
![]()
What's currently going on?
Marketing: campaign success, acquisition costs, the number of clicks
Manufacturing: production volumes, quantity ordered, returned items
Human resources: count of open positions, employee turnover, satisfaction
IT support: resolved cases, number of calls
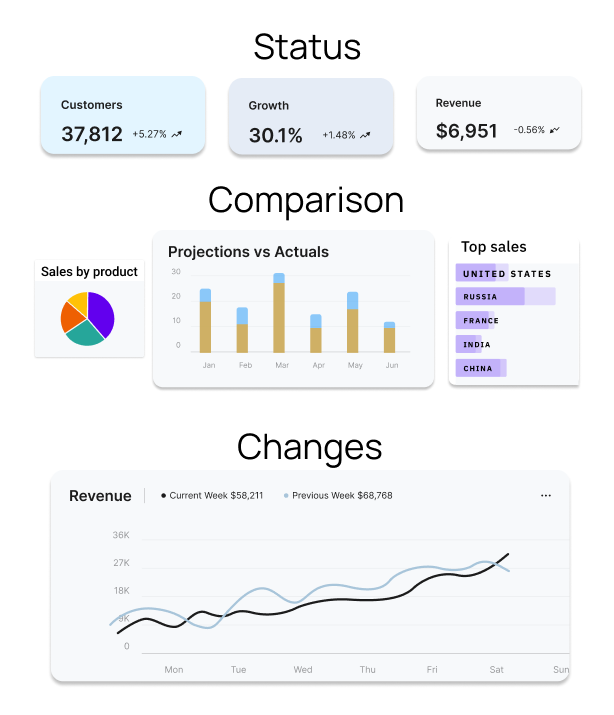
Operational dashboard graphical components
Operational dashboard graphical components
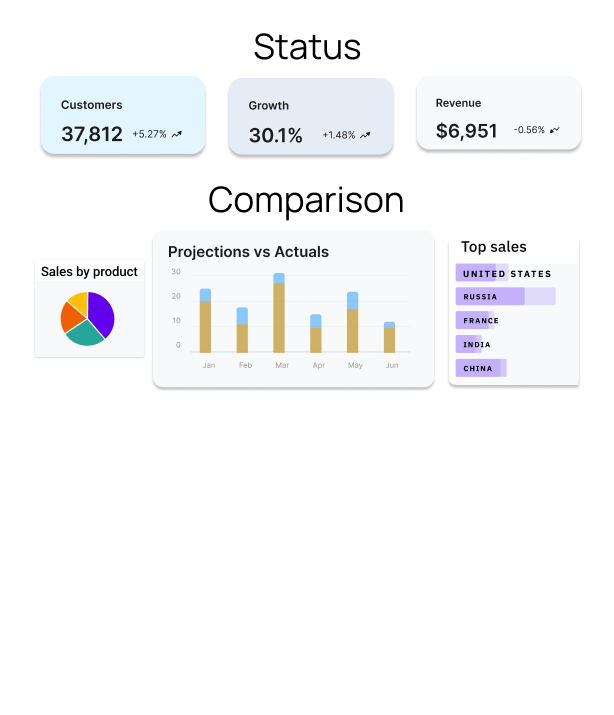
Operational dashboard graphical components