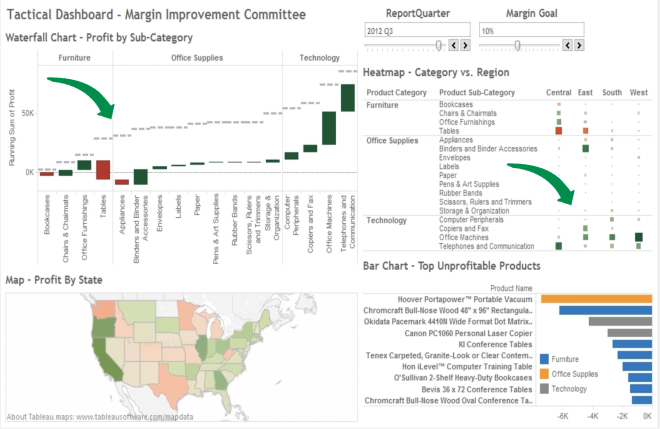
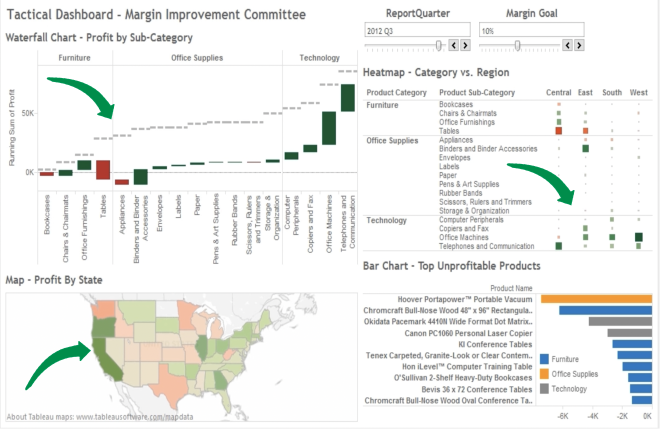
Tactical dashboard
Dashboard Design Concepts

Olga Scrivner, PhD
President, Scrivner Solutions Inc
A focused insights dashboard
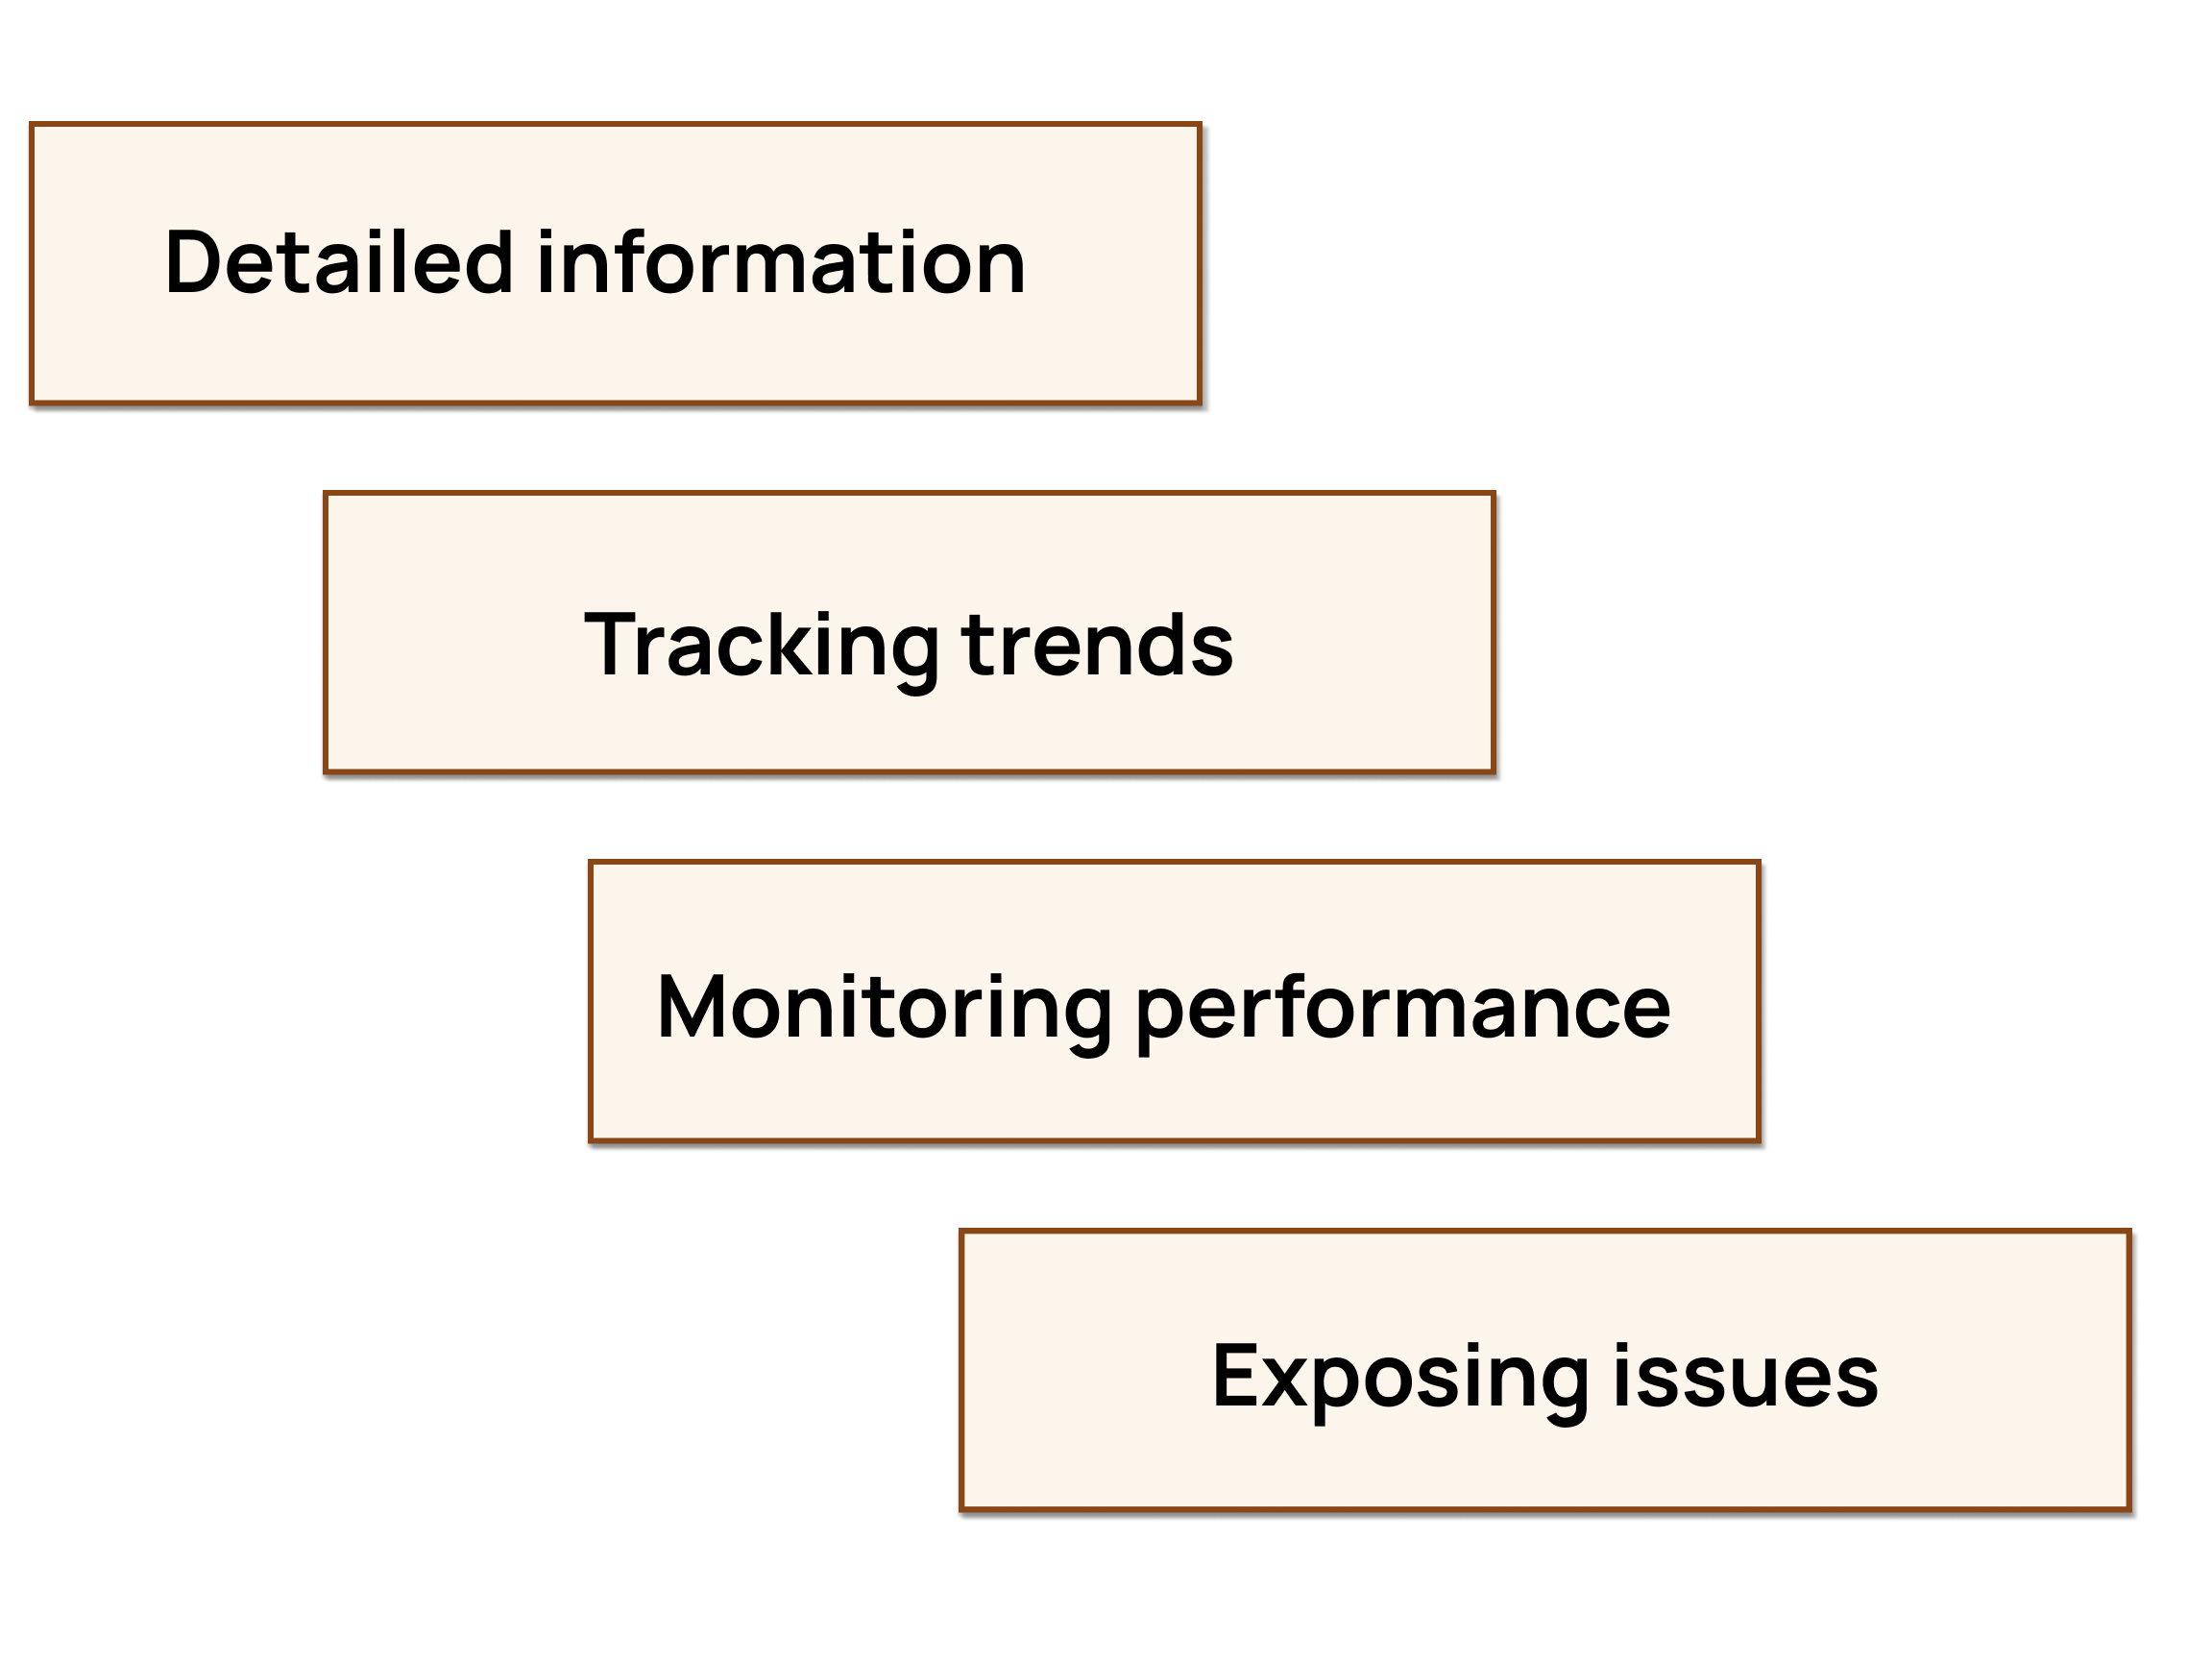
Tactical dashboard benefits
Tactical dashboard benefits
Tactical dashboard benefits
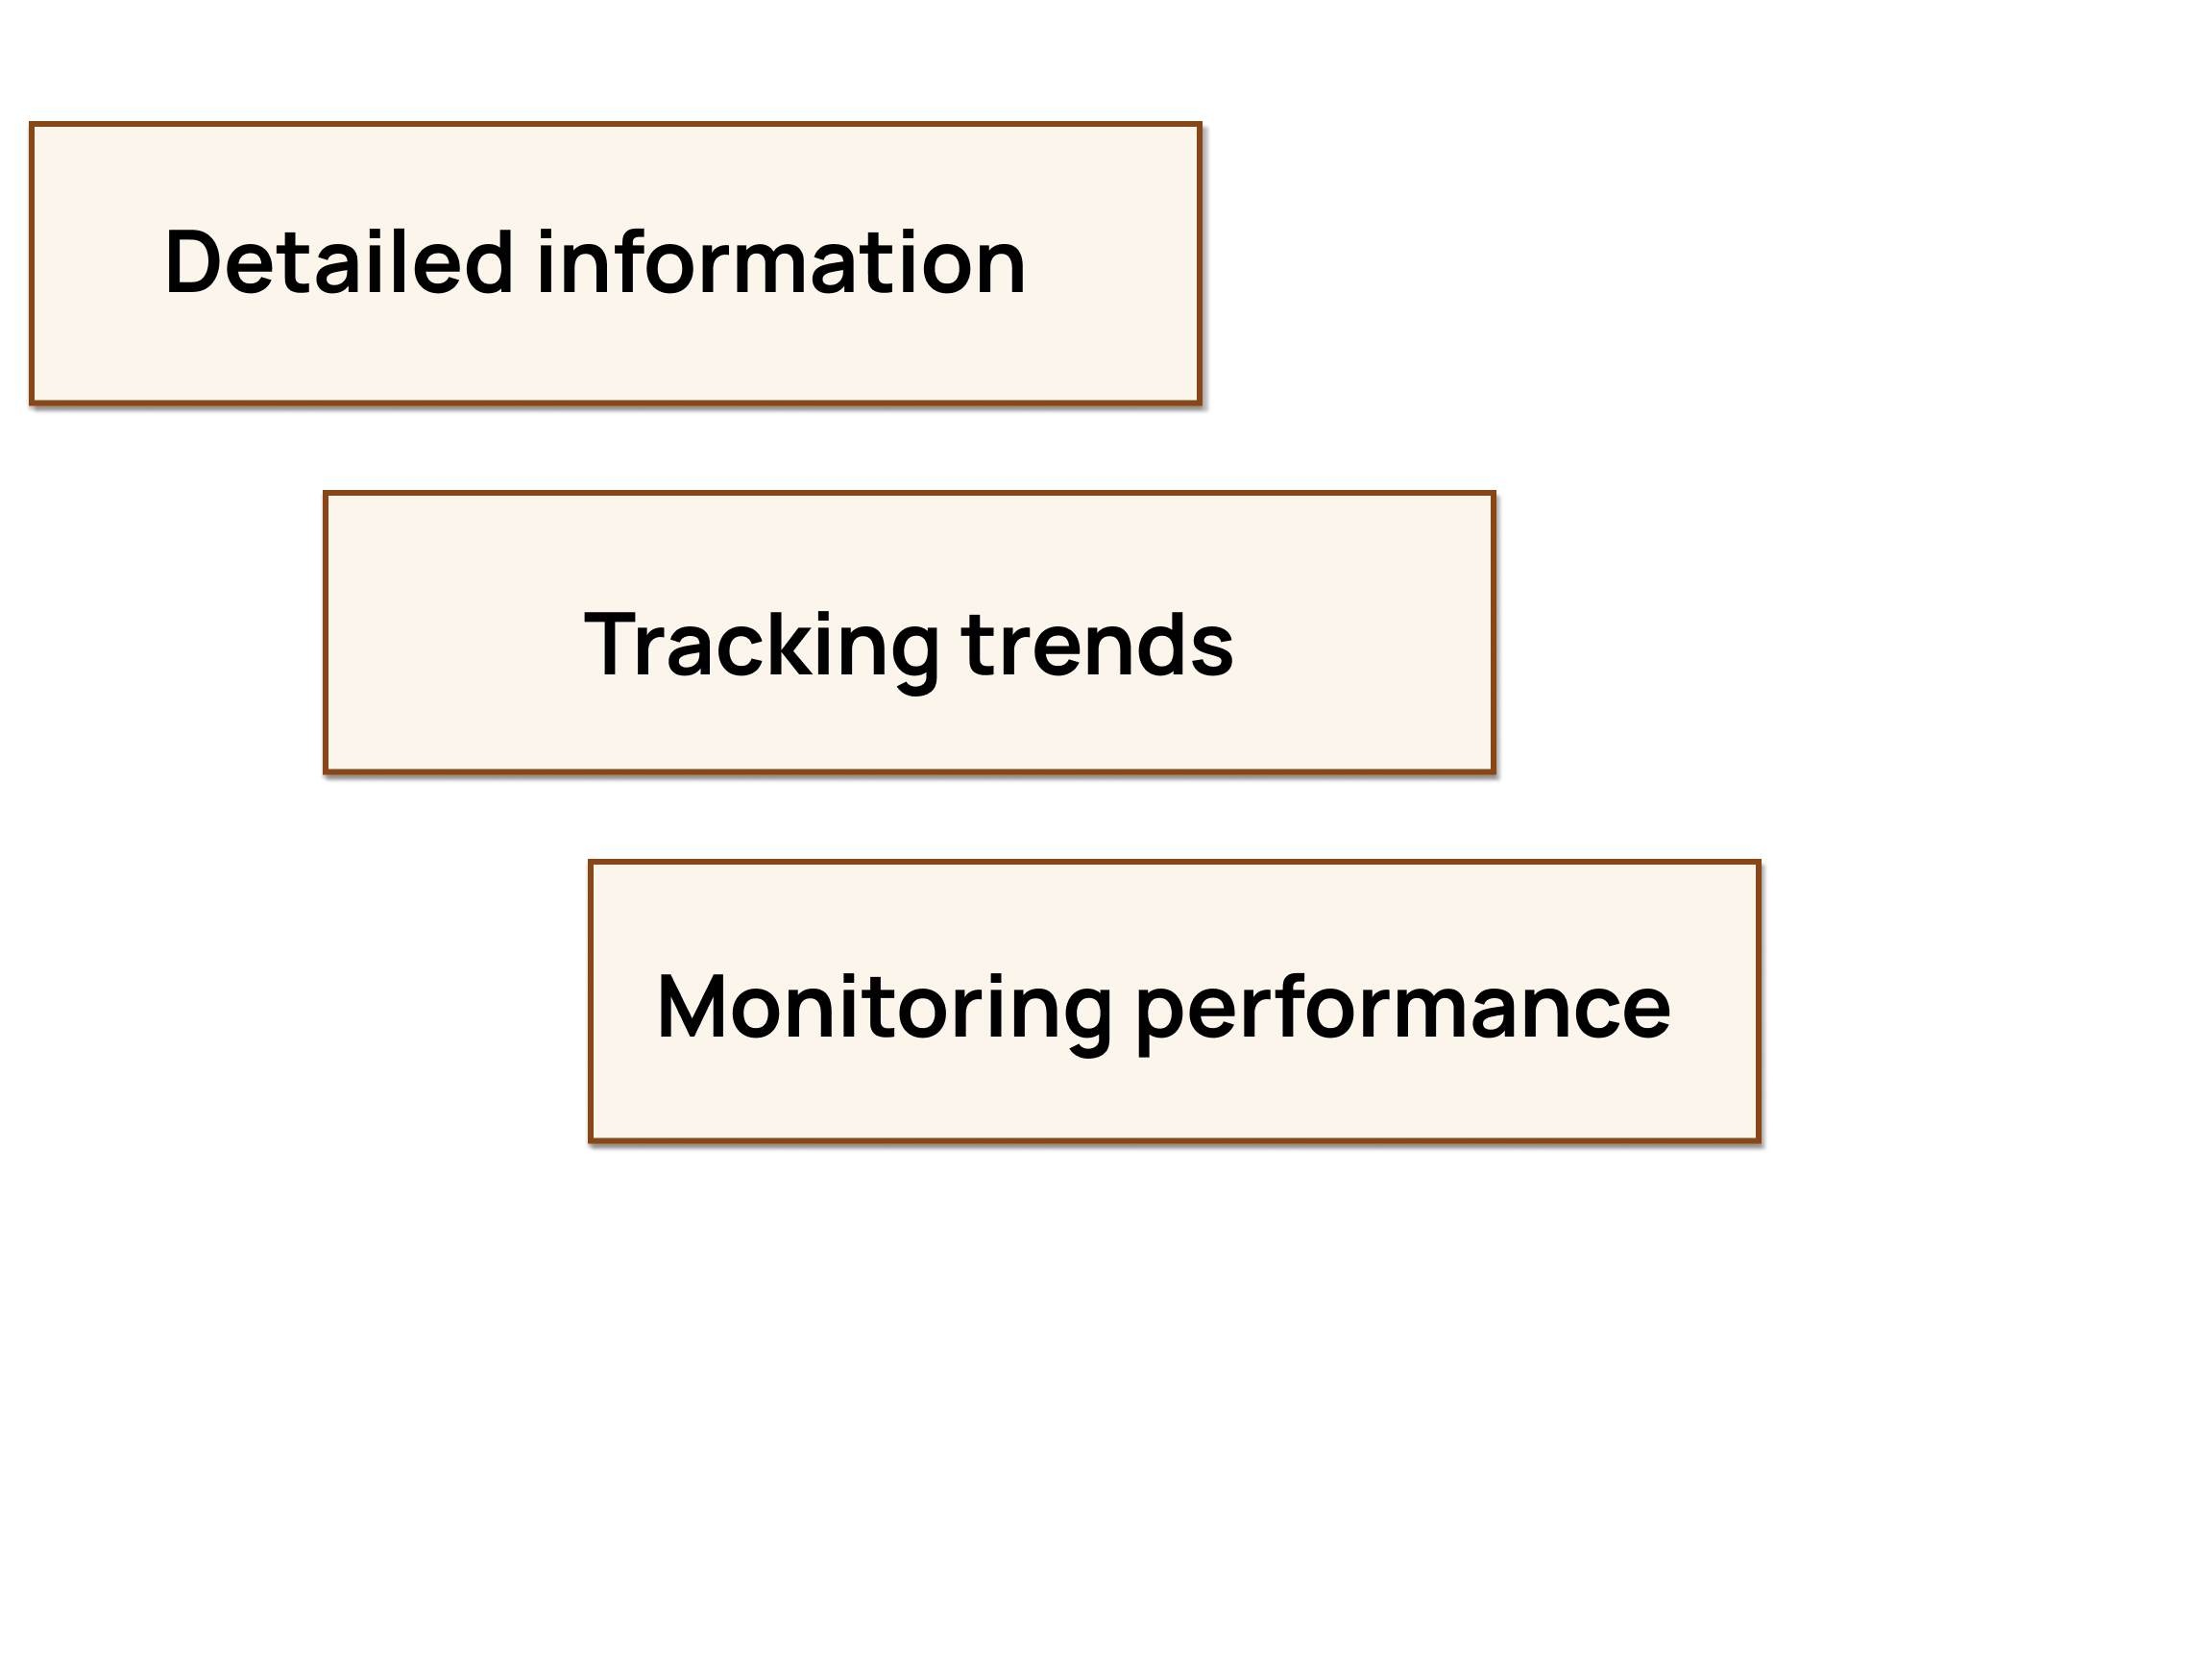
Tactical dashboard benefits
Tactical dashboard graphical components
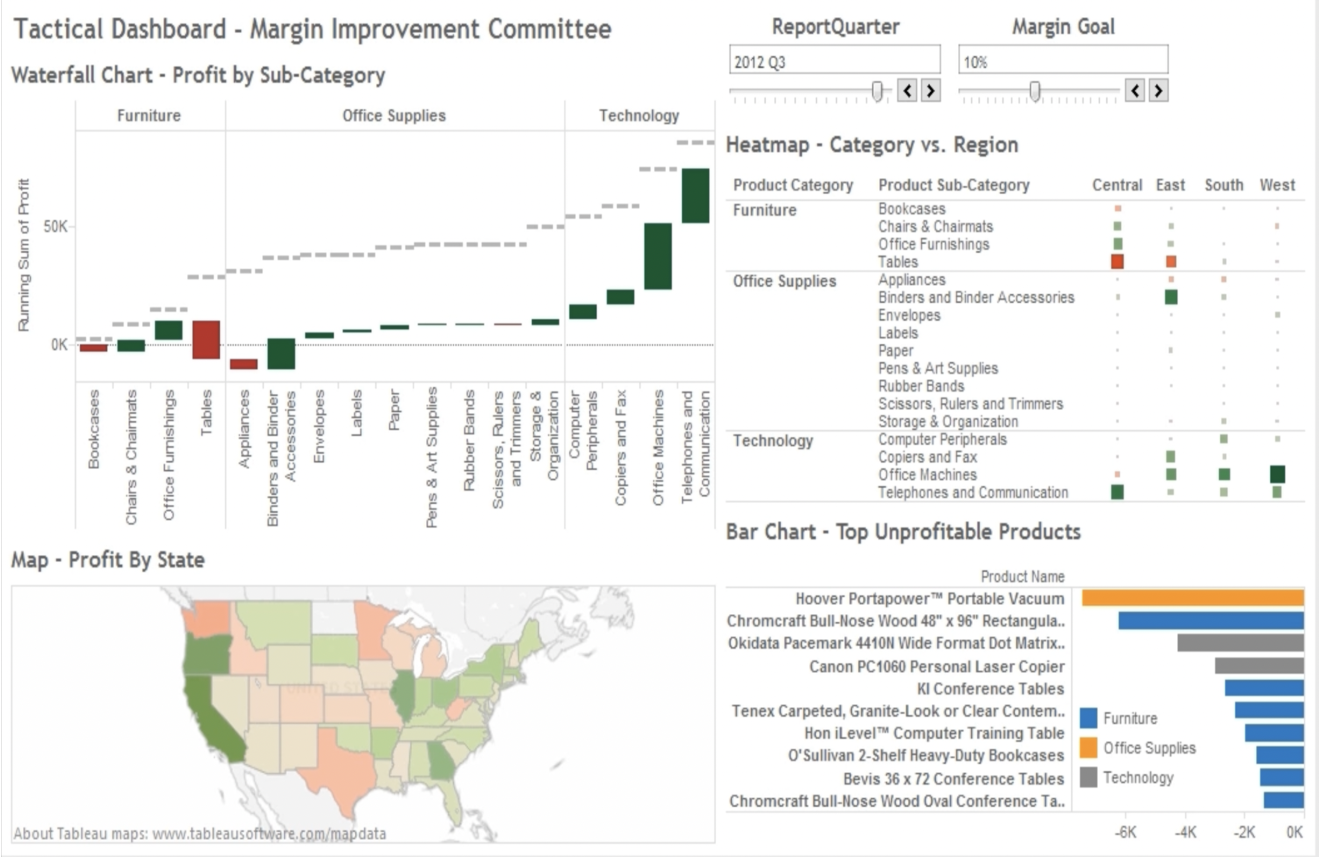
Tactical dashboard graphical components
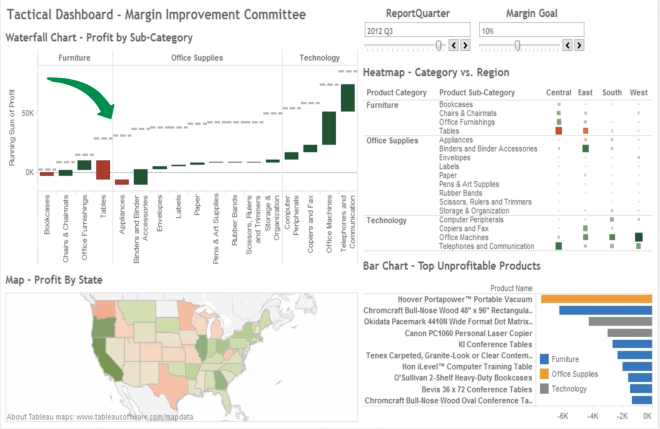
Tactical dashboard graphical components
Tactical dashboard graphical components
1 Kau, Tony. (2014). Chapter 3: Tactical Dashboards
Tactical dashboard examples
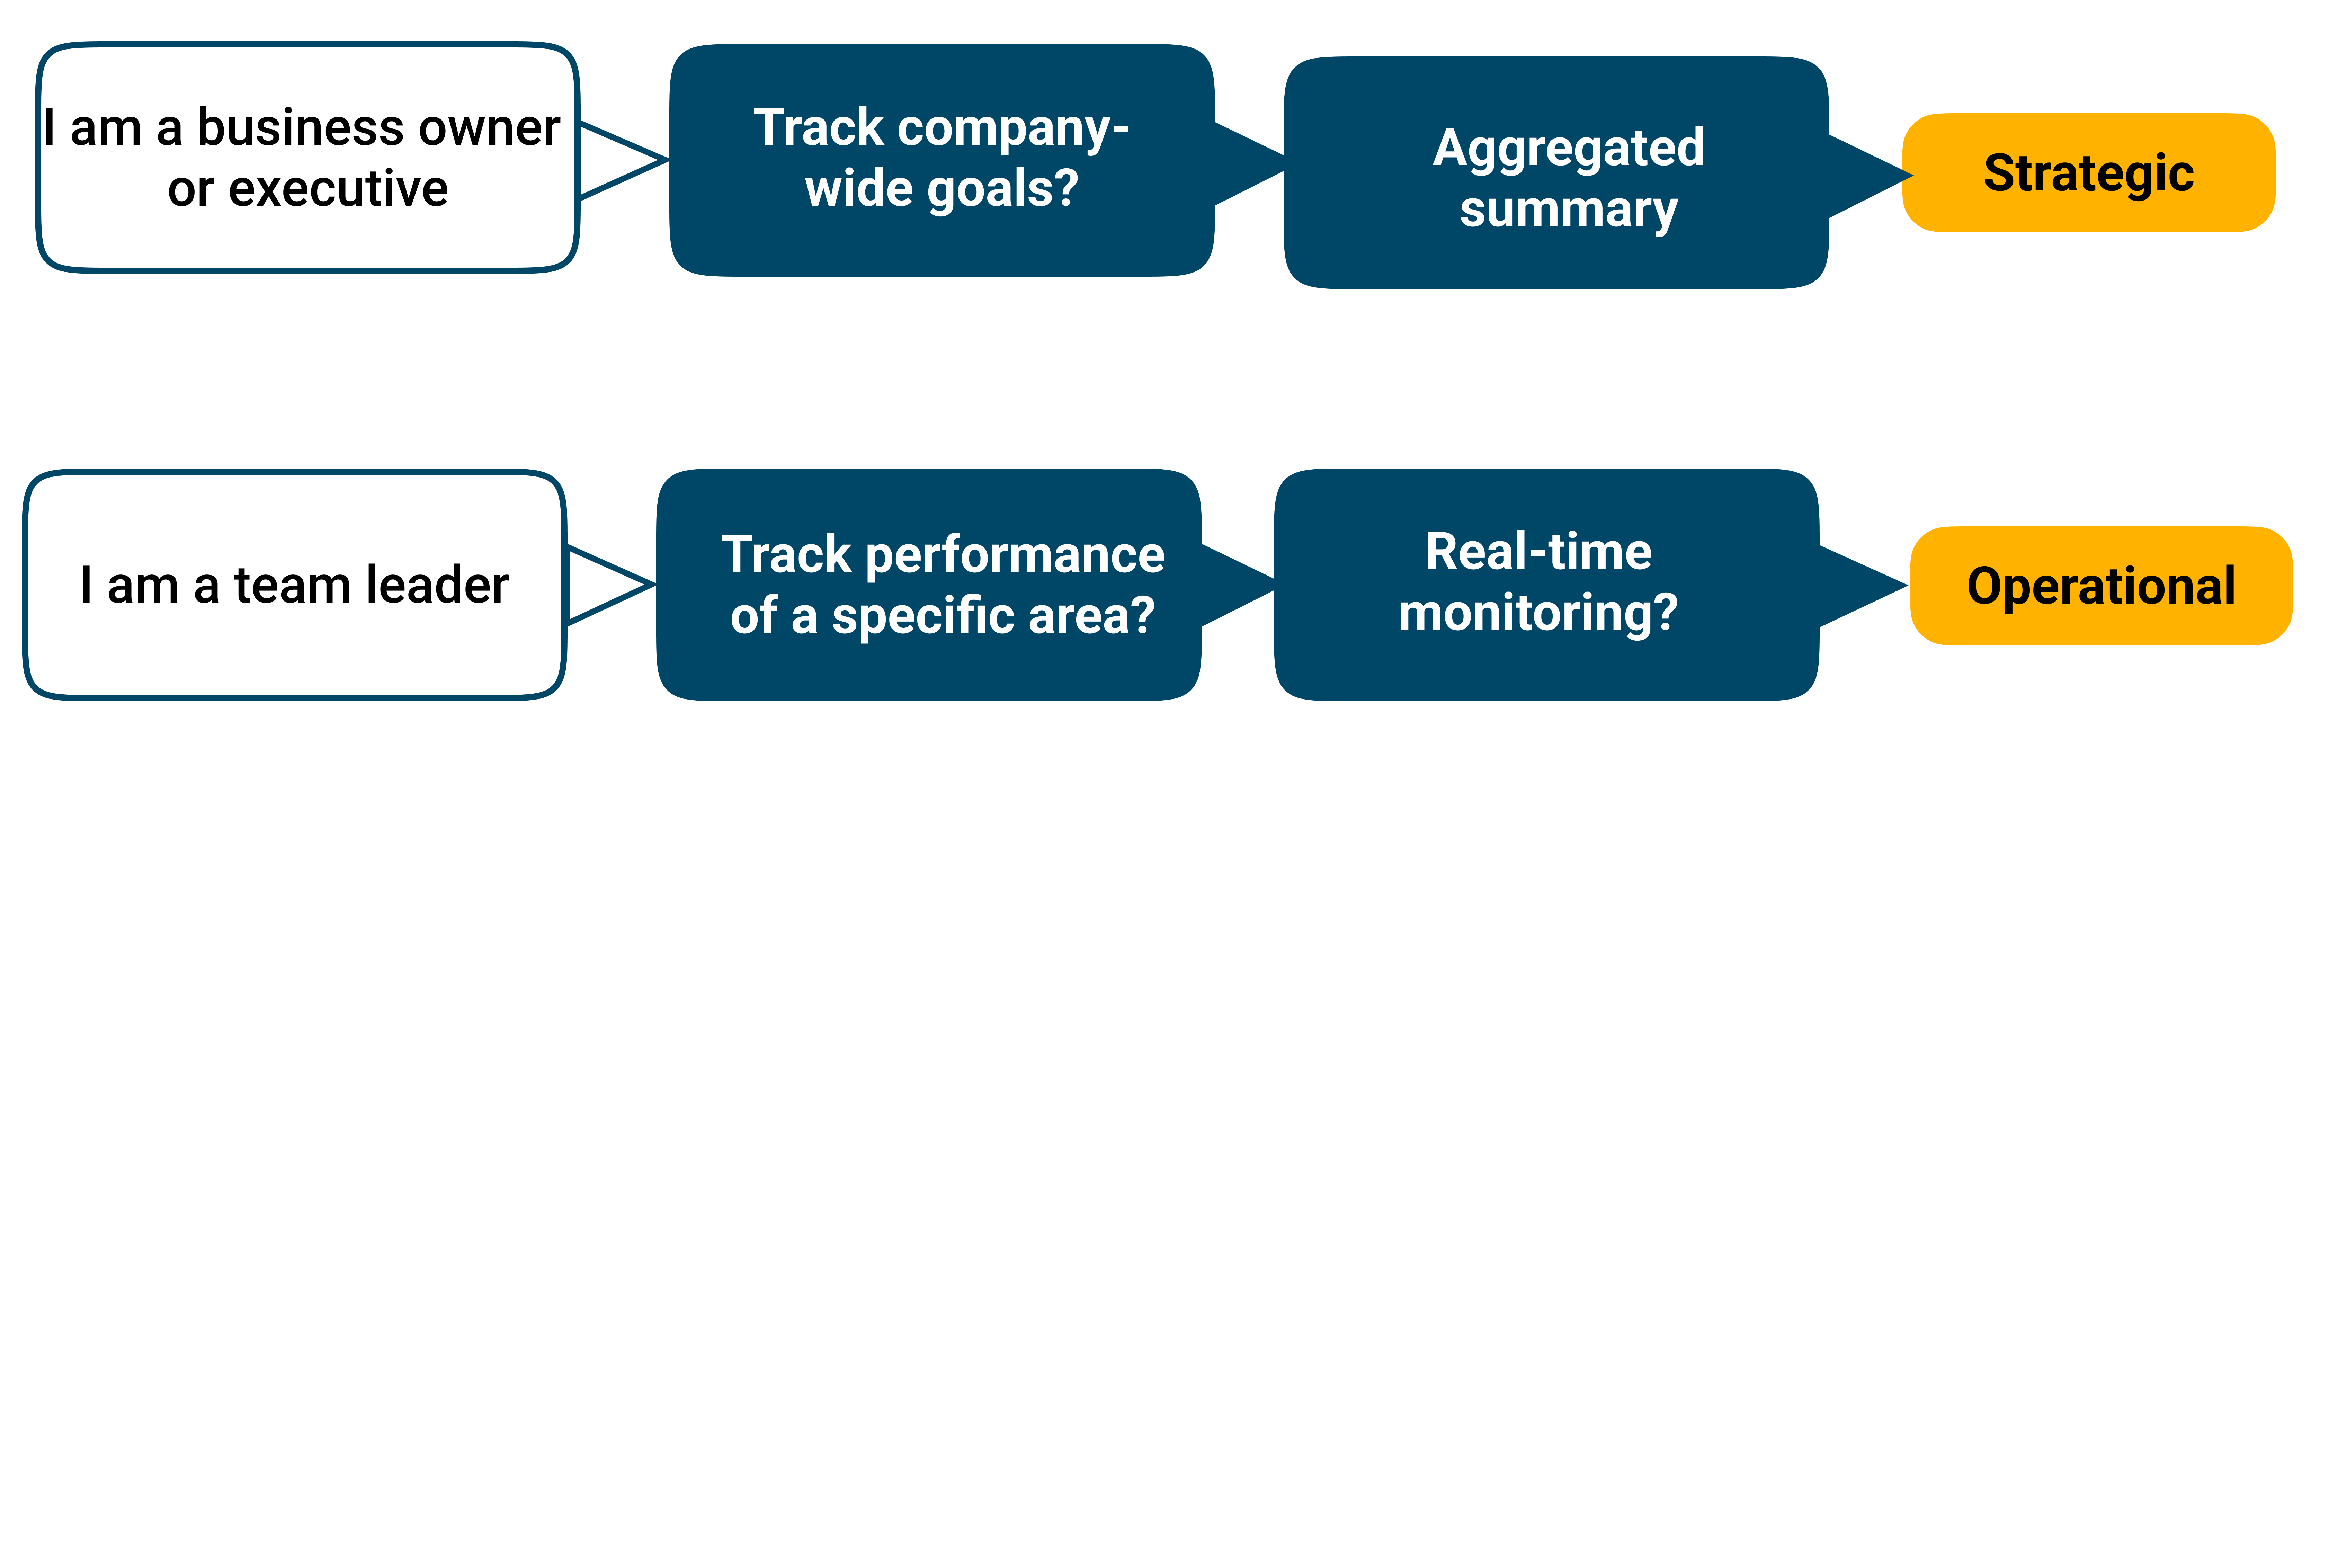
Key Takeaways
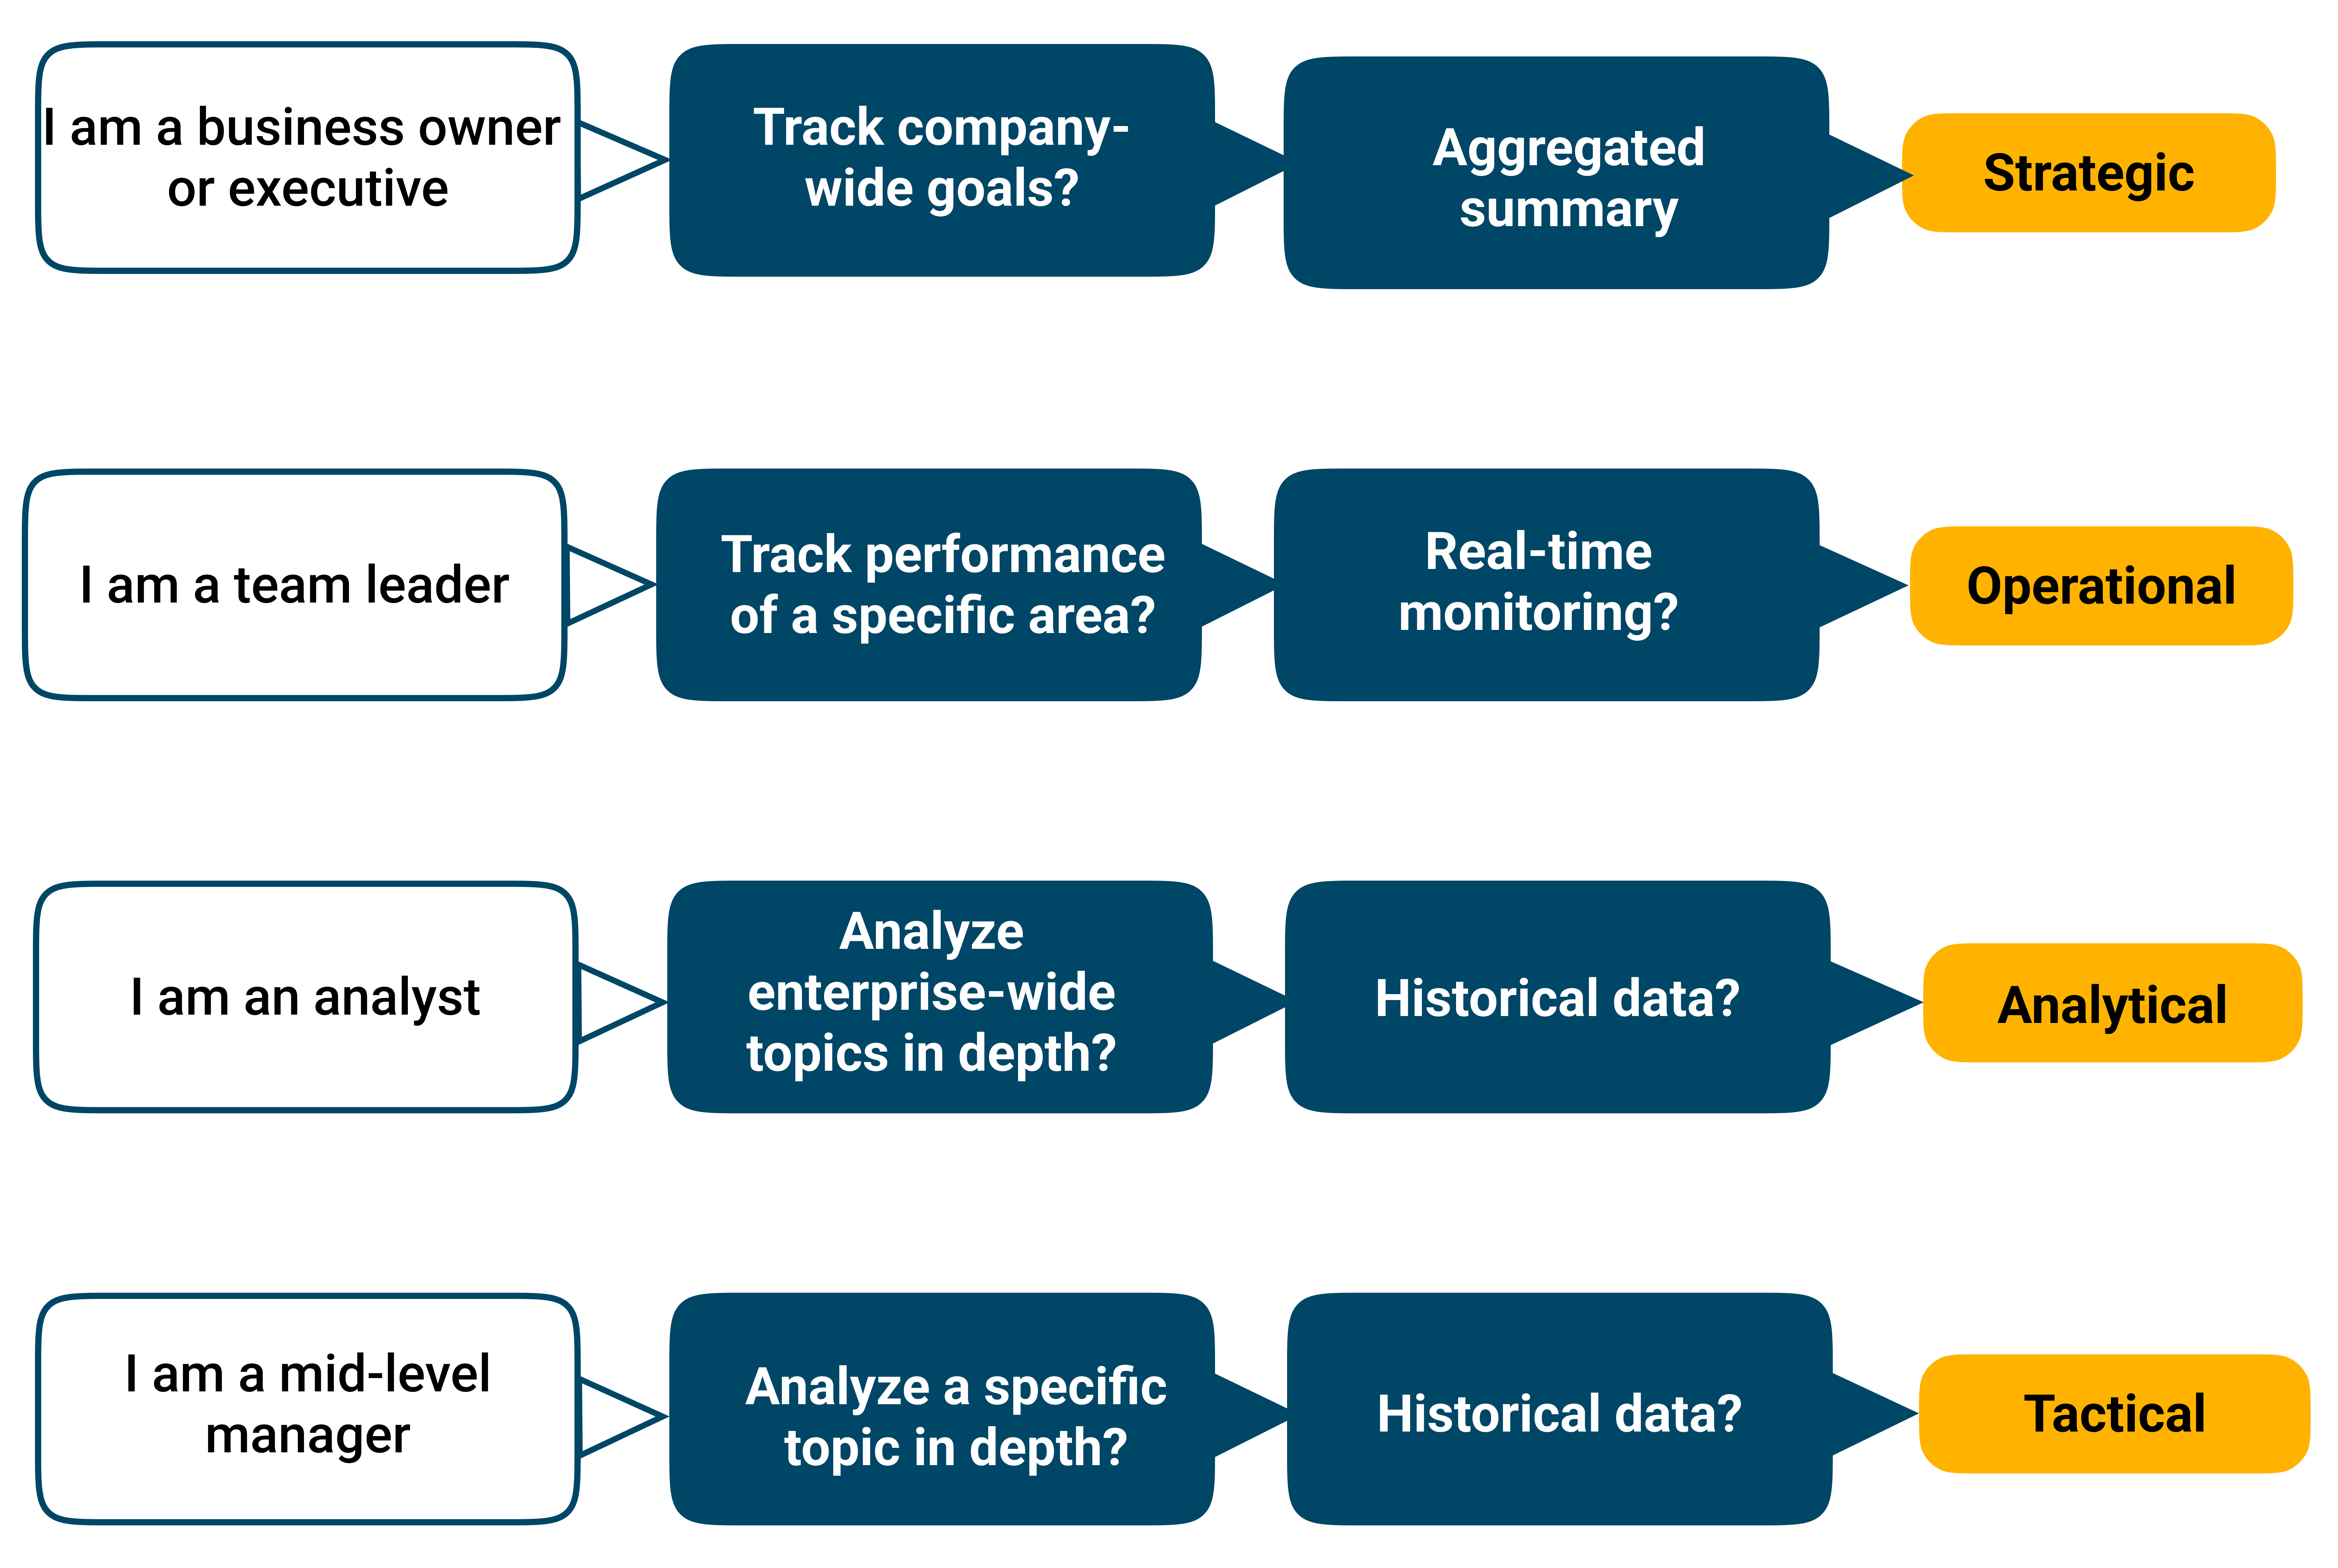
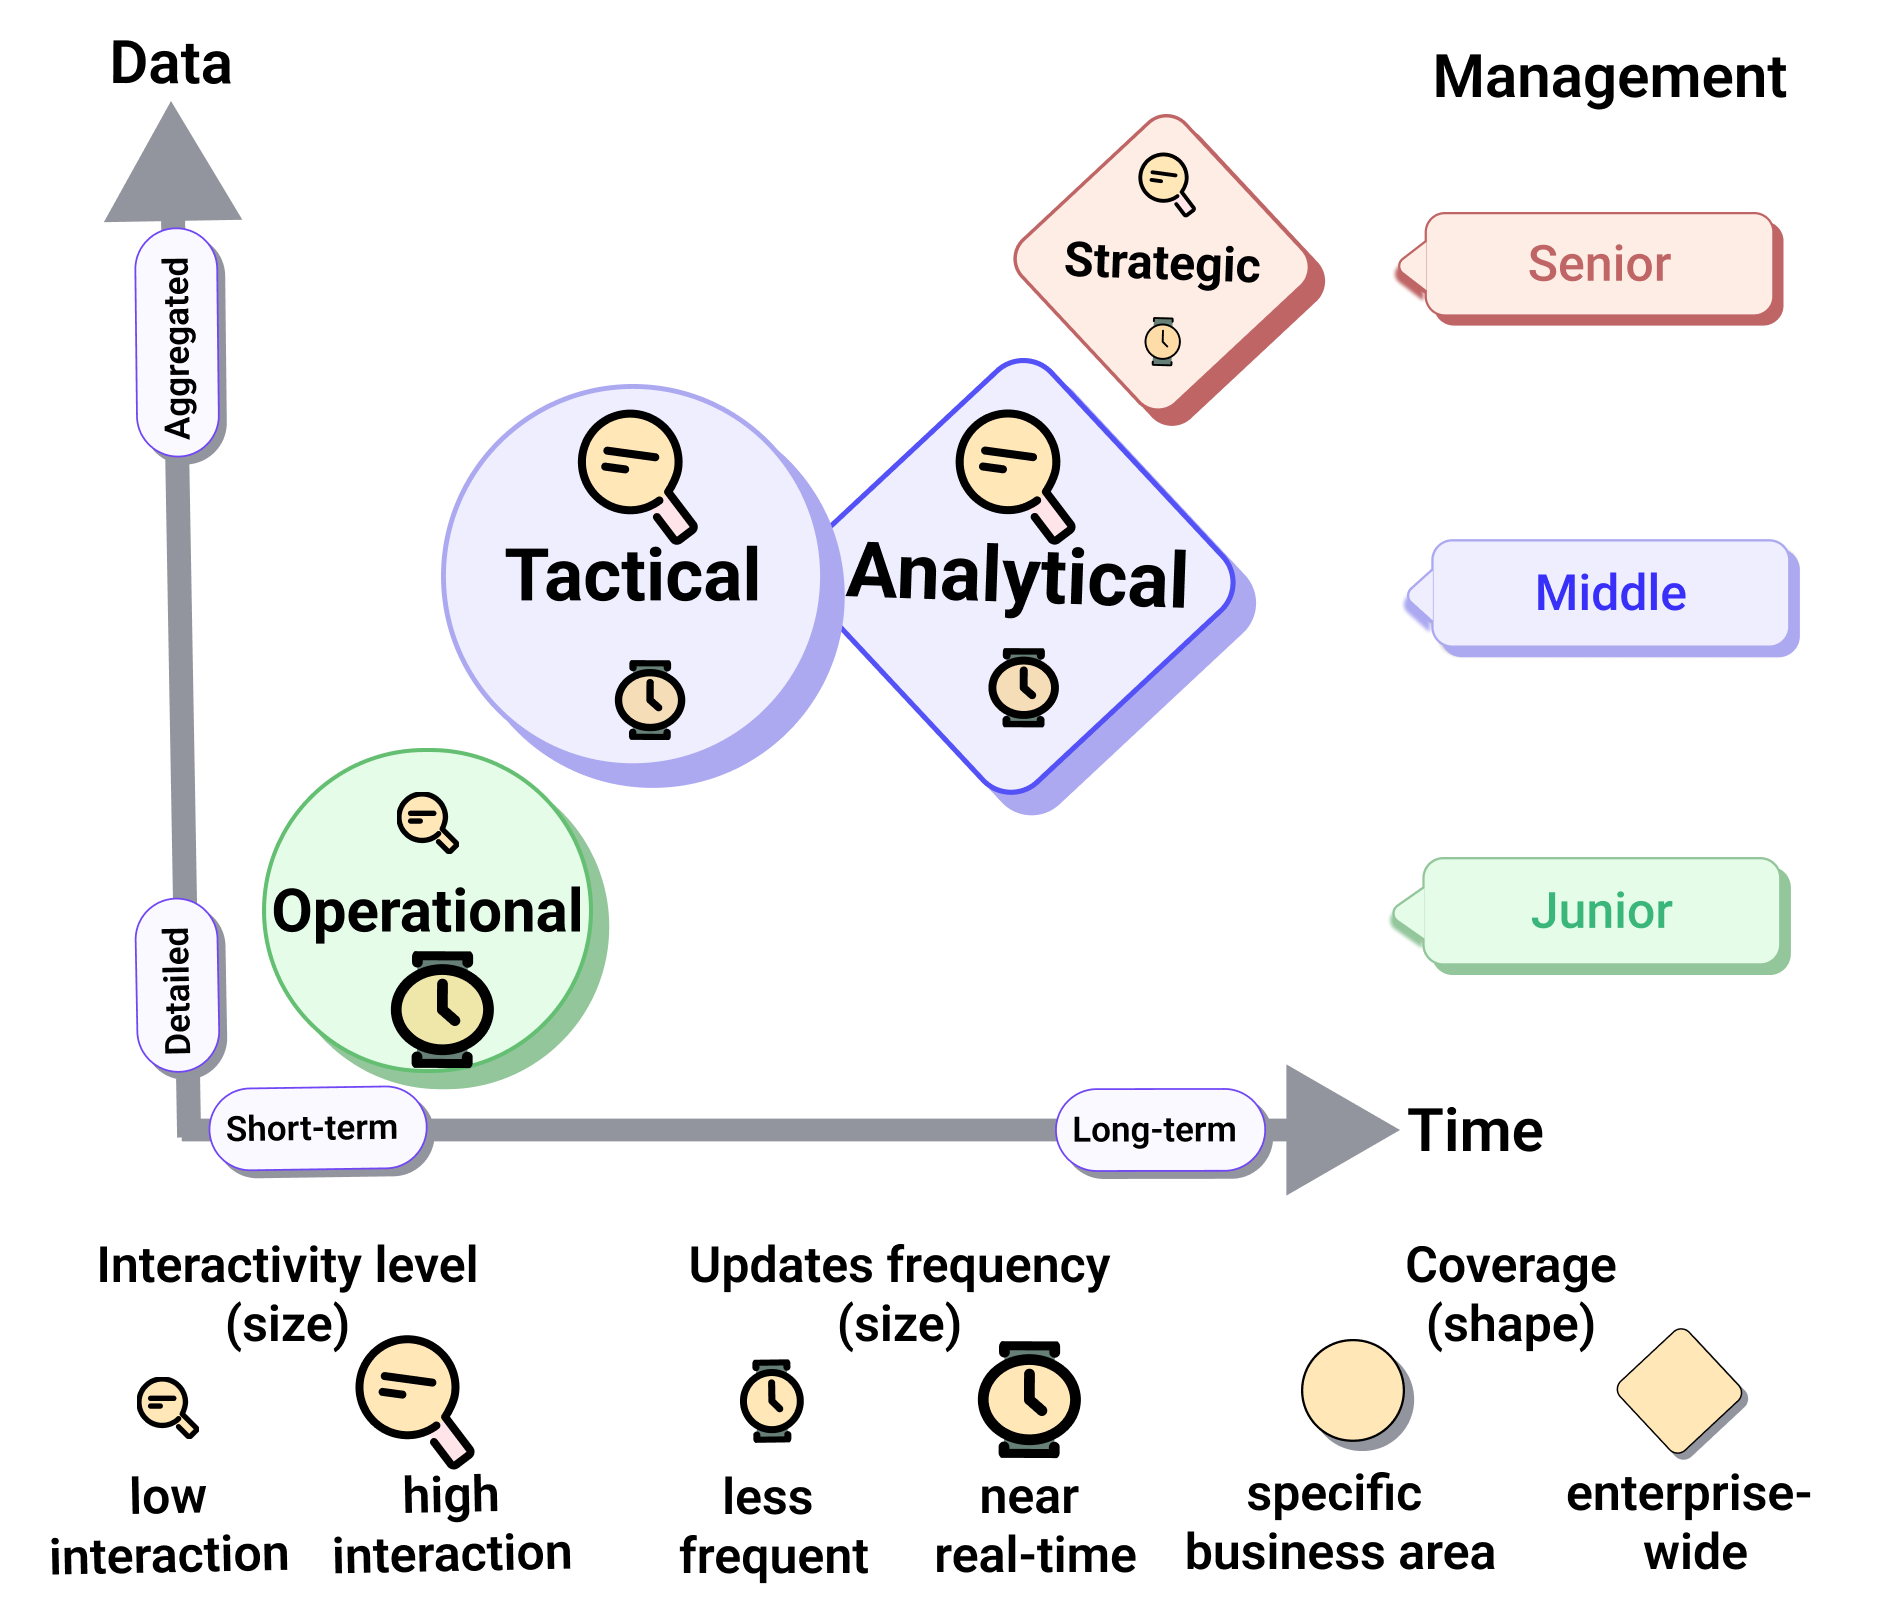
Each type: a different stakeholder and goal
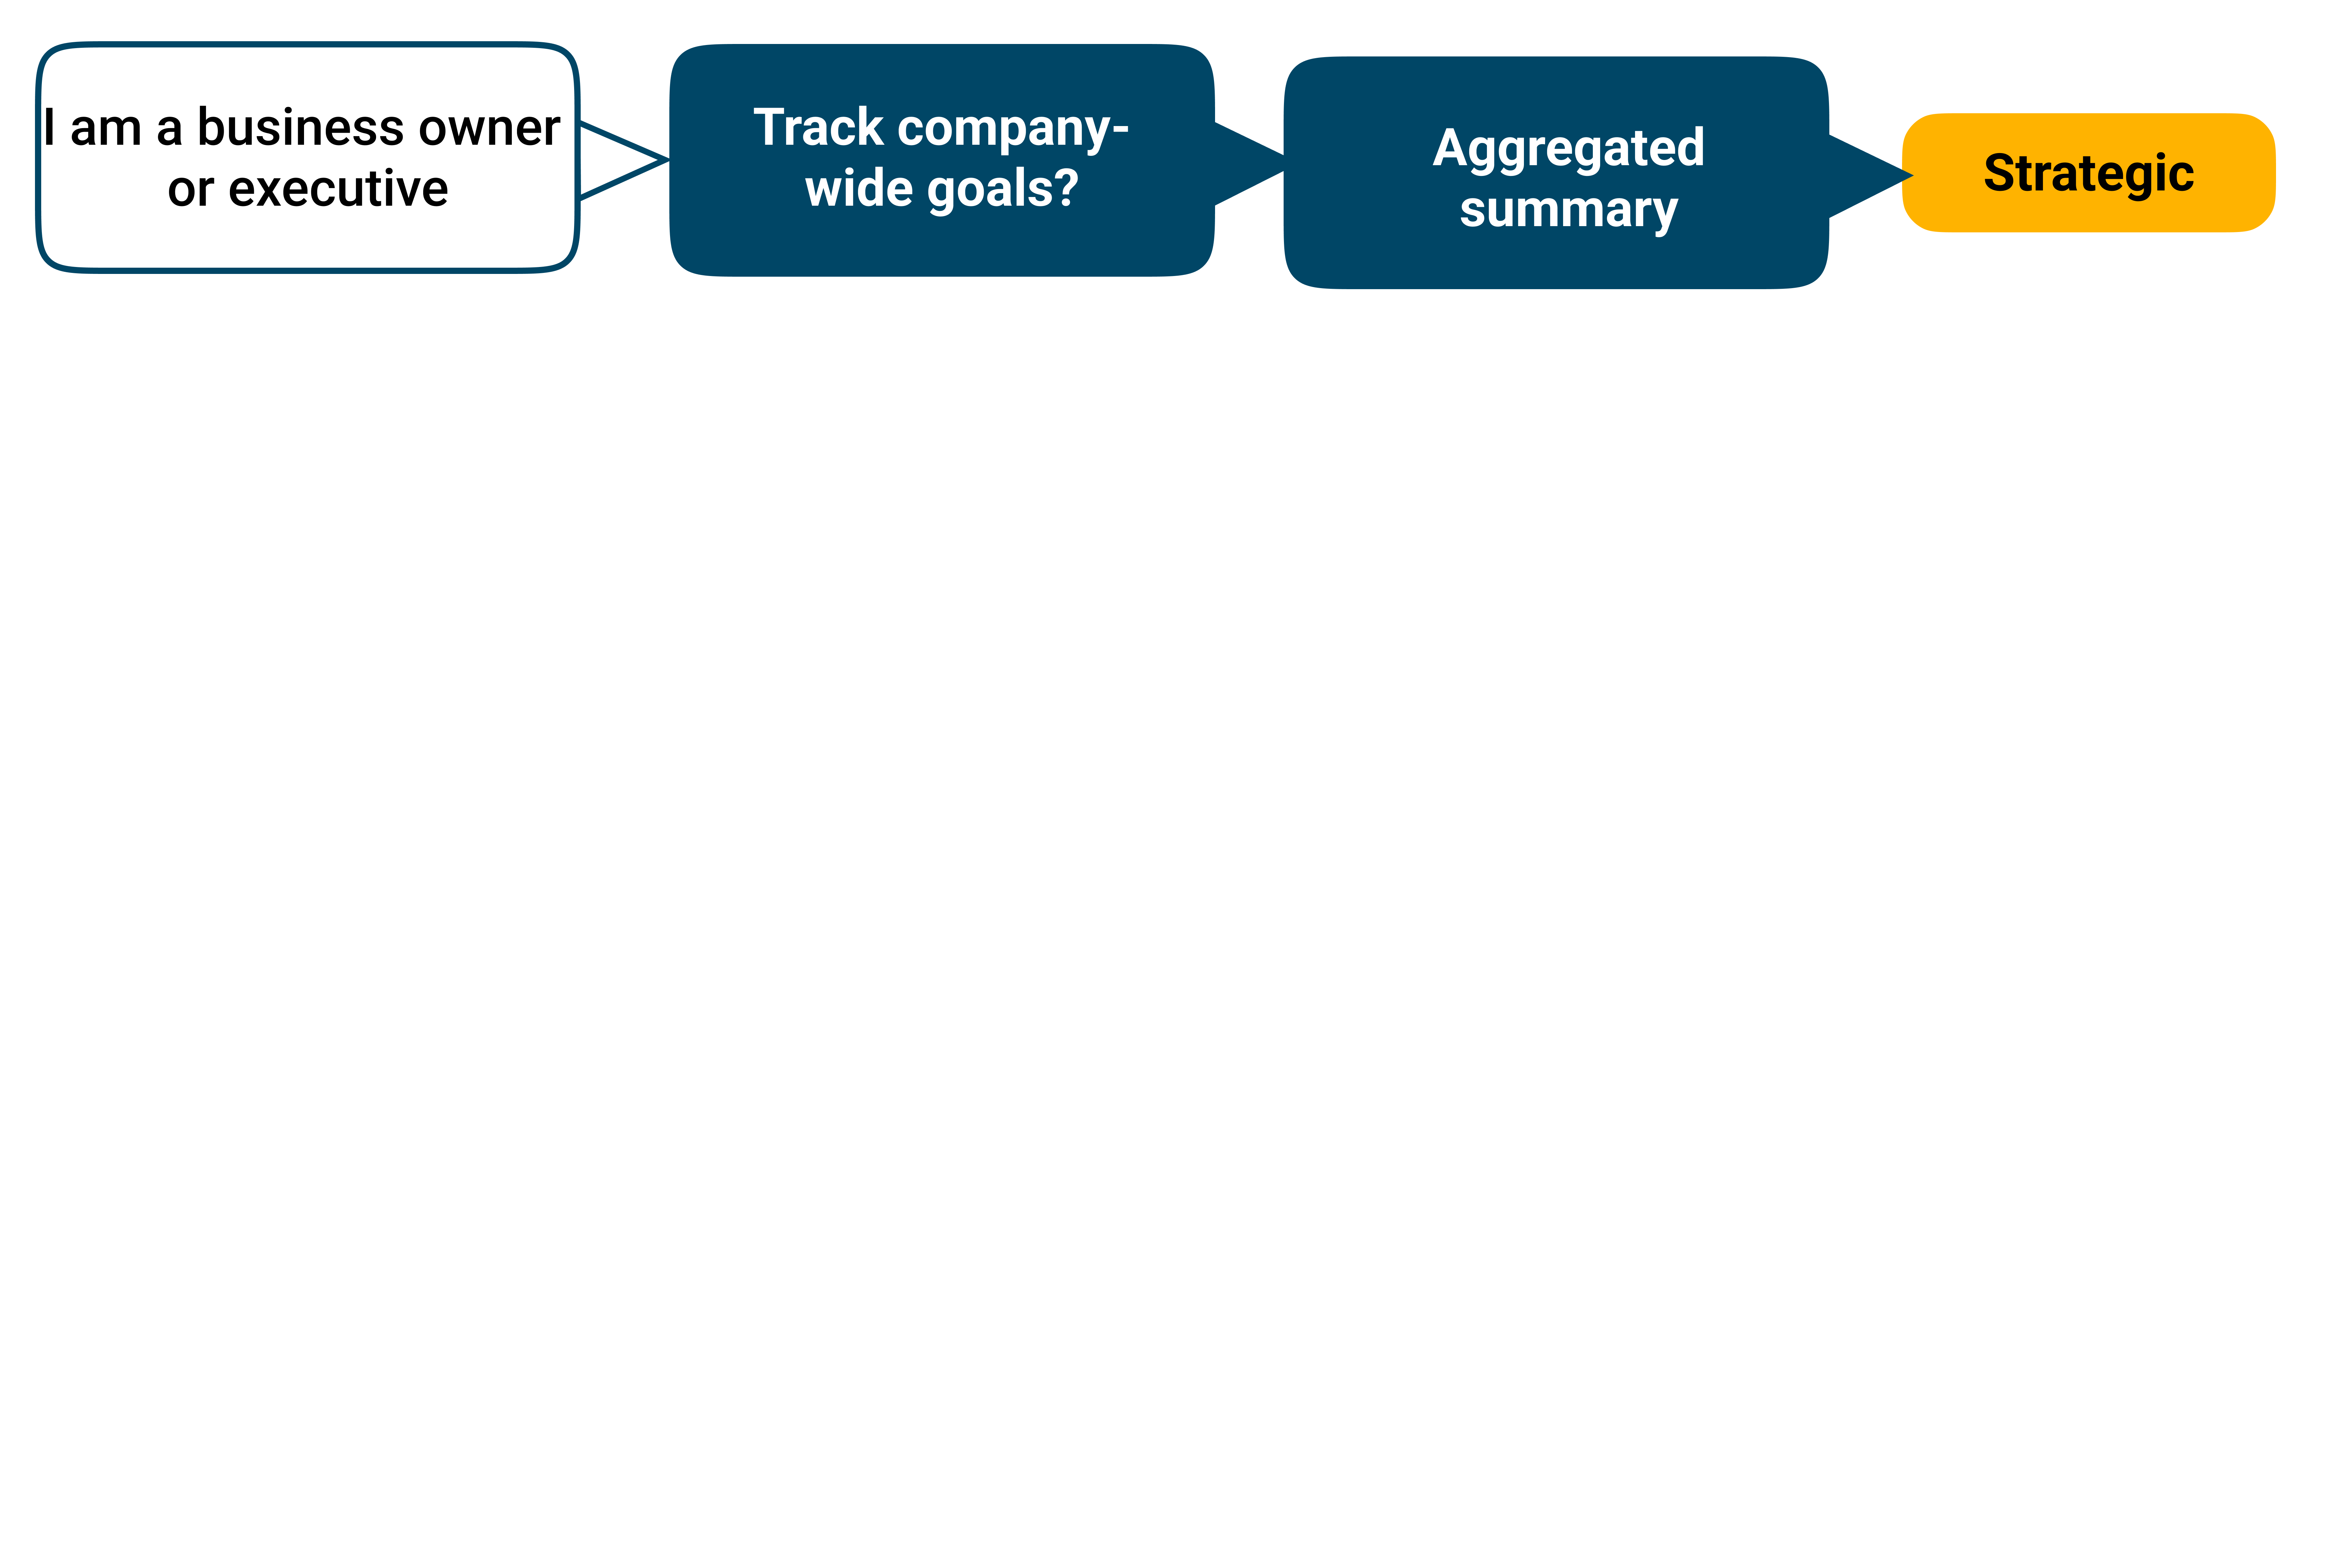
Key Takeaways
Each type: a different stakeholder and goal
Key Takeaways
Each type: a different stakeholder and goal
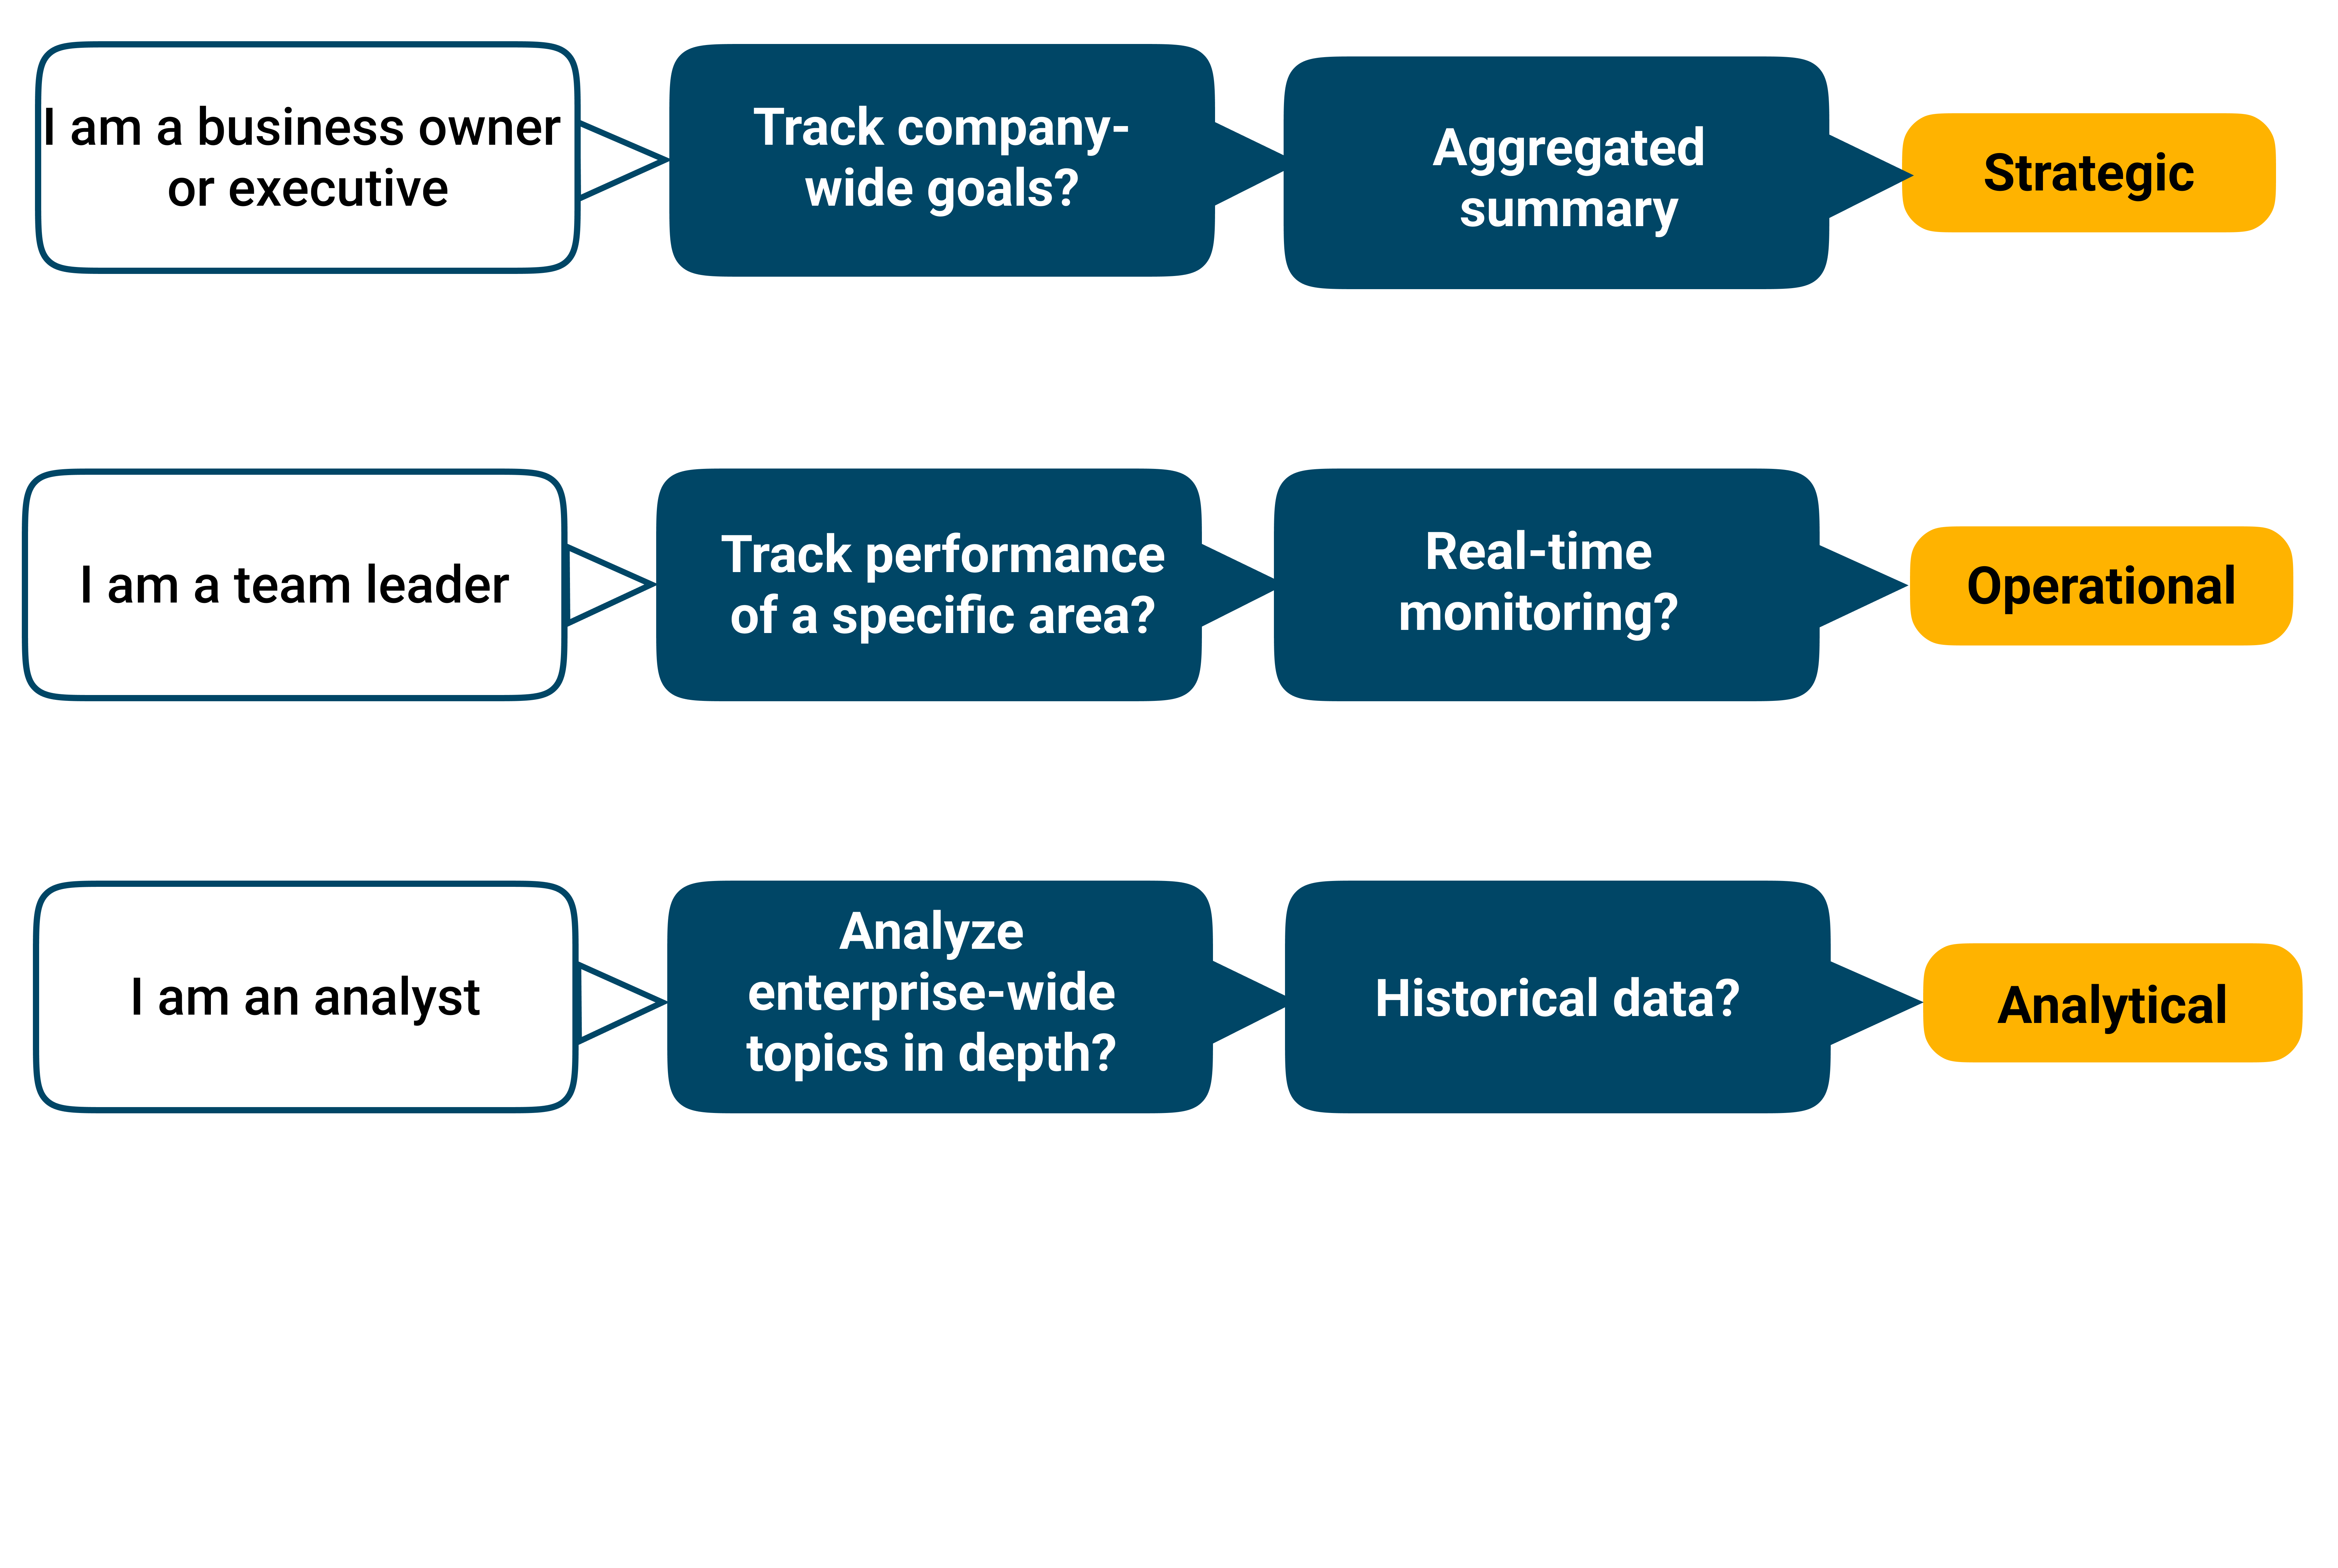
Key Takeaways
Each type: a different stakeholder and goal