Principles of visual analytics
Dashboard Design Concepts

Olga Scrivner, PhD
President, Scrivner Solutions Inc
Visual analytics
Information design Data visualization
Methods to make data meaningful Visual methods of displaying data

Visual analytics
Information design Data visualization
Methods to make data meaningful Visual methods of displaying data
Visual analytics
Information design Data visualization
Methods to make data meaningful Visual methods of displaying data
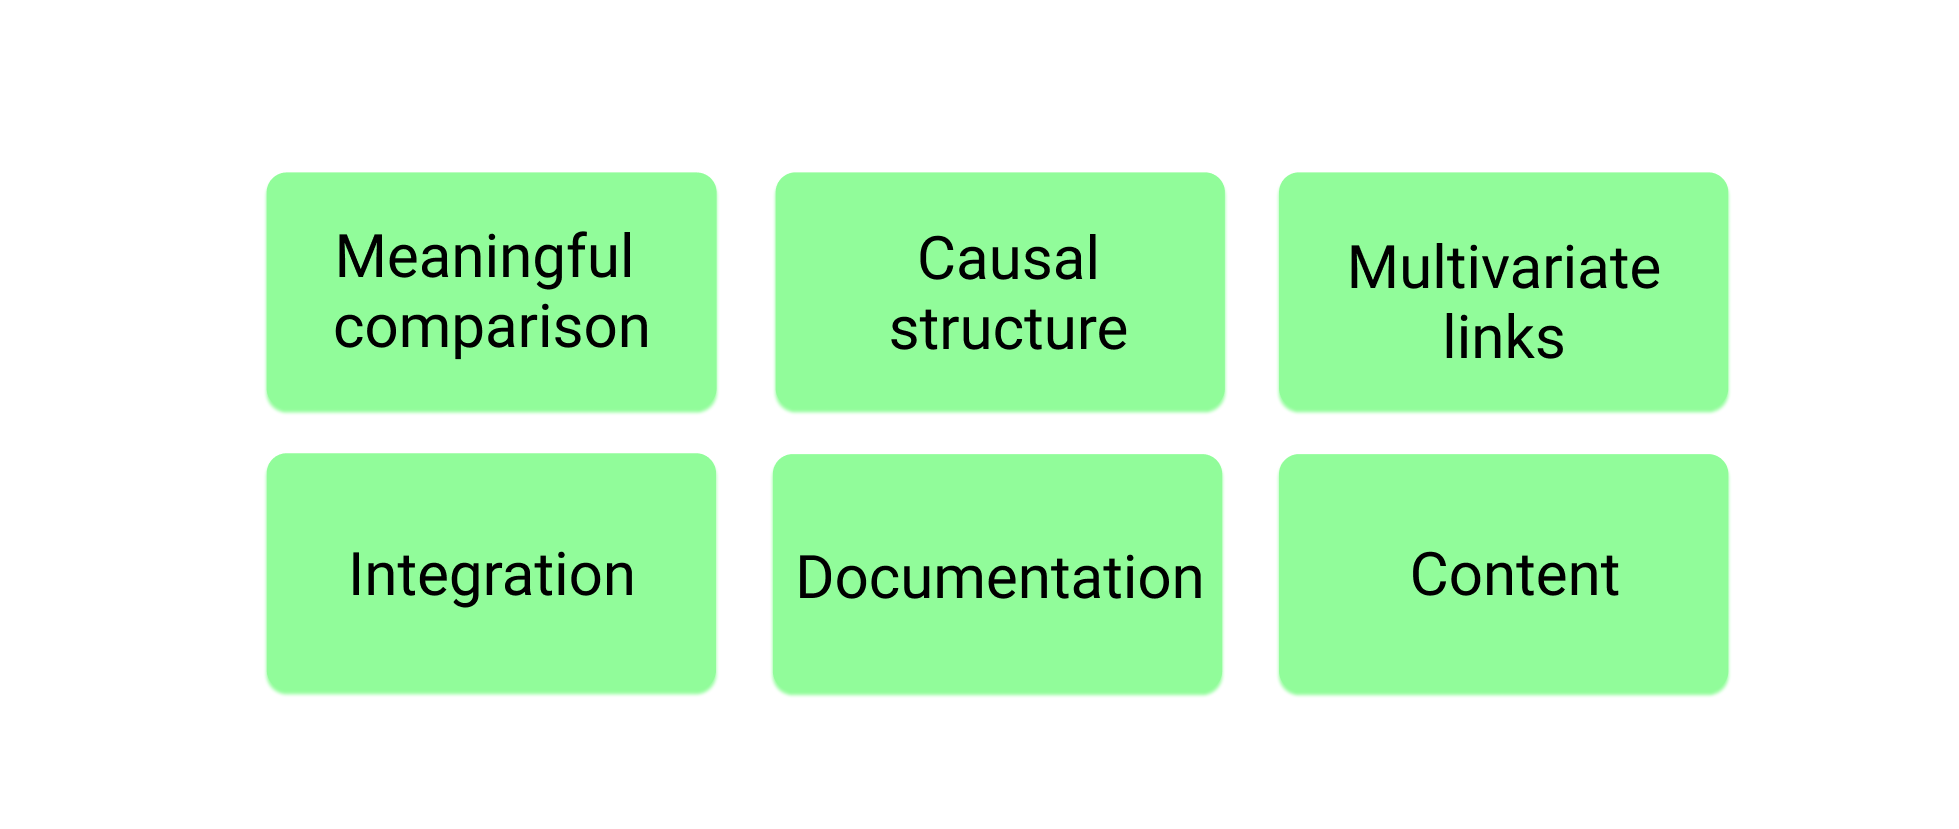
Fundamental principles of visual analytics
Principles of visual analytics are universal (Edward Tufte 2006)
Fundamental principles of visual analytics
Principles of visual analytics are universal (Edward Tufte 2006)
Fundamental principles of visual analytics
Principles of visual analytics are universal (Edward Tufte 2006)
Fundamental principles of visual analytics
Principles of visual analytics are universal (Edward Tufte 2006)
Fundamental principles of visual analytics
Principles of visual analytics are universal (Edward Tufte 2006)
Fundamental principles of visual analytics
Principles of visual analytics are universal (Edward Tufte 2006)
Fundamental principles of visual analytics
Principles of visual analytics are universal (Edward Tufte 2006)
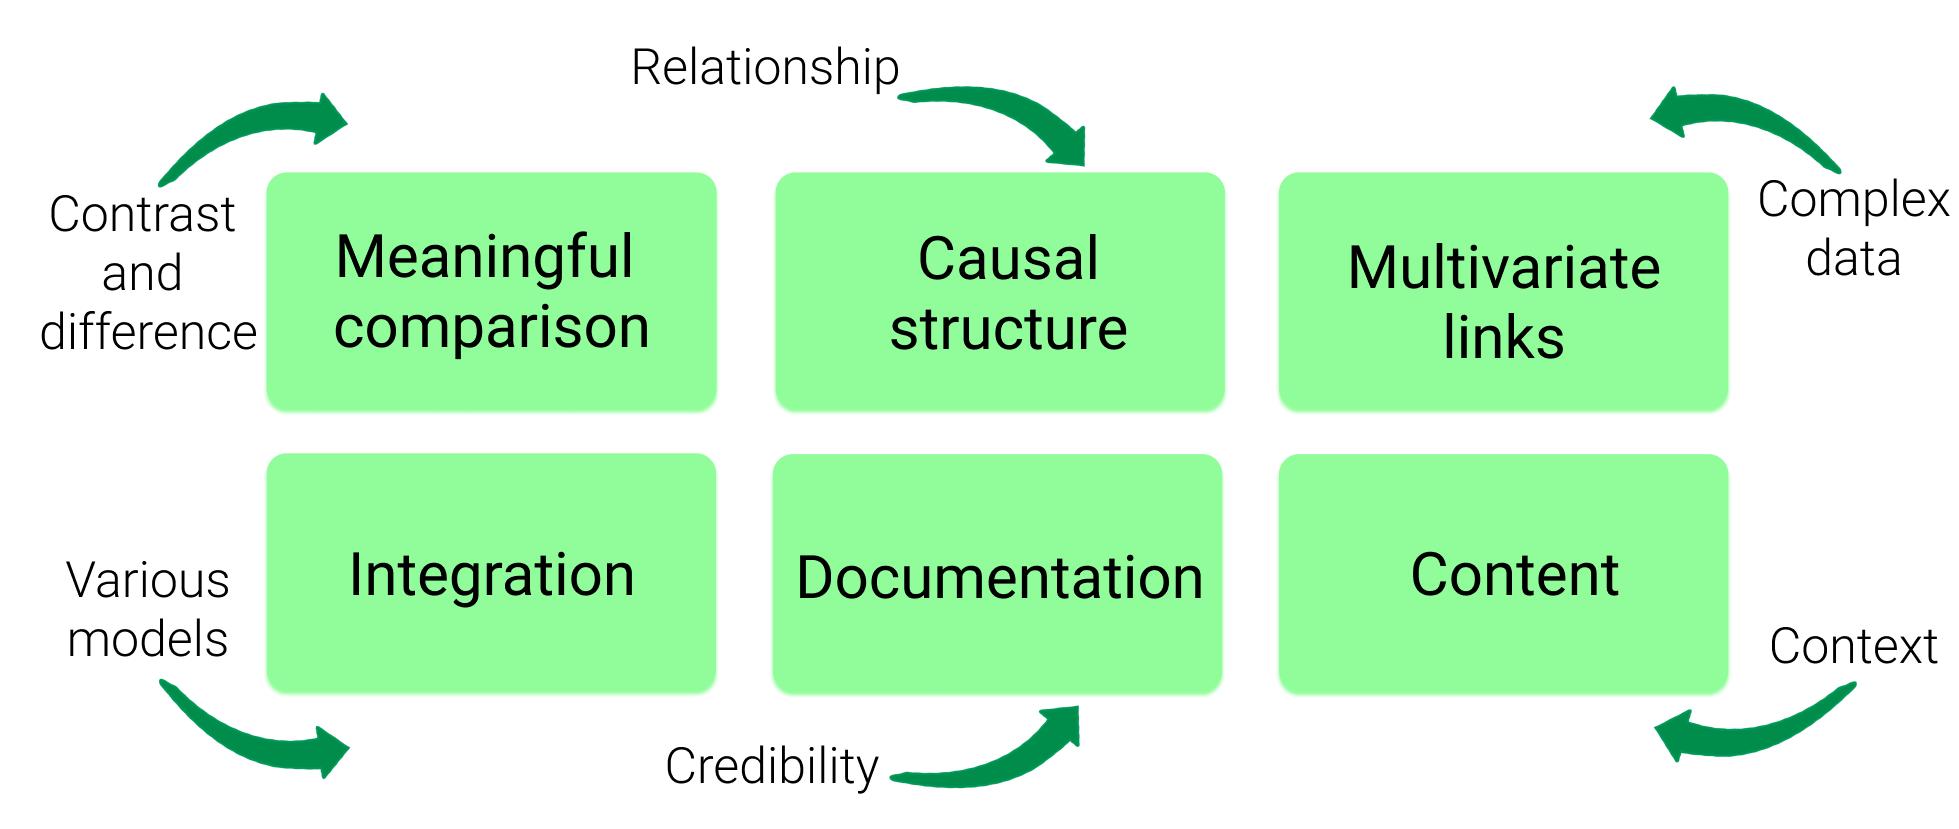
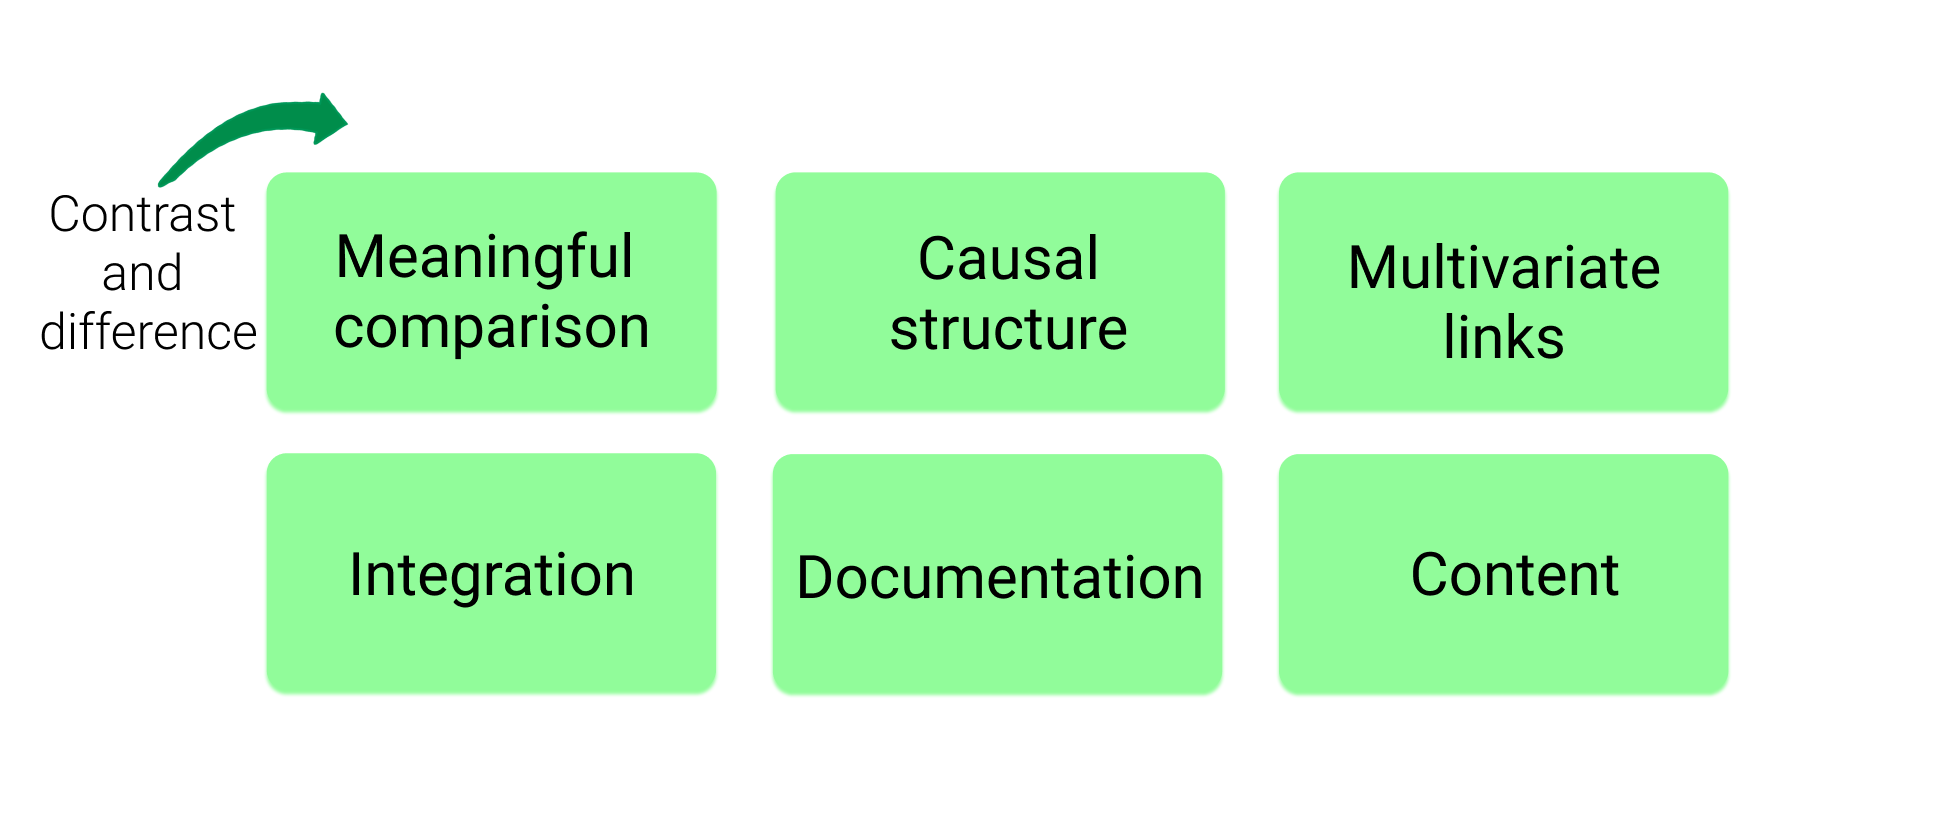
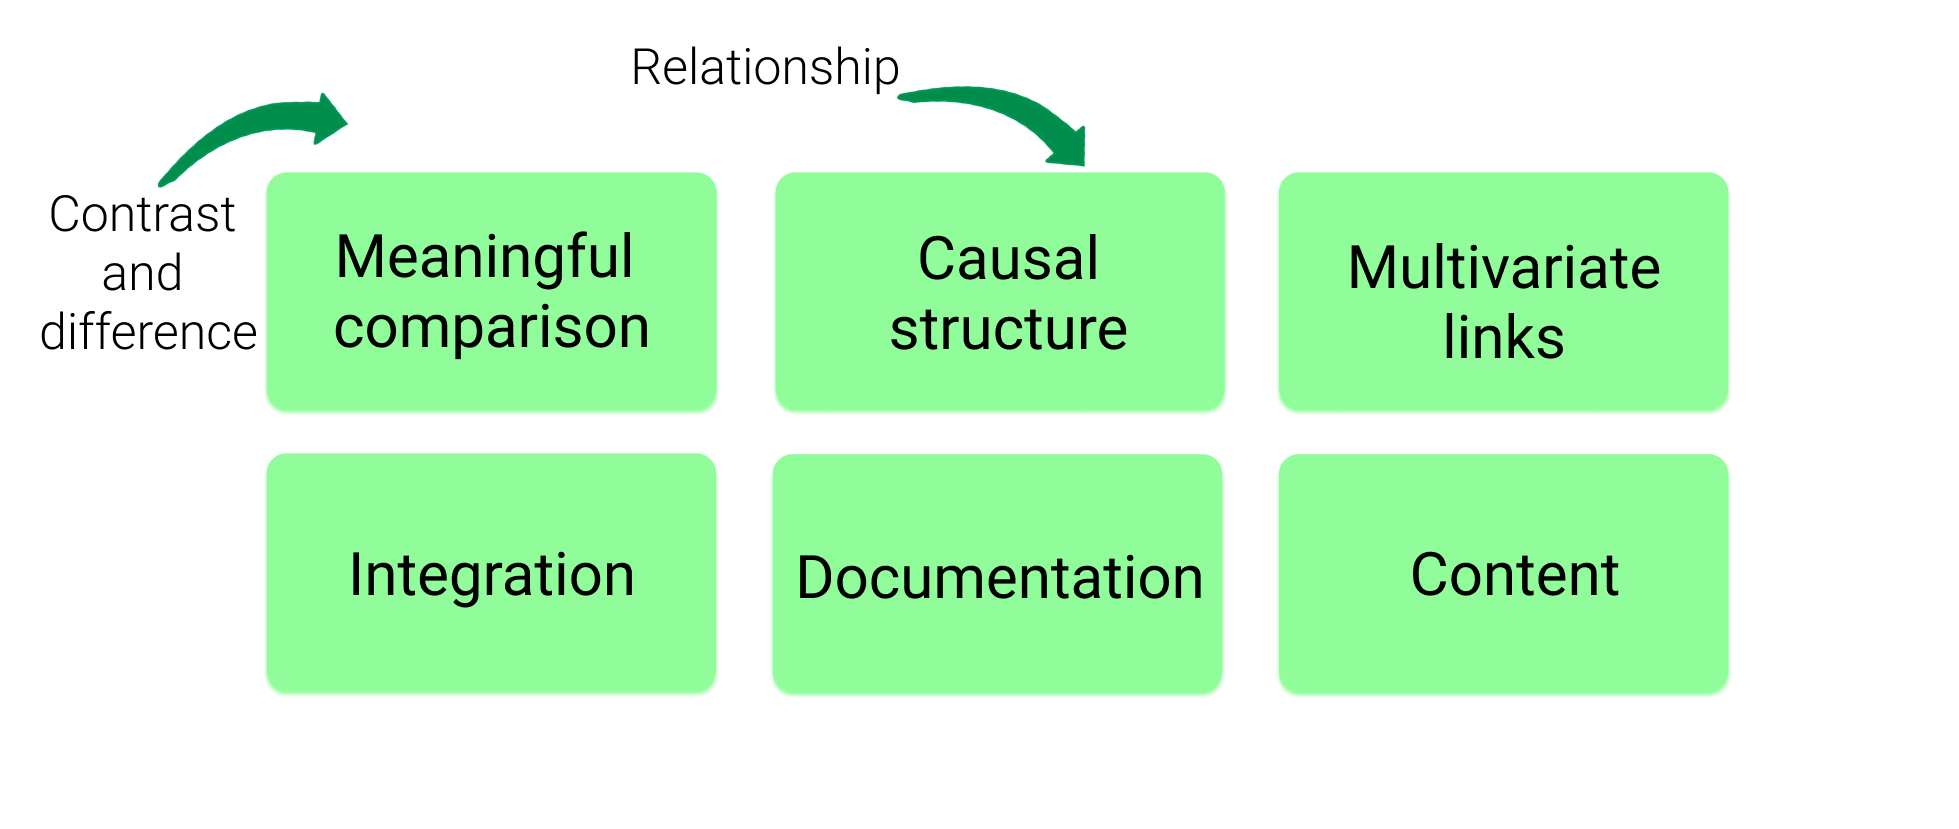
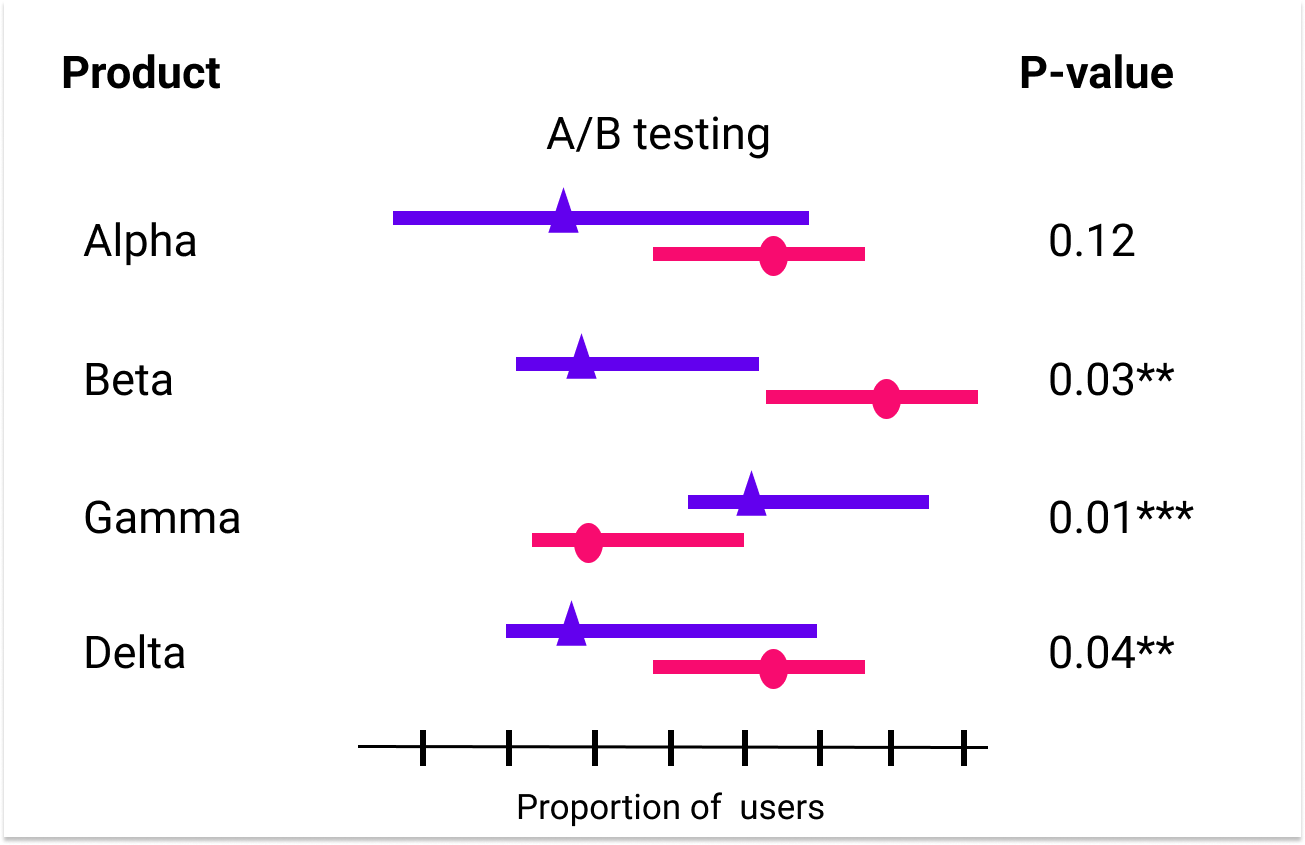
Comparison and contrast
Show comparisons, contrasts, differences
"Compared to what?"
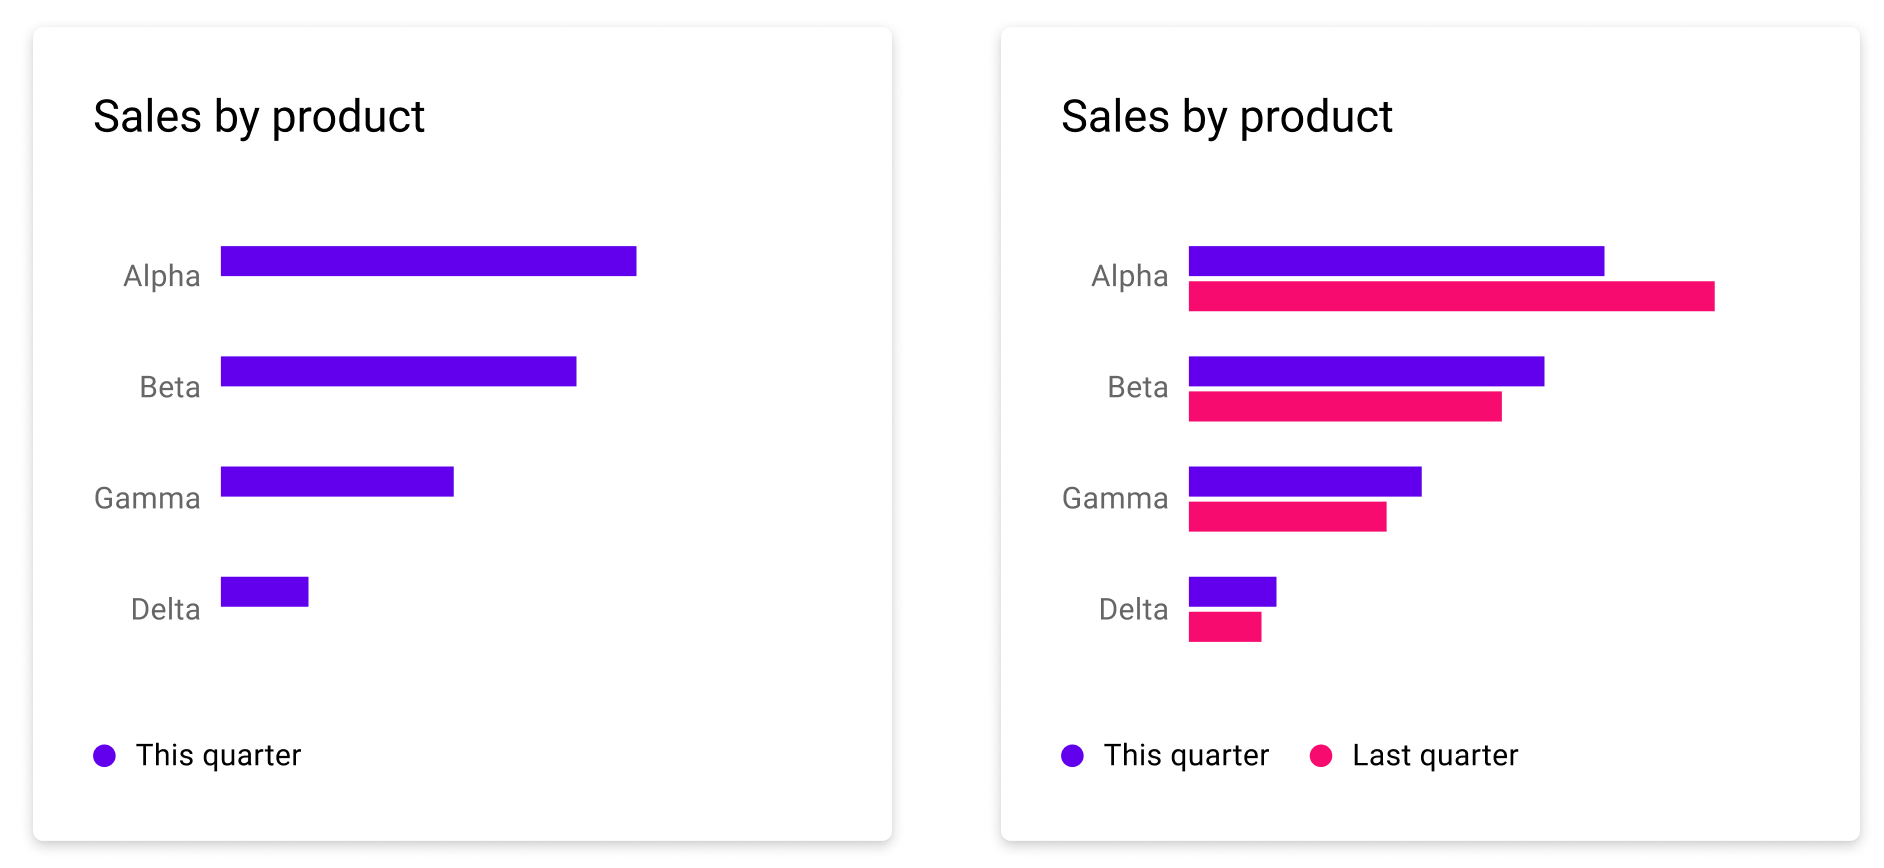
Not every comparison is meaningful
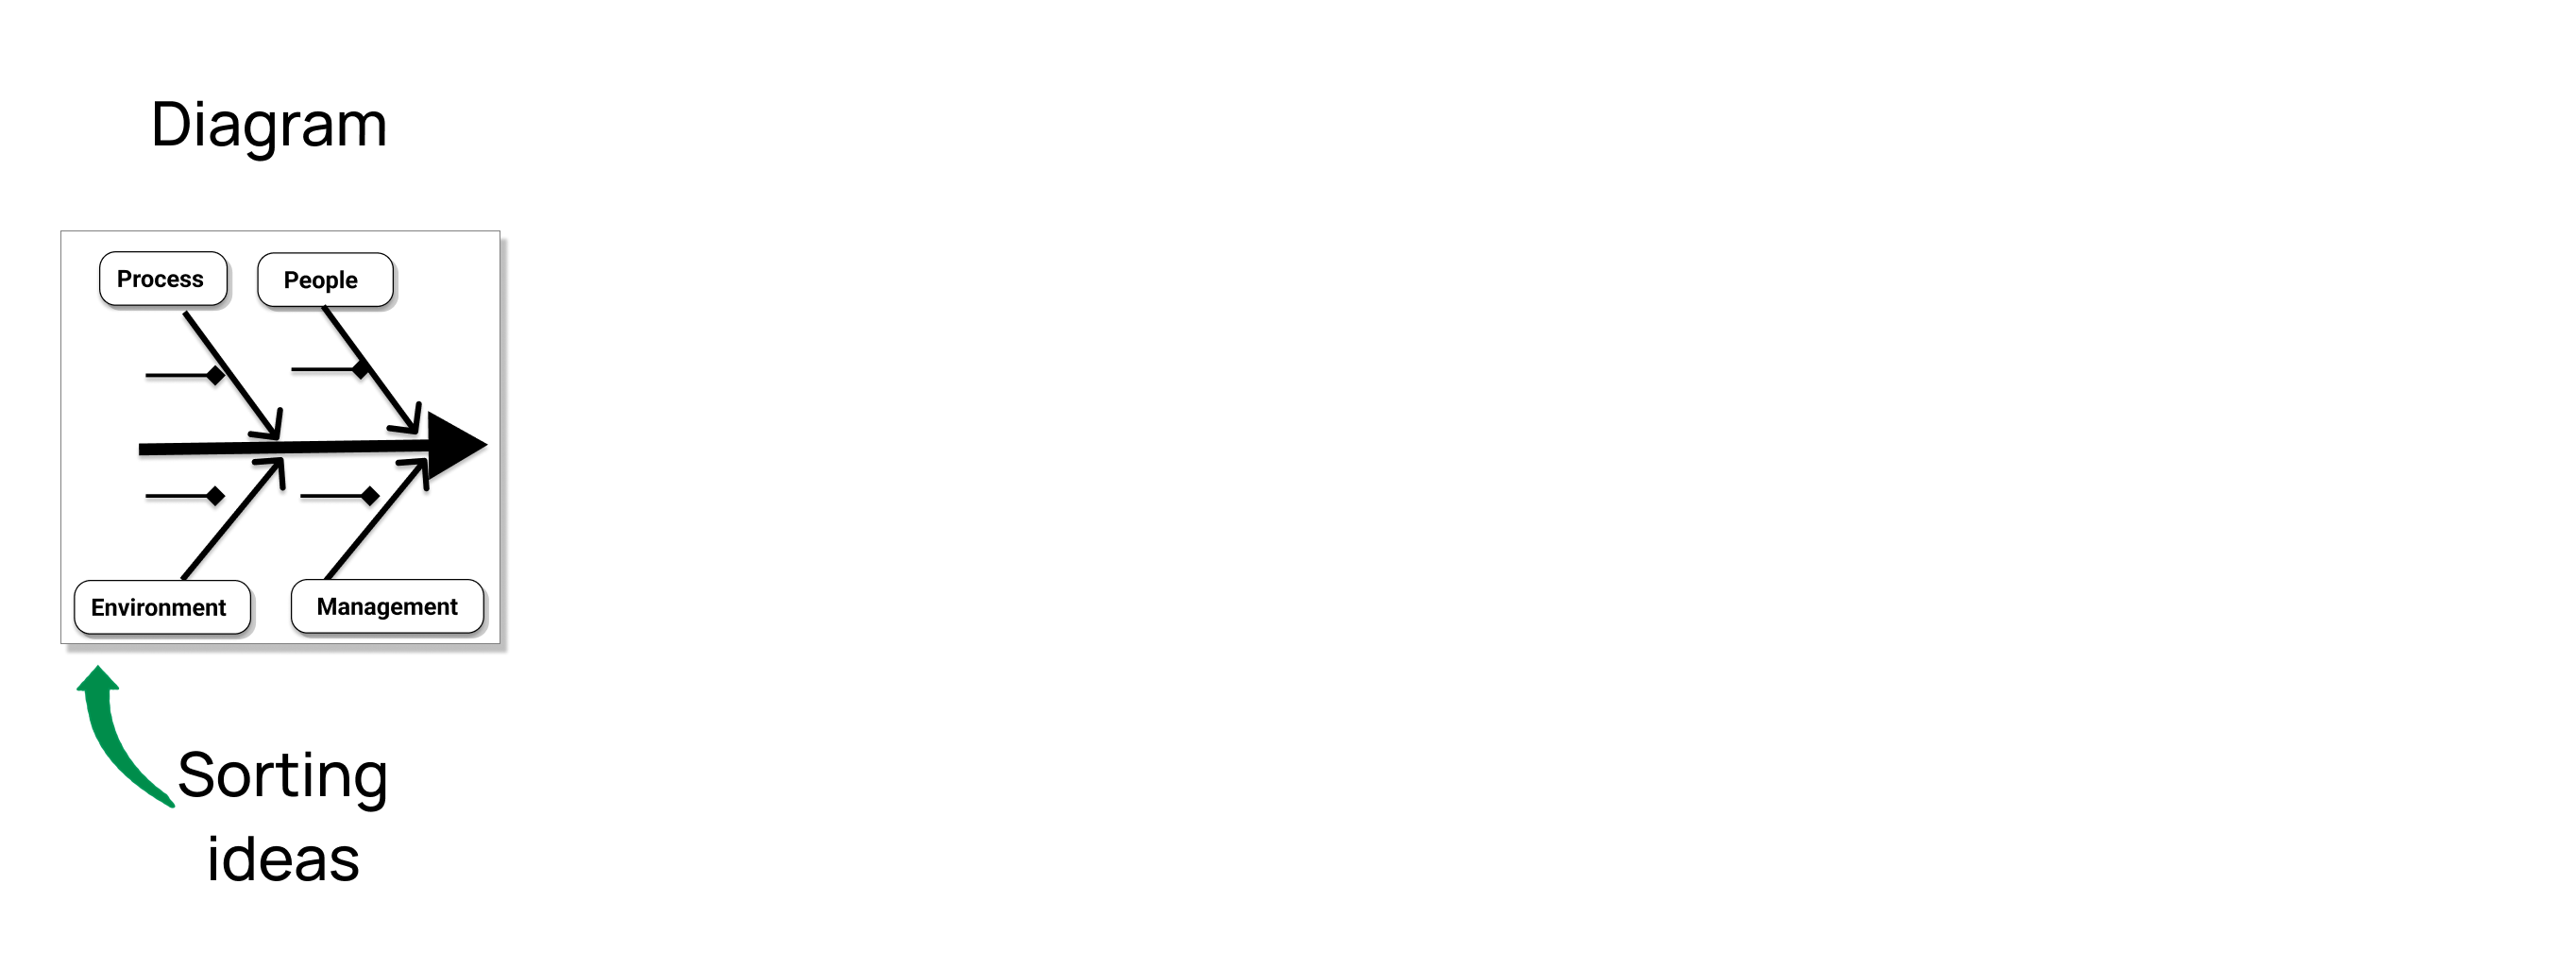
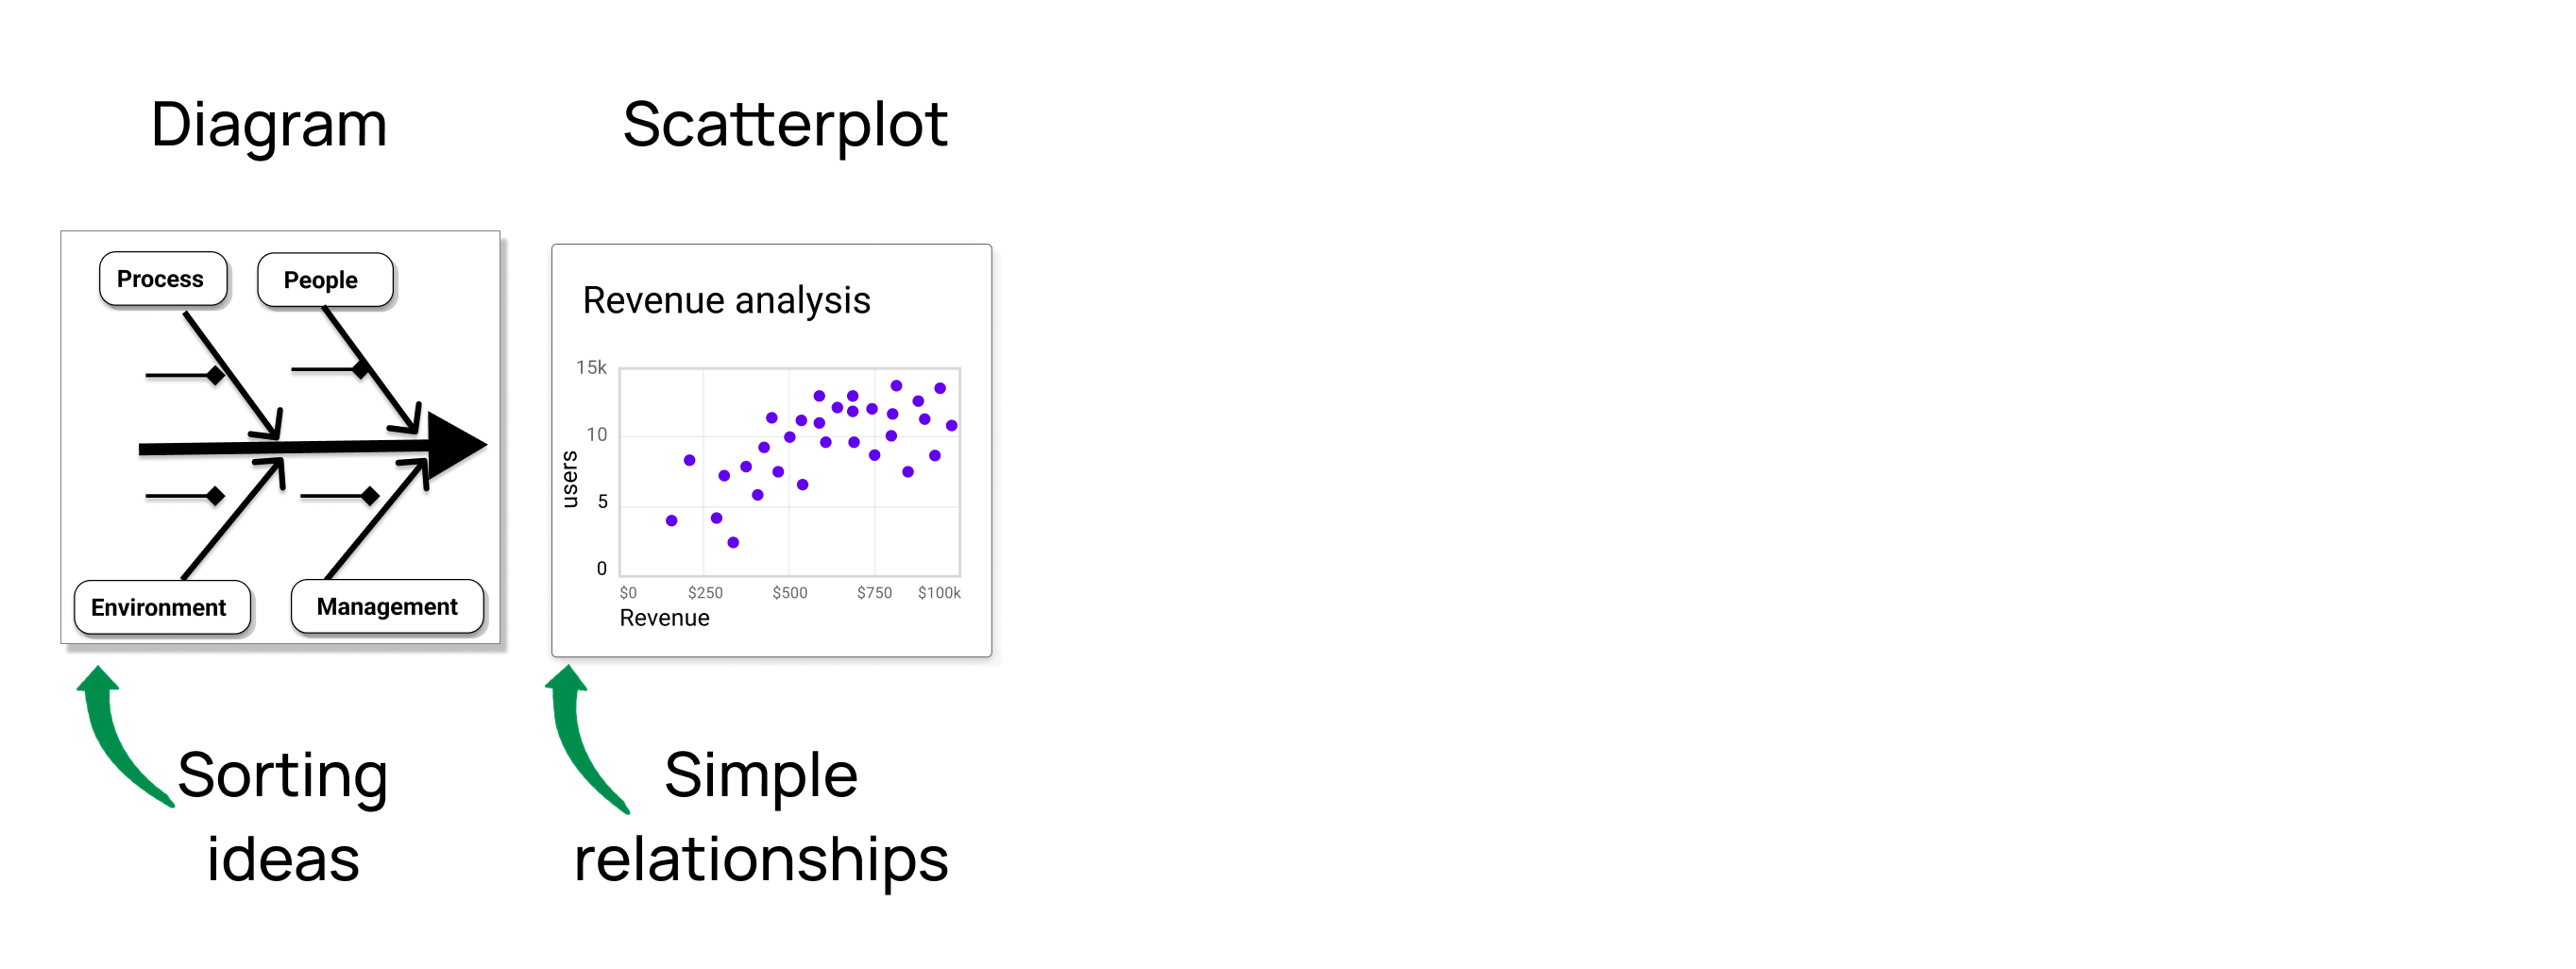
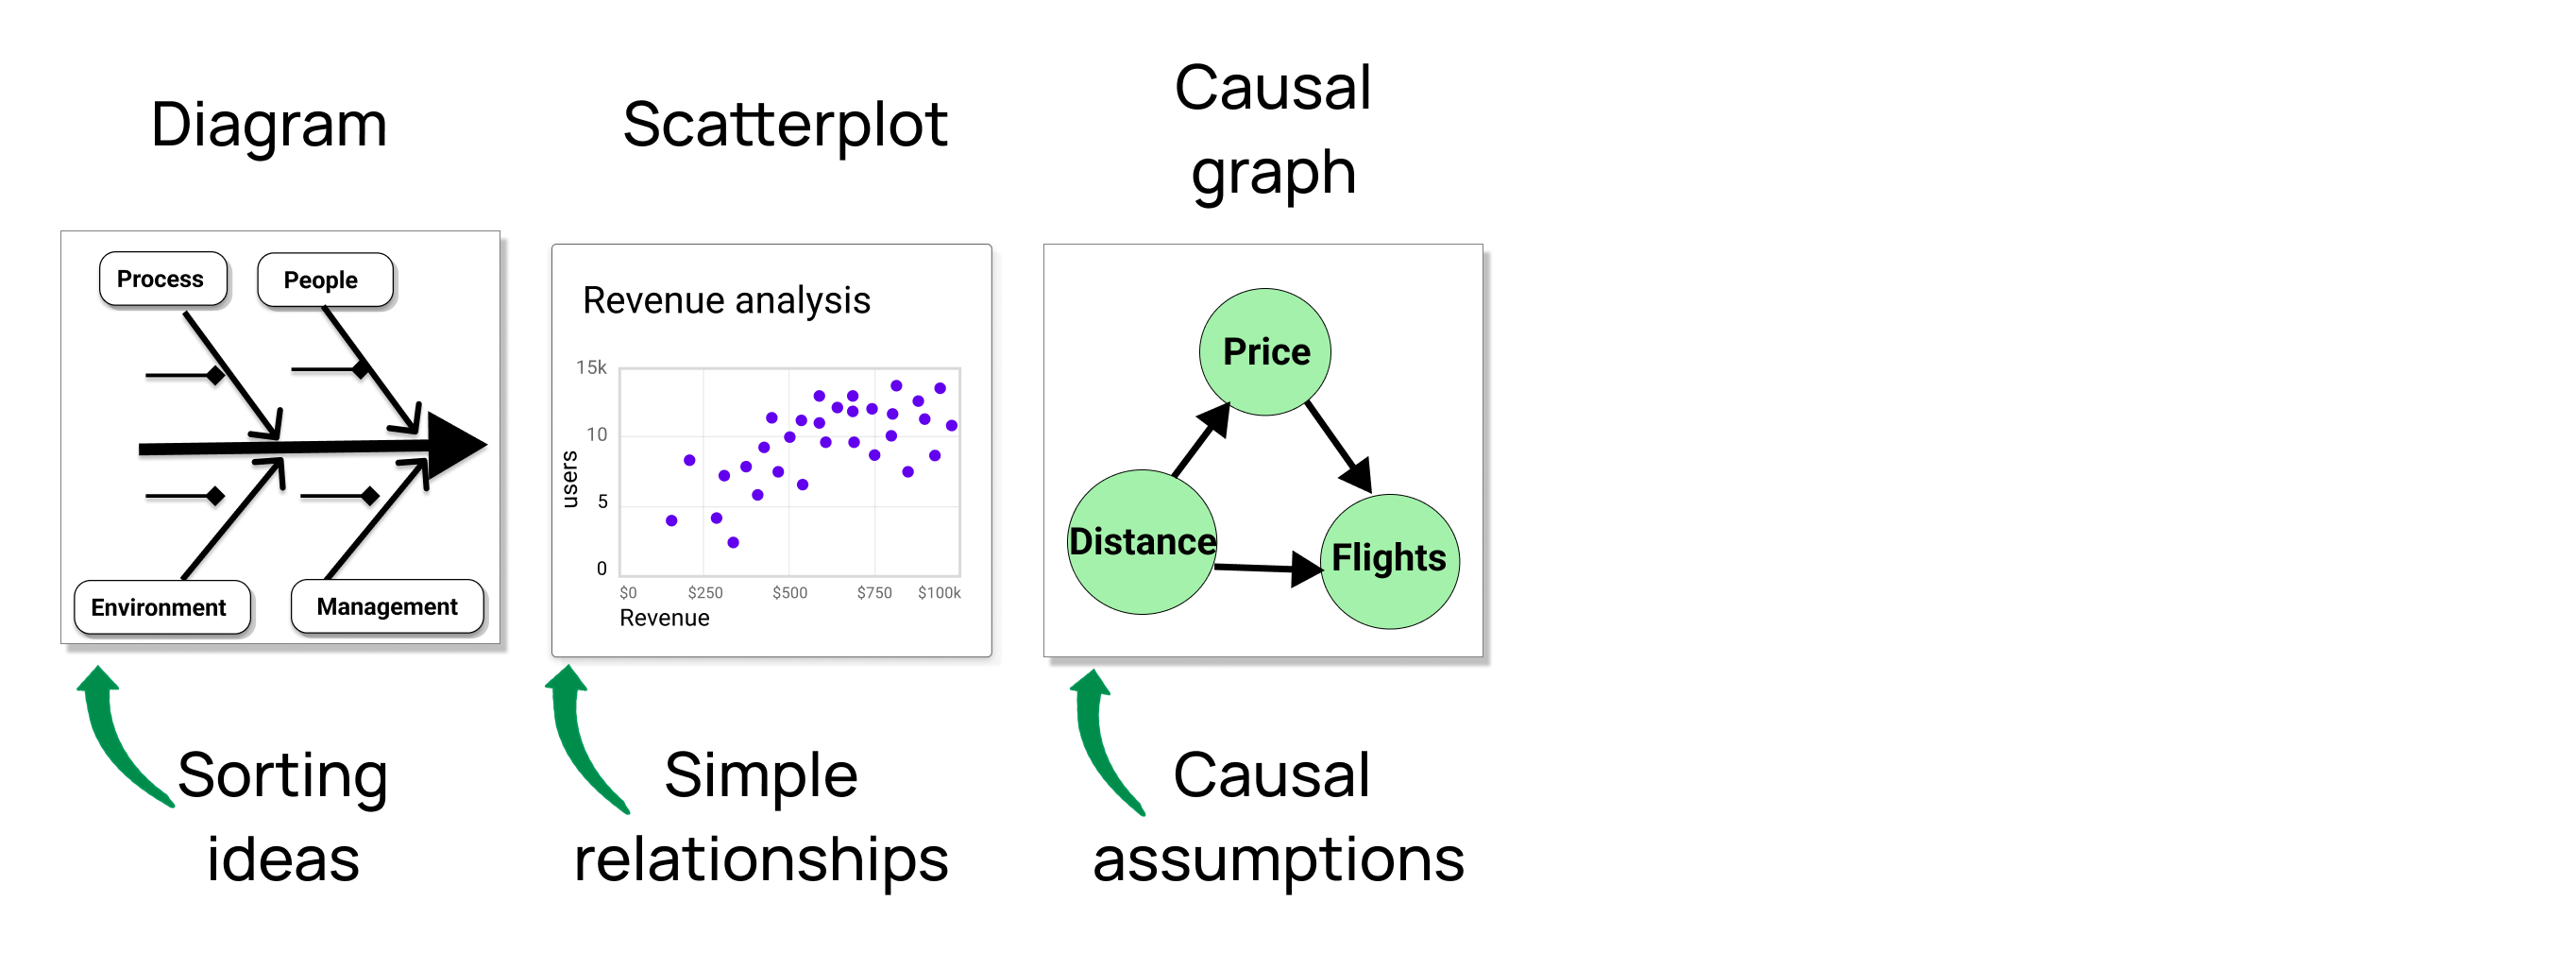
Causality and relationship
Show causality, mechanism, explanation, systematic structure
Causality and relationship
Show causality, mechanism, explanation, systematic structure
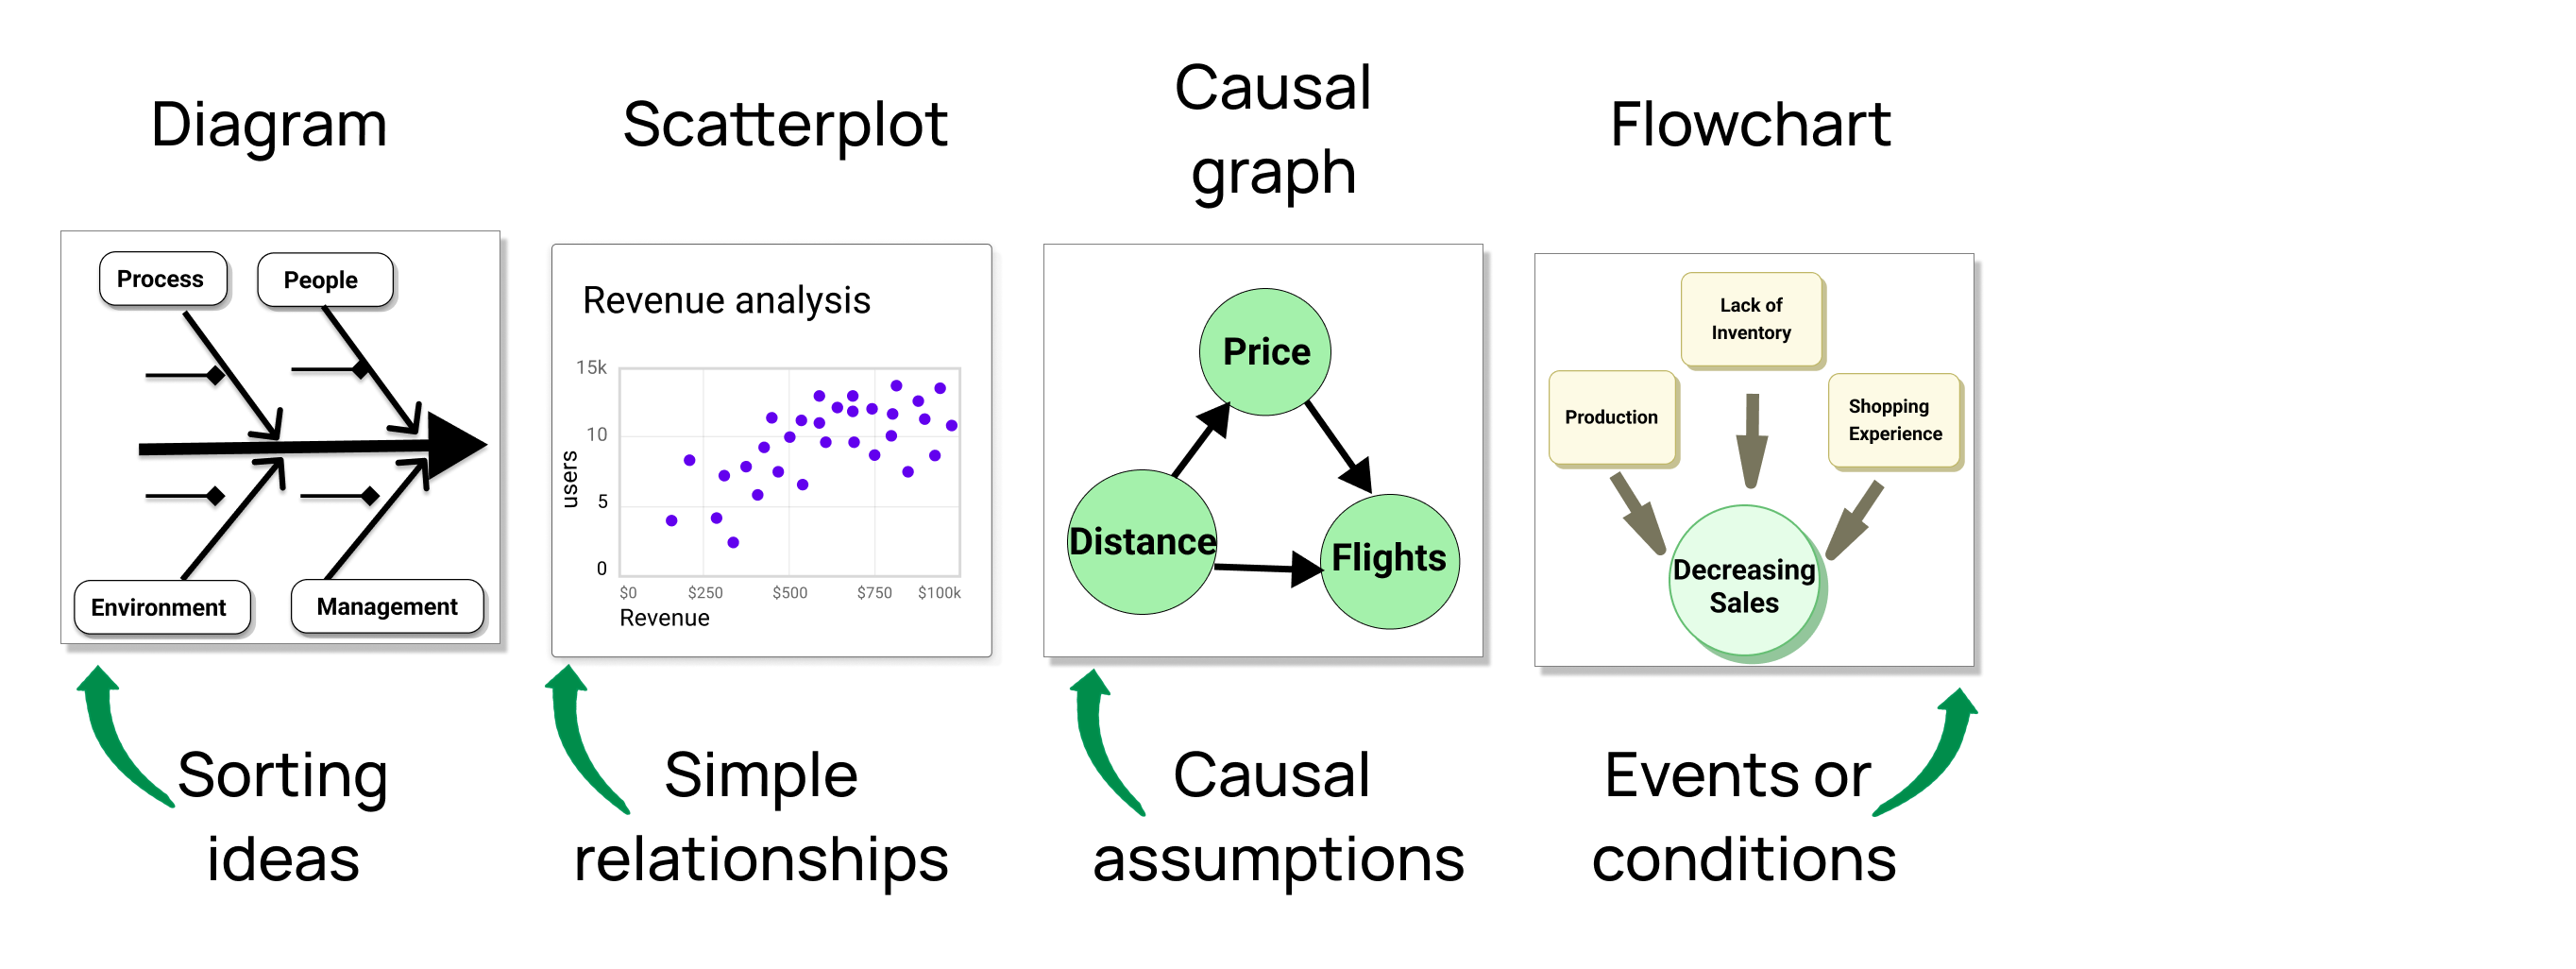
Causality and relationship
Show causality, mechanism, explanation, systematic structure
Causality and relationship
Show causality, mechanism, explanation, systematic structure
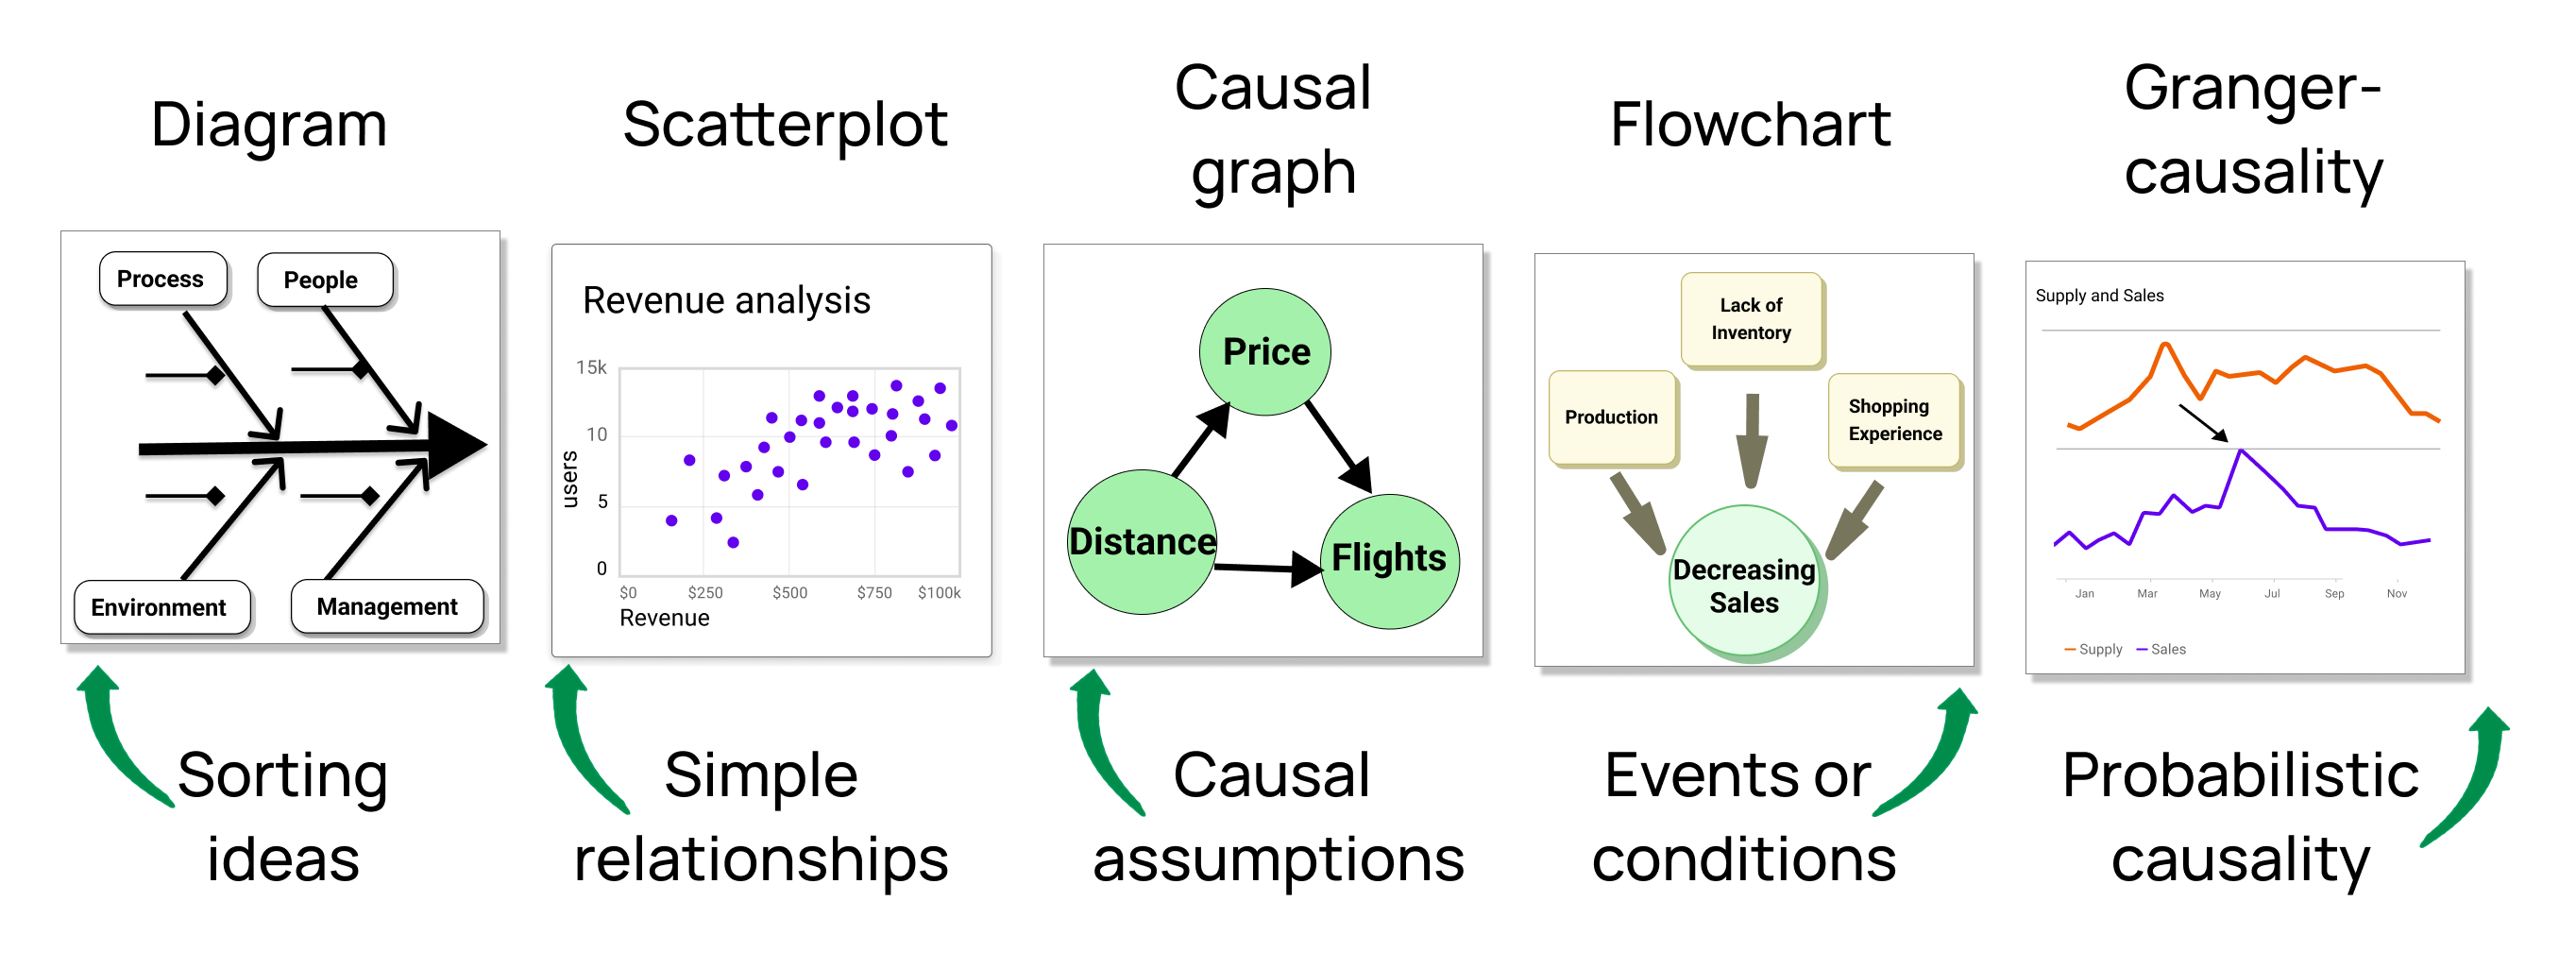
Causality and relationship
Show causality, mechanism, explanation, systematic structure
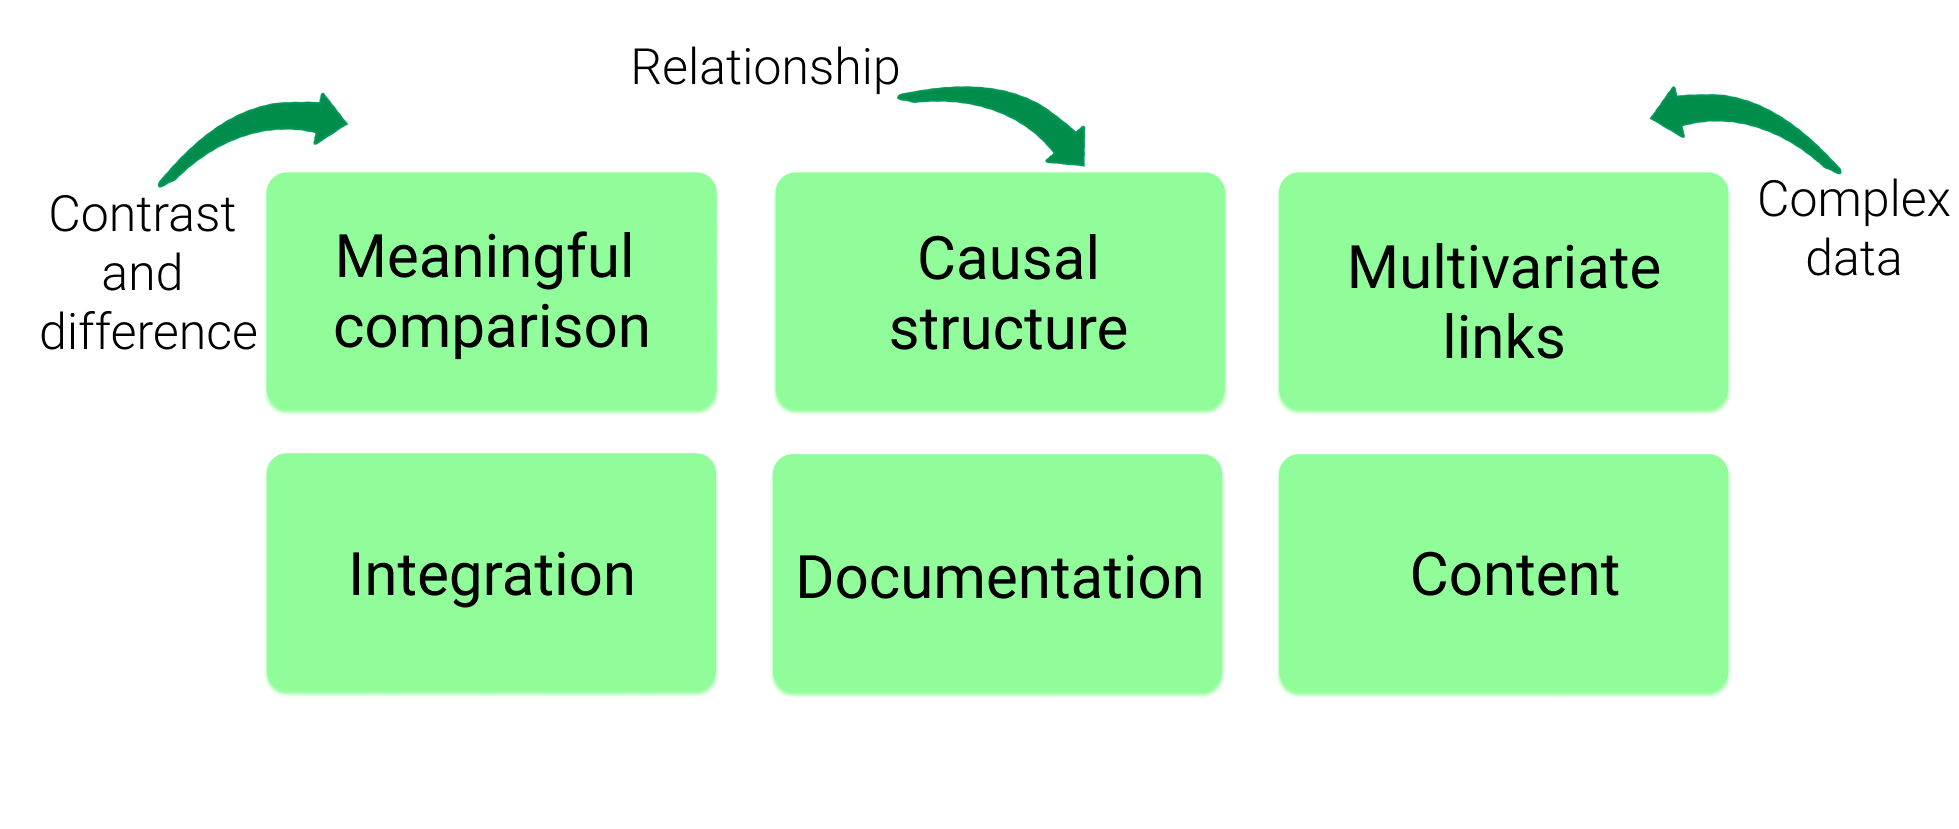
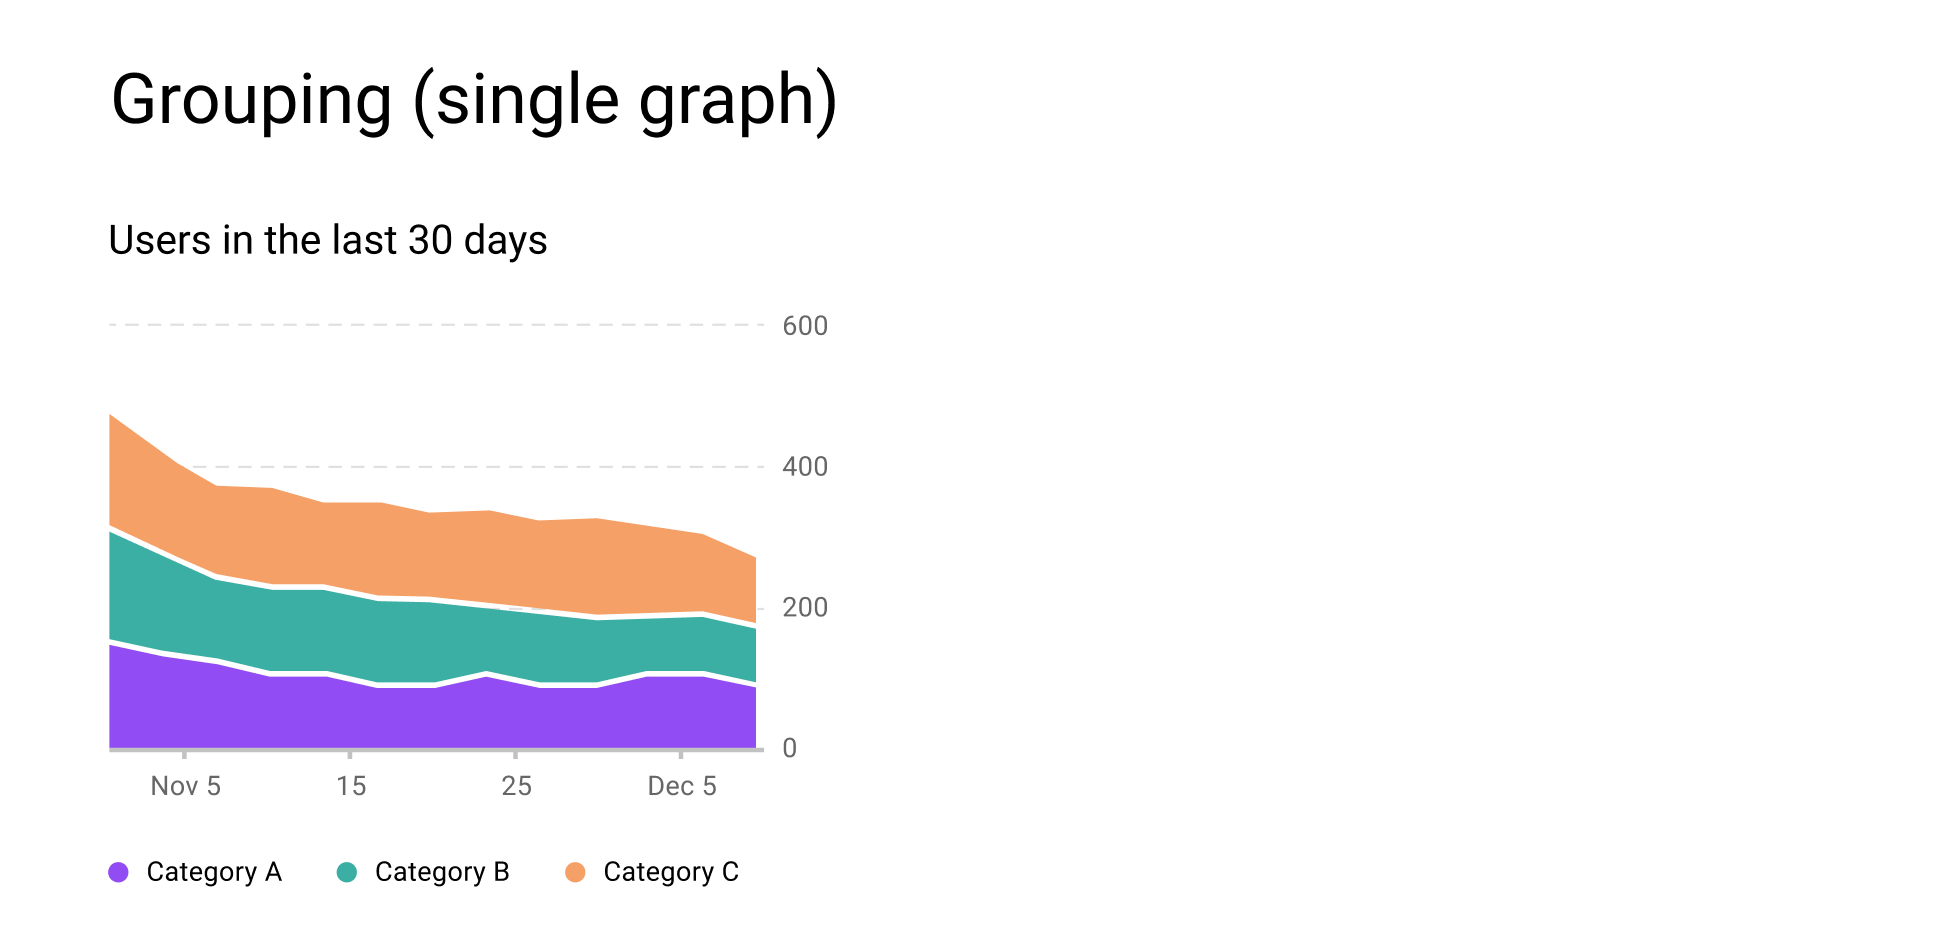
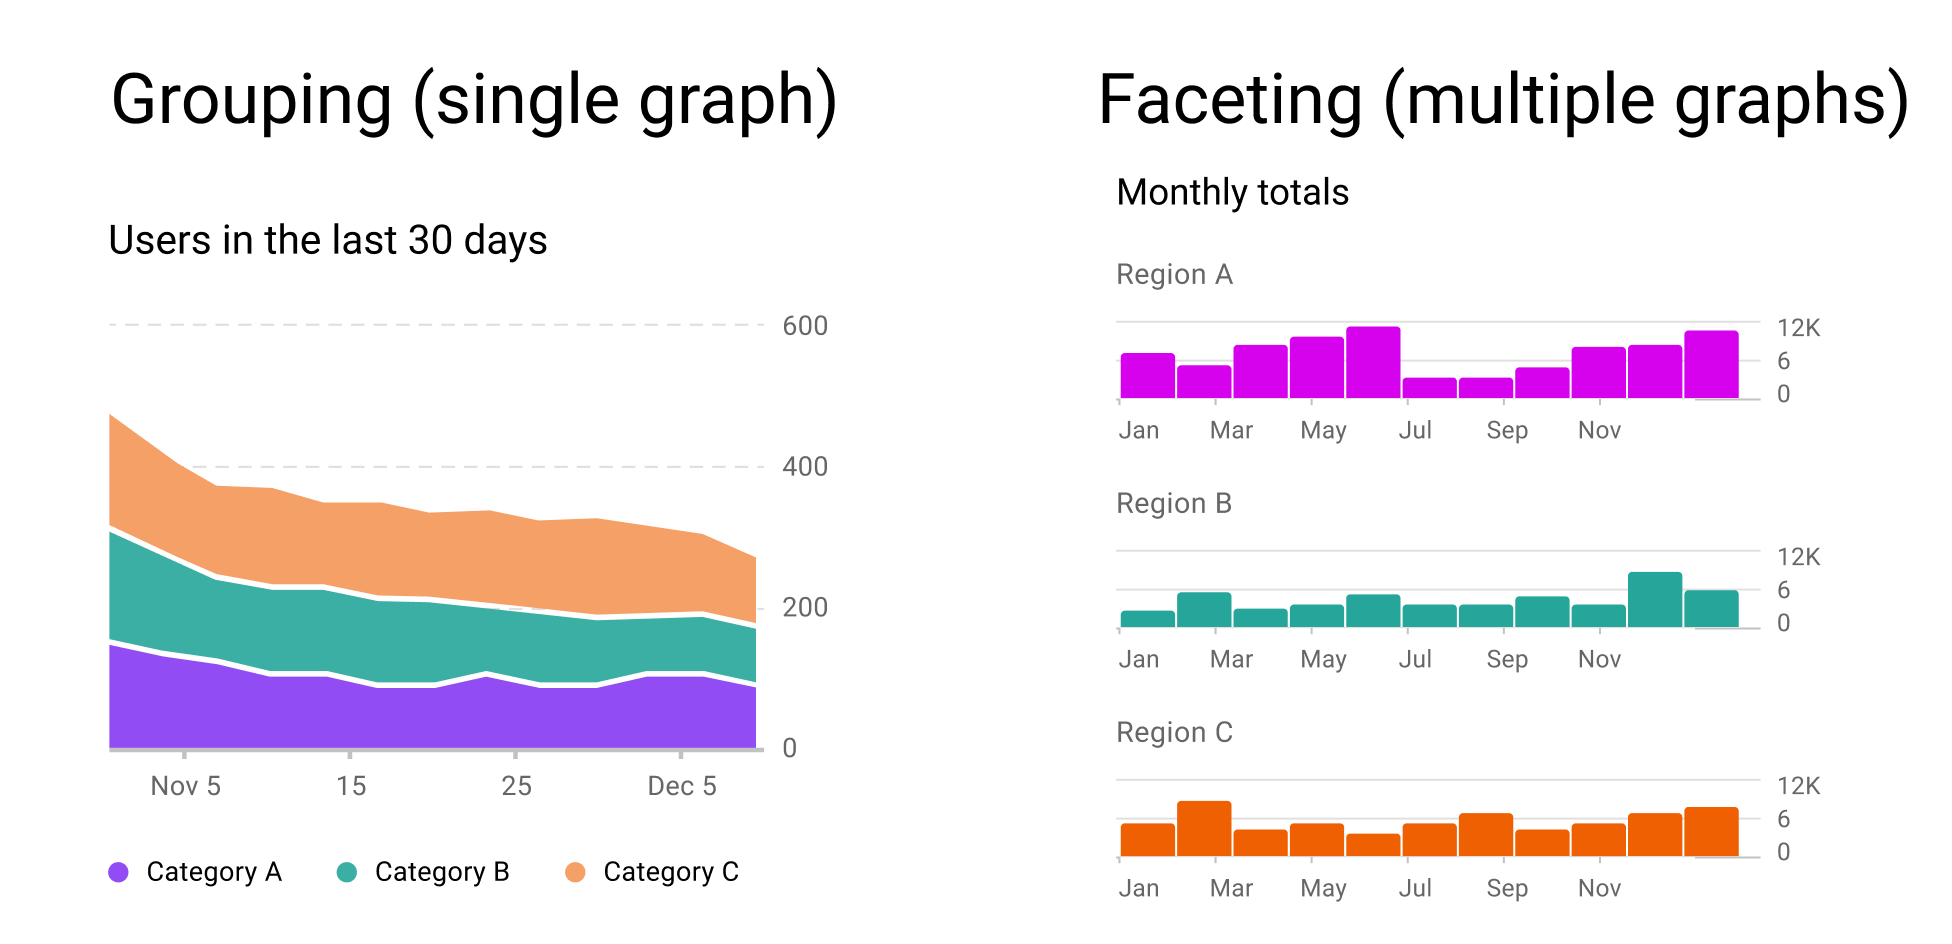
Multiple variables
Show multiple variables (more than 2 variables and dimensions)
Multiple variables
Show multiple variables (more than 2 variables and dimensions)
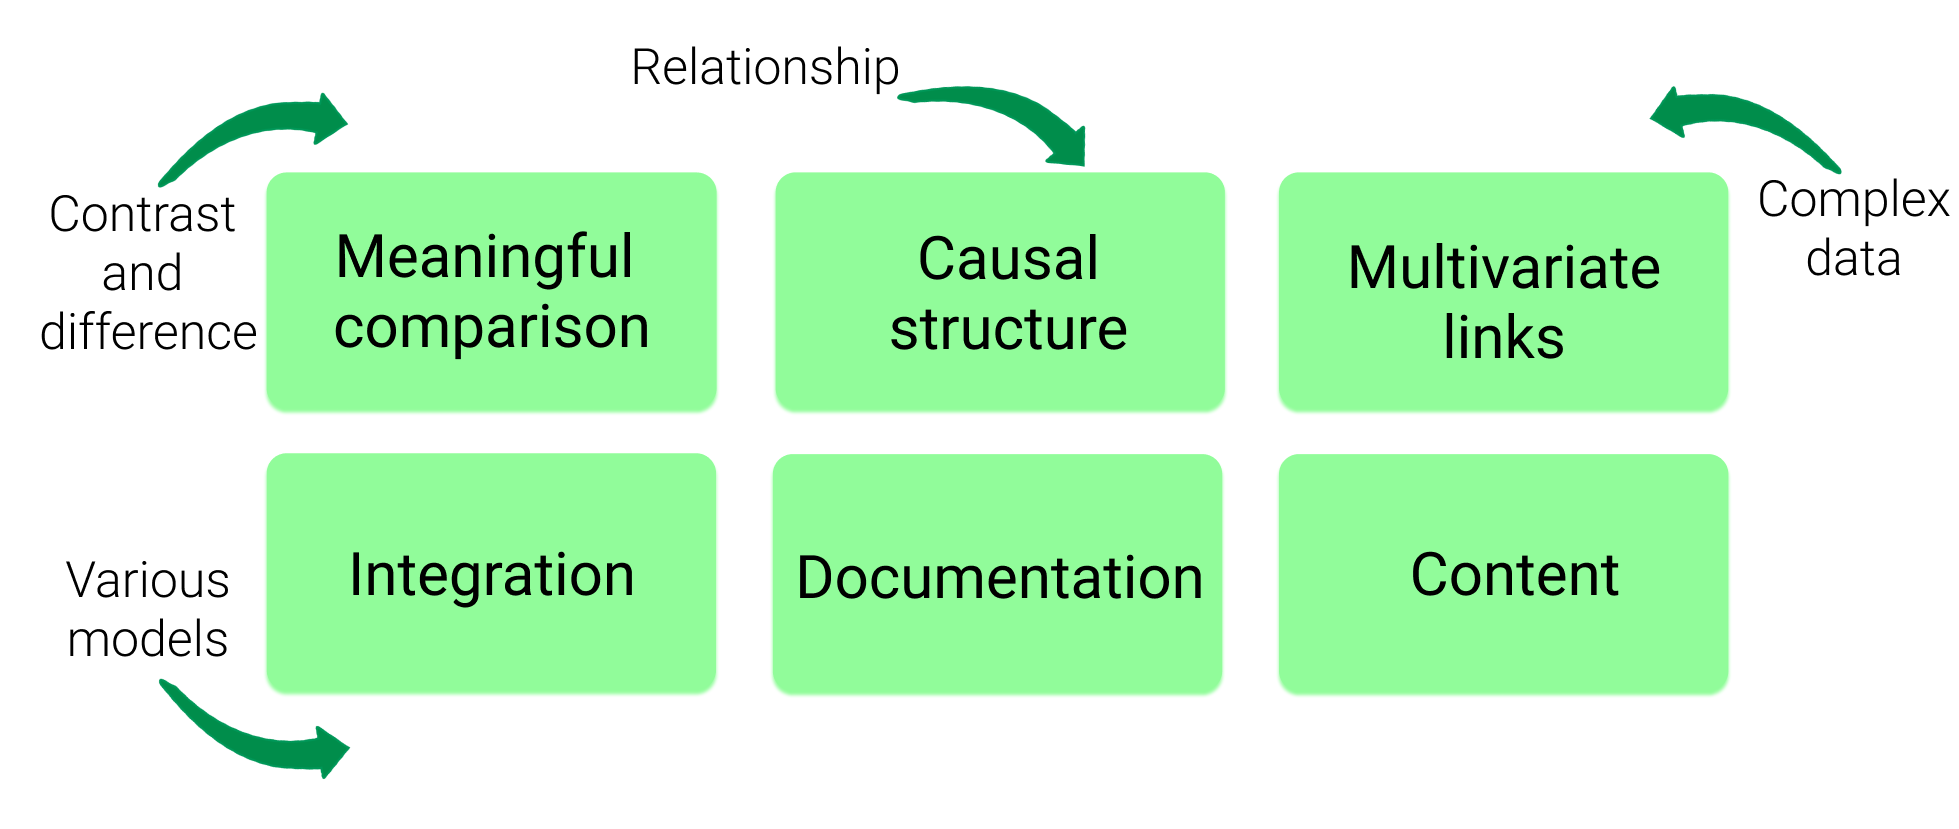
Integration of evidence
Integrate evidence onto a graphic (text, numbers, images)
"...what matters entirely is the evidence, not particular modes of evidence"
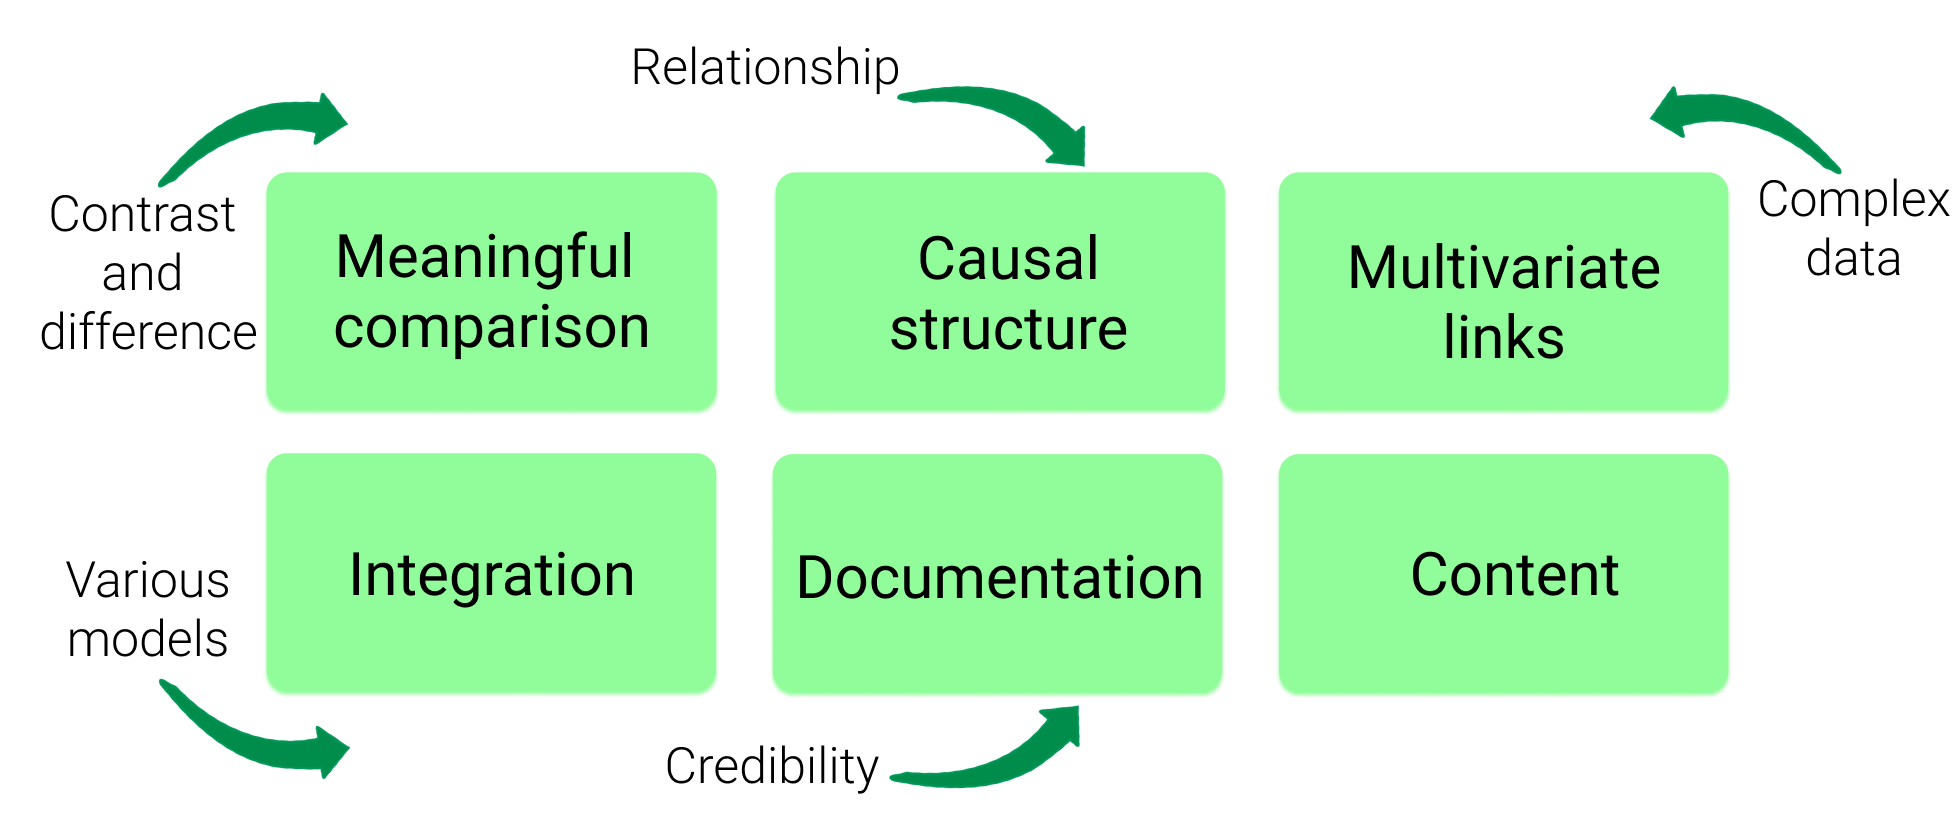
Documentation and content
Documentation: data, process, description
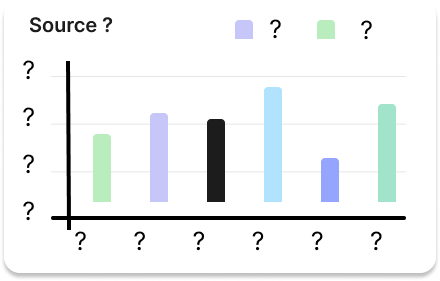
- What is the data origin?
- How data is processed and cleaned?
- Does the graph have legend and labels?
Content: quality, relevance, and integrity

- Start with a good question
- Develop a sound approach

- Present all the necessary information

