Analytical dashboard
Dashboard Design Concepts

Olga Scrivner, PhD
President, Scrivner Solutions Inc
The deep-dive dashboard
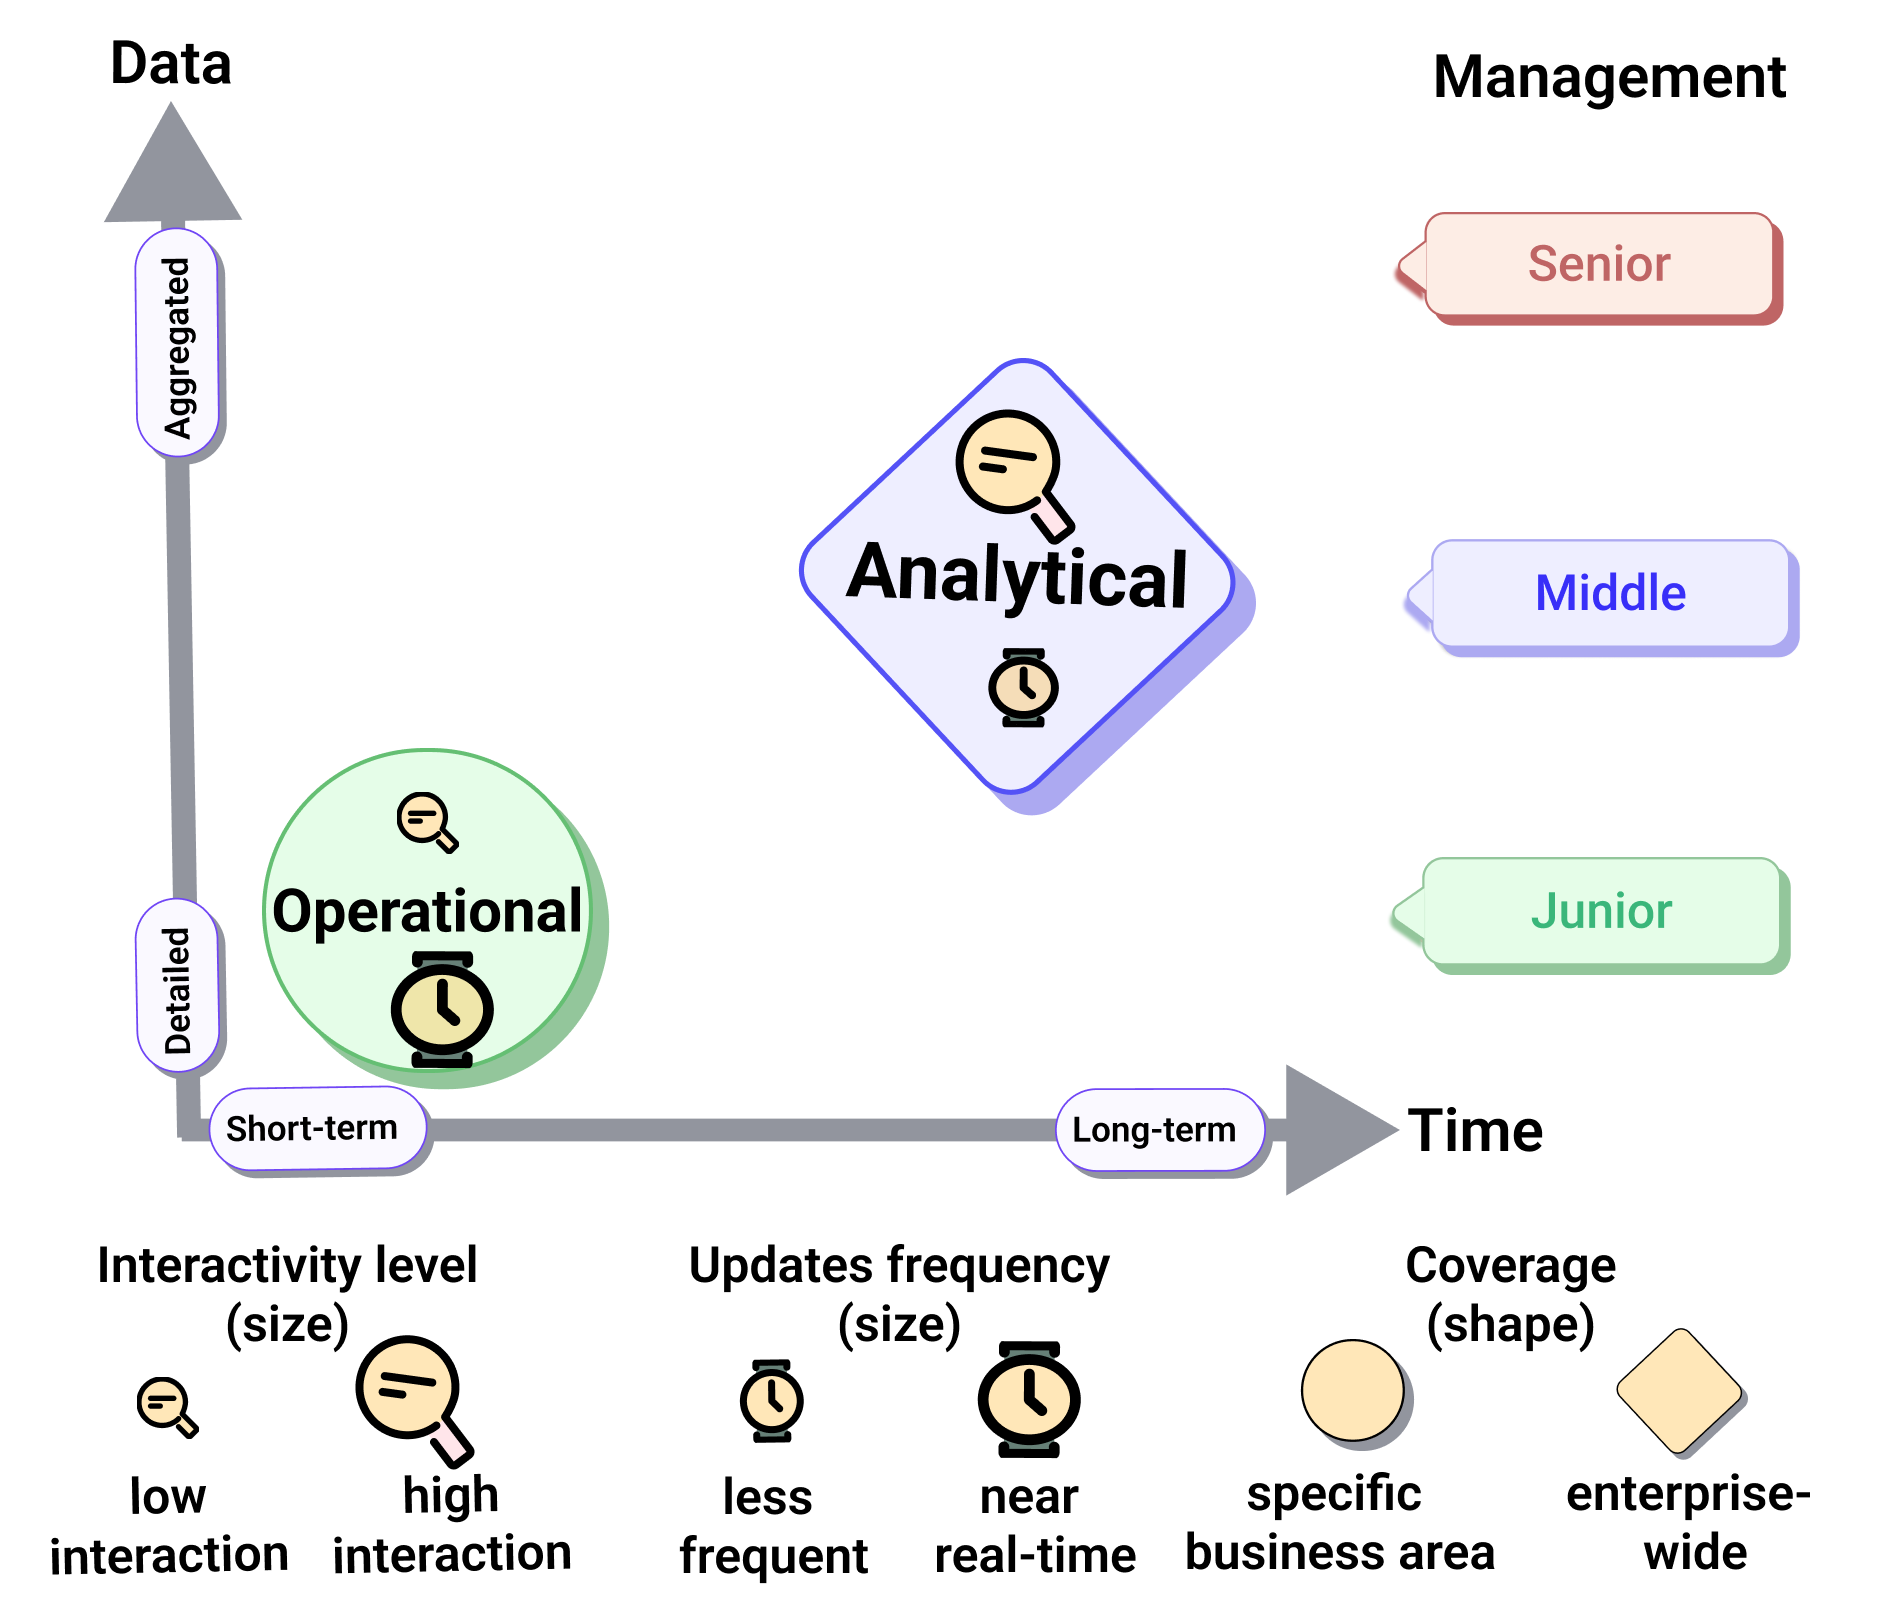
Purpose
- Data mining to uncover deeper insights
Data Type
- Large volumes of data, less frequent updates (monthly, quarterly)
Interactivity:
- High interactivity: drill-down, filters, sliders
Stakeholders
- Analysts
Analytical dashboard benefits
- Guiding future decisions based on historical data
Analytical dashboard benefits
Guiding future decisions based on historical data
Identifying unusual behavior in business trends
Analytical dashboard benefits
Guiding future decisions based on historical data
Identifying unusual behavior in business trends
Uncovering hidden patterns and how variables interact
![]()
Analytical dashboard benefits
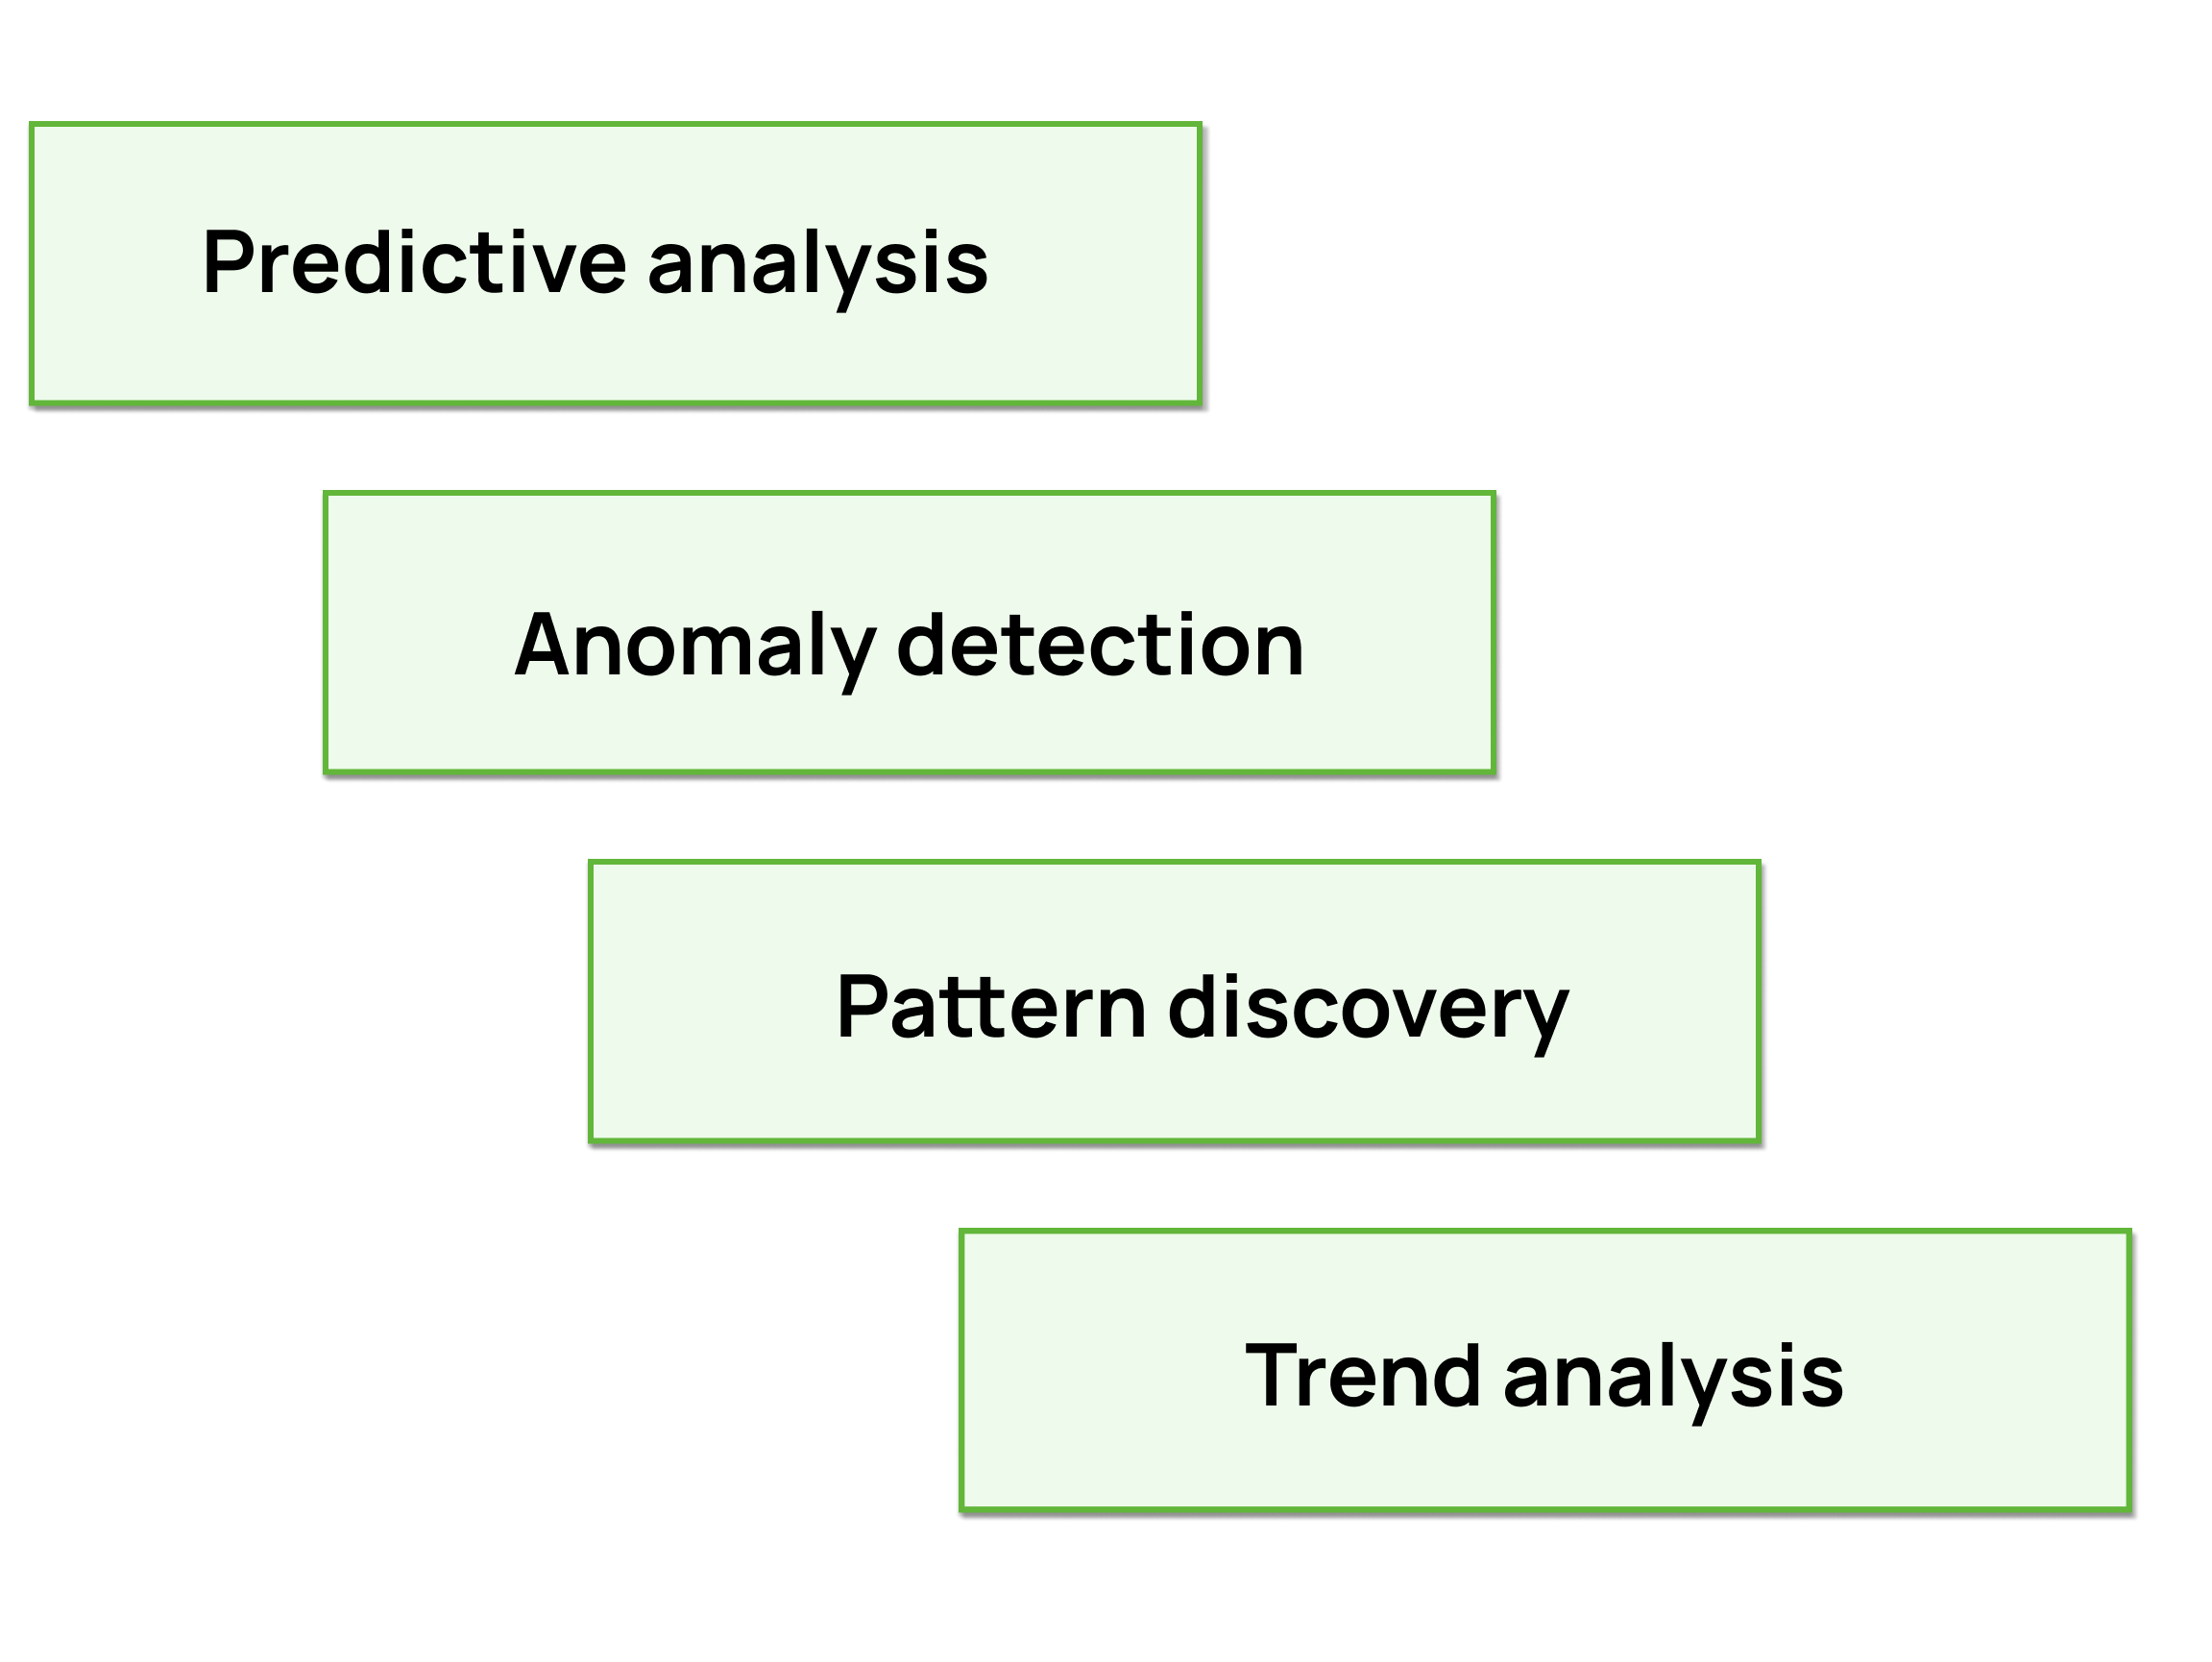
Guiding future decisions based on historical data
Identifying unusual behavior in business trends
Uncovering hidden patterns and understanding how variables interact
Looking at performance metrics over time to identify problematic periods in the past
Analytical dashboard graphical components
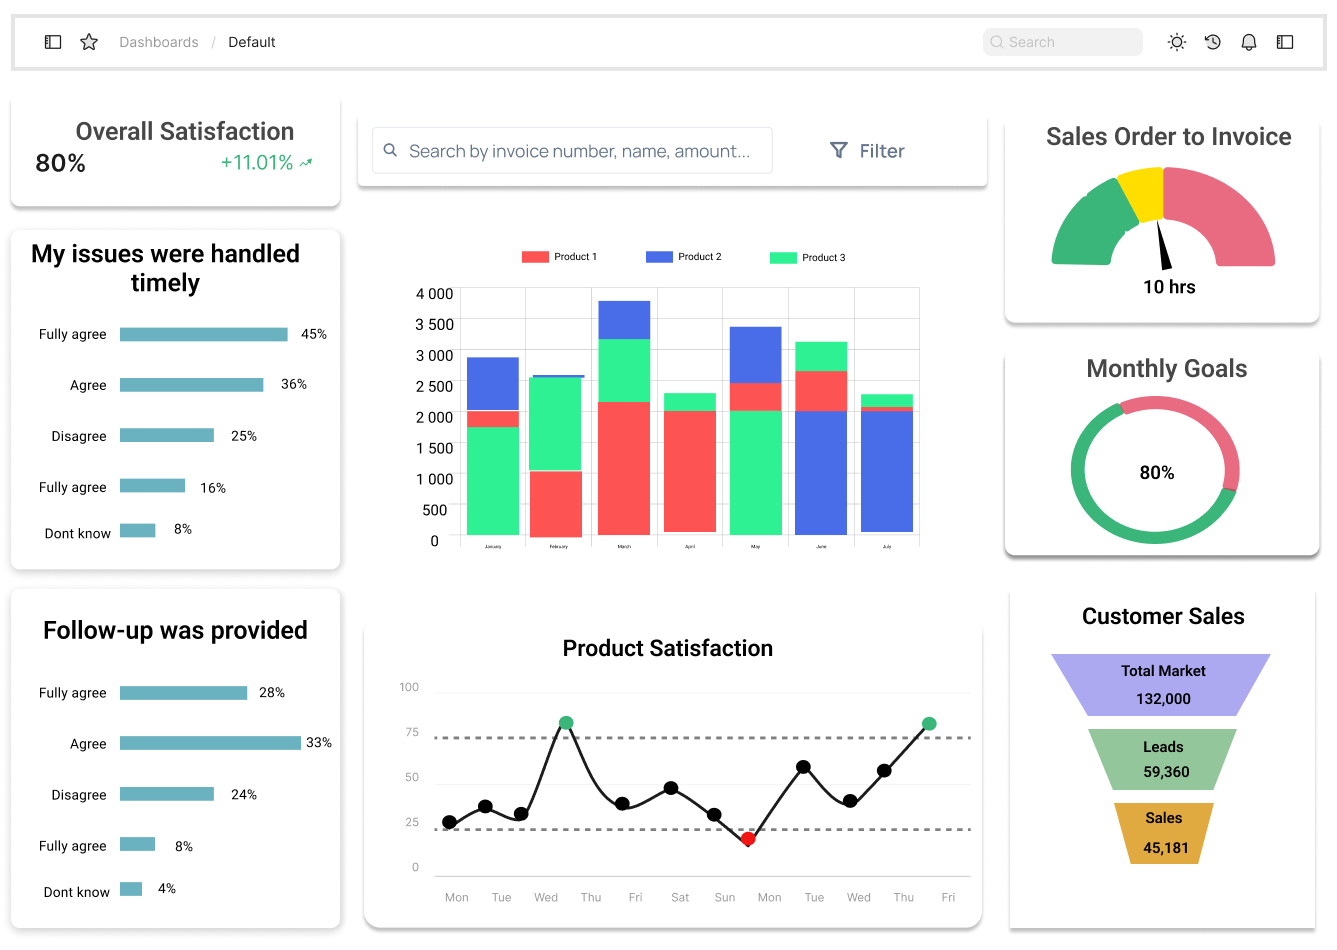
Analytical dashboard graphical components
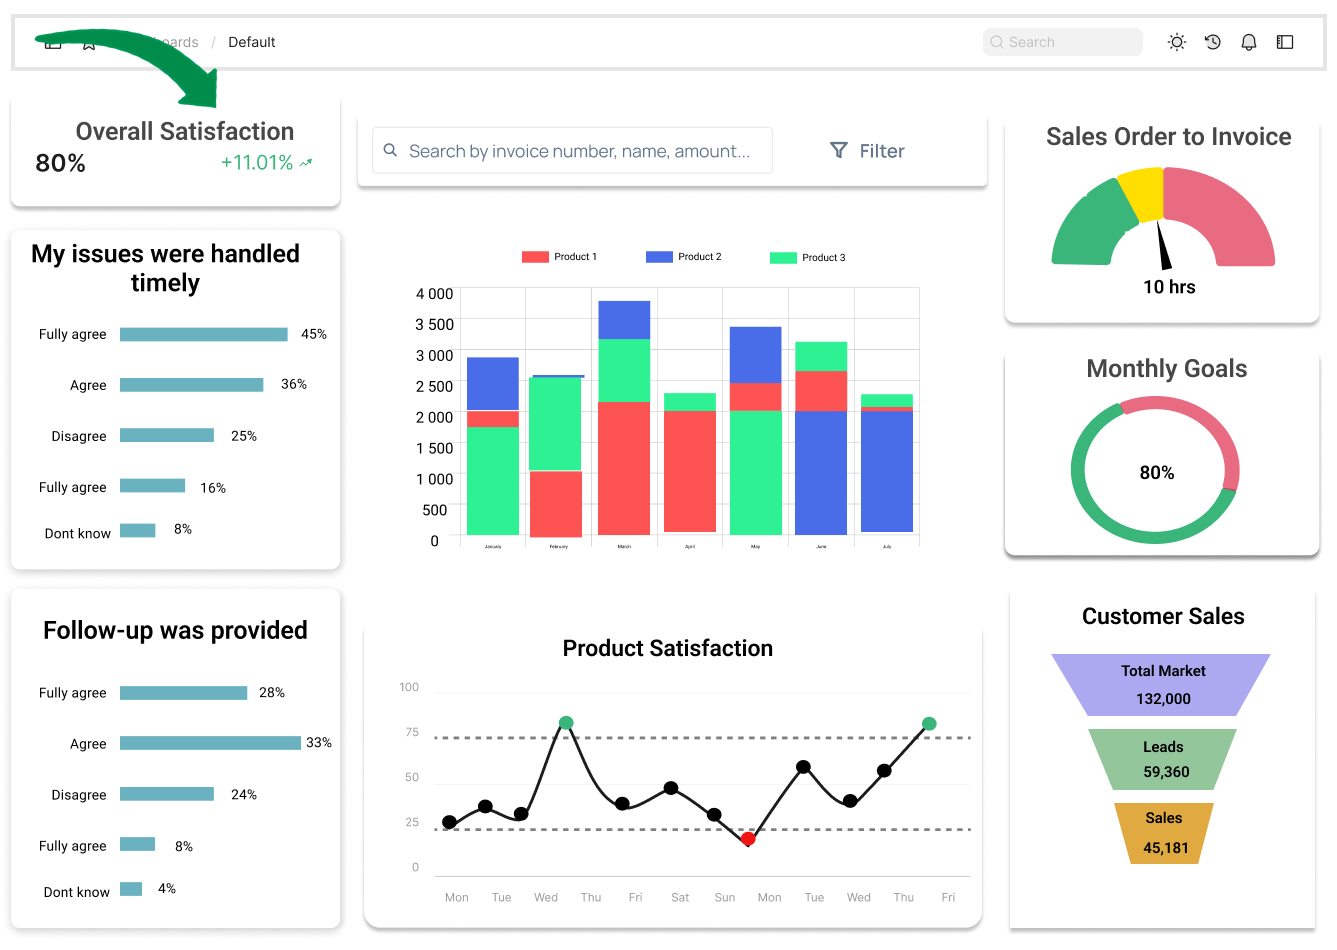
Status: Indicators
Analytical dashboard graphical components
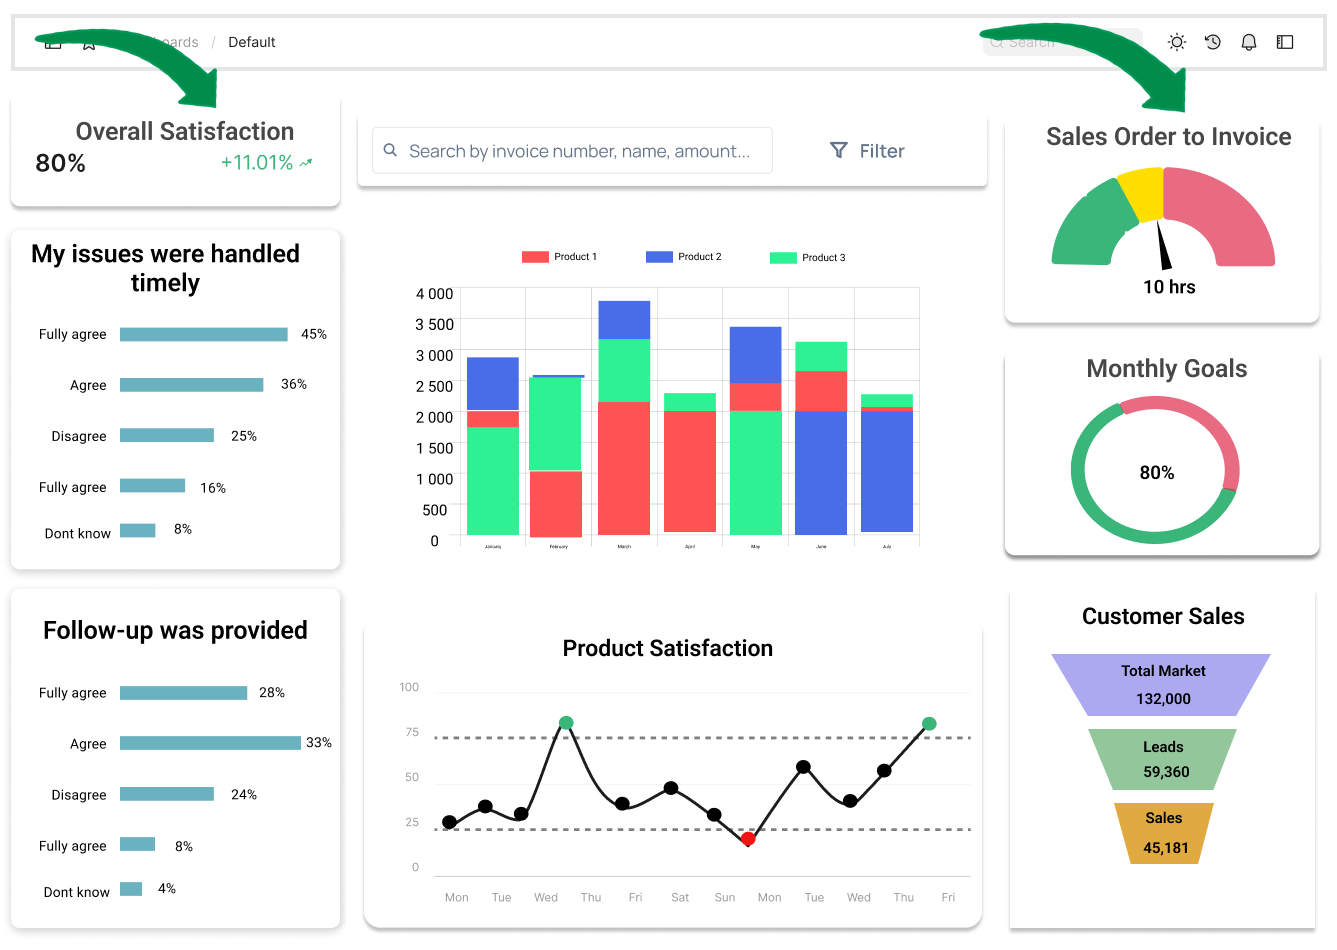
Status: Indicators
Target meter: goal setting and monitoring
Analytical dashboard graphical components
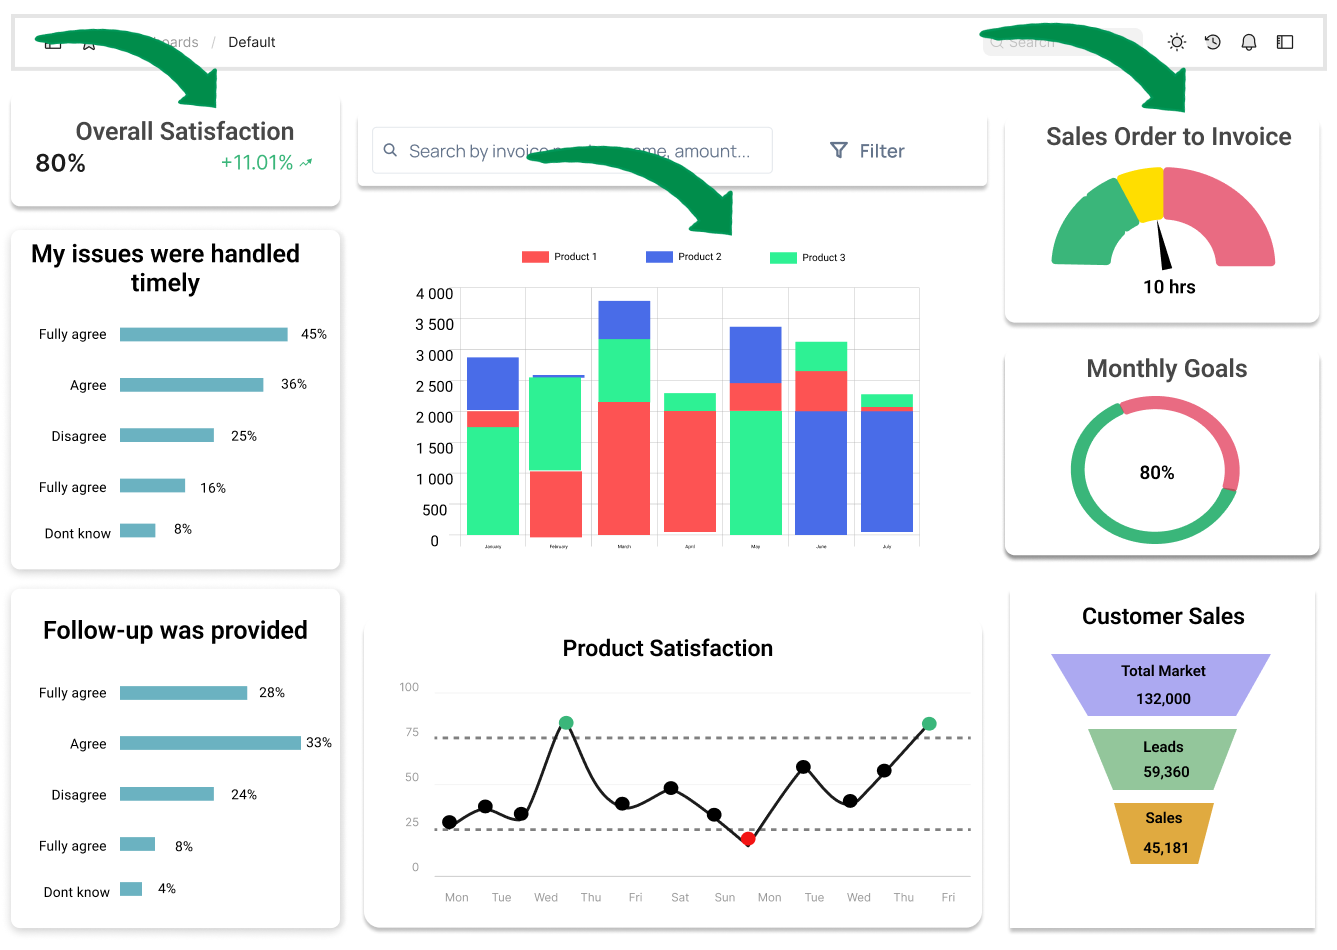
Status: Indicators
Target meter: goal setting and monitoring
Comparator: data overview and analogy
Analytical dashboard graphical components
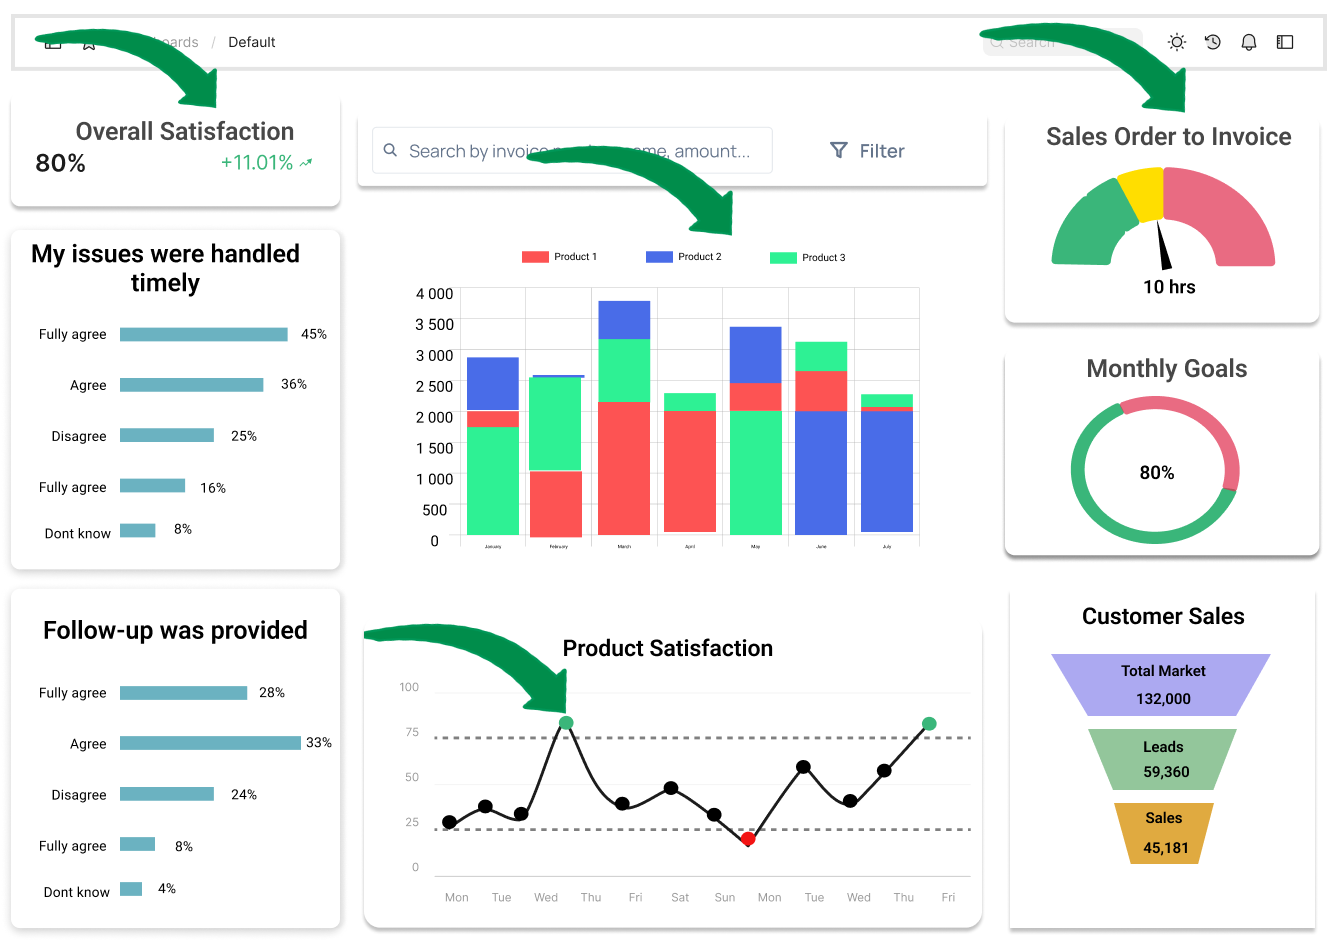
Status: Indicators
Target meter: goal setting and monitoring
Comparator: data overview and analogy
Anomaly detector: detection of business discrepancies
Analytical dashboard graphical components
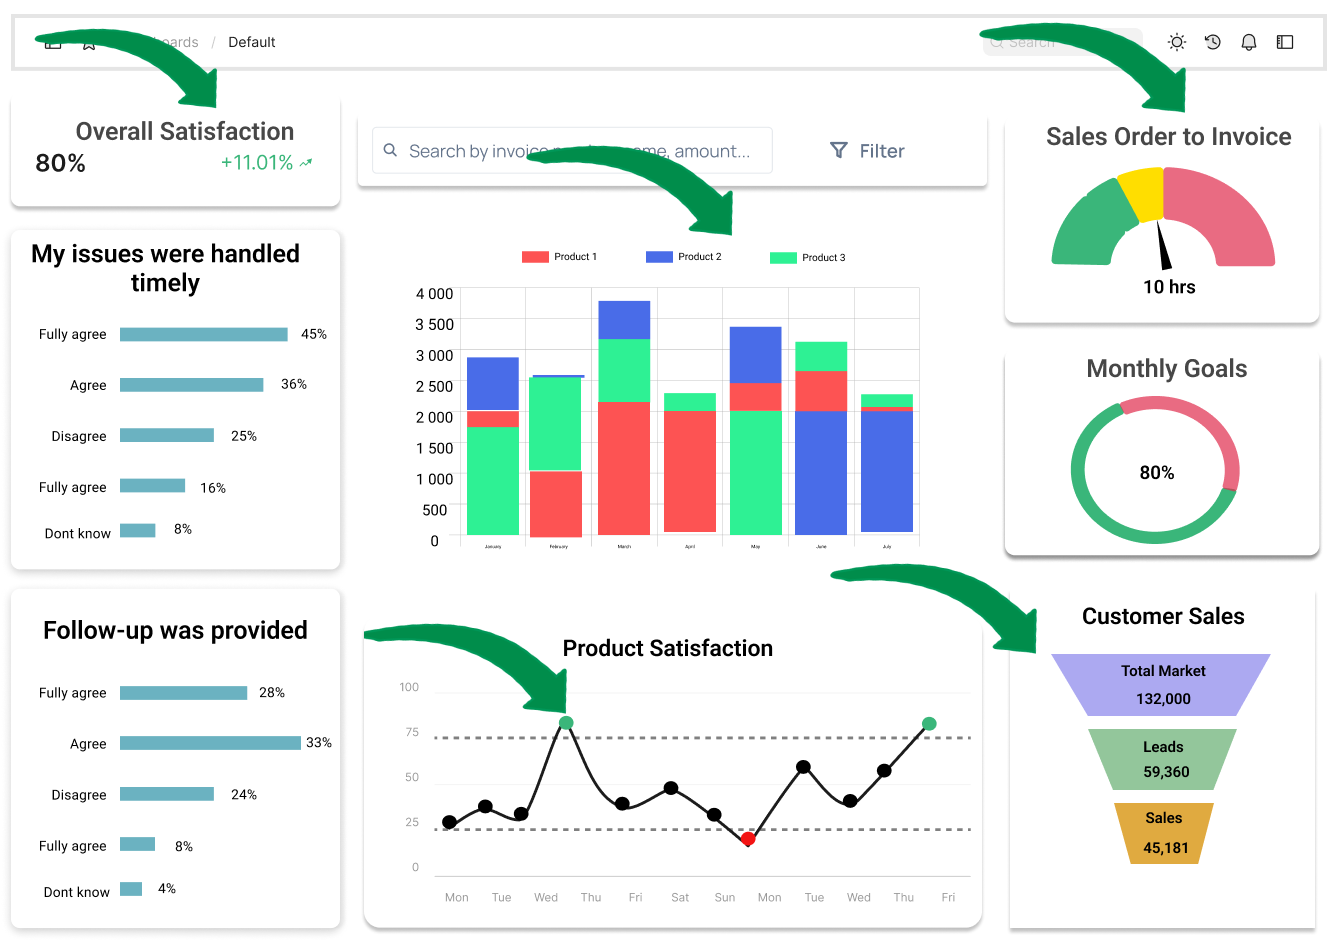
Status: Indicators
Target meter: goal setting and monitoring
Comparator: data overview and analogy
Anomaly detector: detection of business discrepancies
Funnel: visualization of the company's stages
A special word about funnel charts
- Sequential stages of a business process (sales pipeline, marketing campaign outreach)
- Starts from a broad head and breaks down into smaller segments

A special word about funnel charts
- Sequential stages of a business process (sales pipeline, marketing campaign outreach)
- Starts from a broad head and breaks down into smaller segments
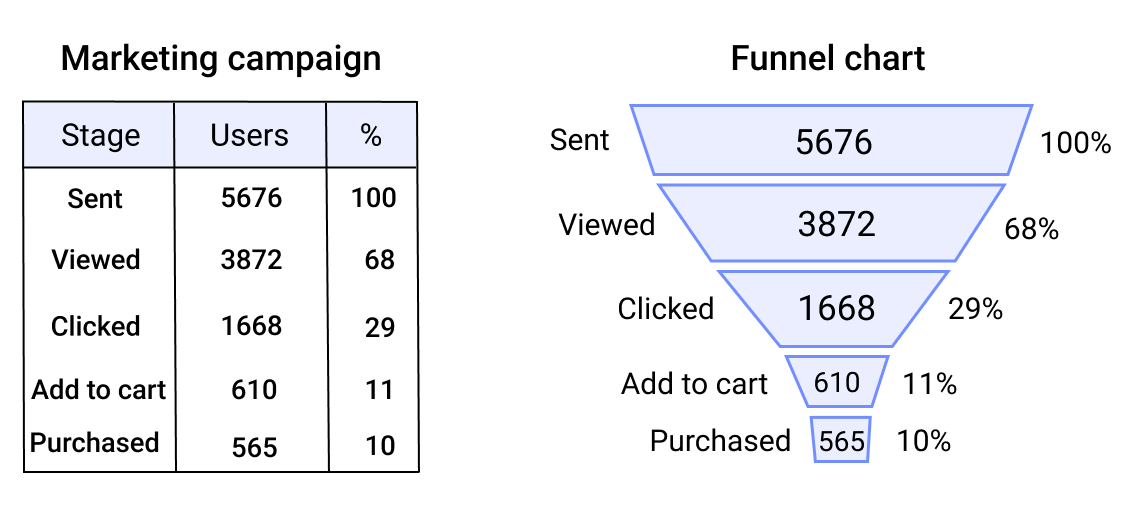
- Used as a high-level discovery visualization
Financial analytical dashboard
Objective: improving investment opportunities
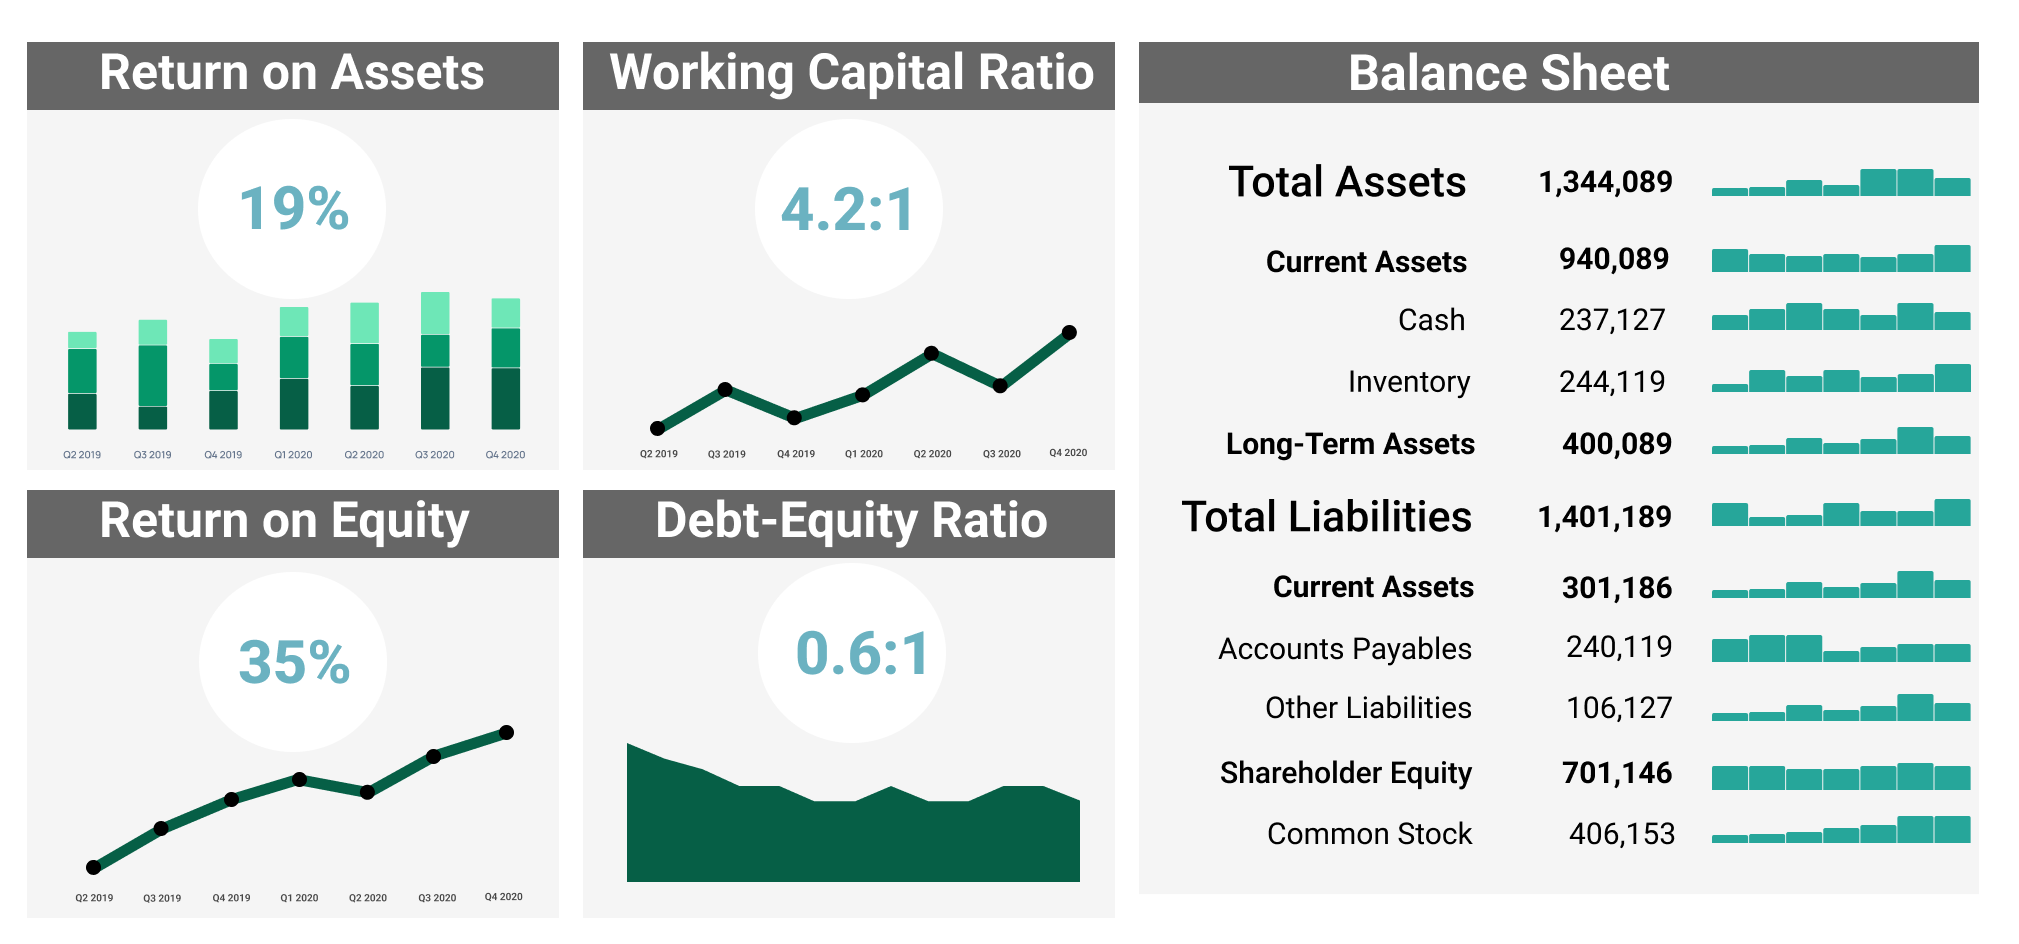
Question: how efficiently the company's capital is spent
Task: set specific operational activities to improve future spending
Data: financial KPIs
- Efficiency ratios, working capital, balance sheet, income statement, cash flow
Data visualization: indicator, trend, comparator, anomaly detector
Healthcare analytical dashboard
Objective: patients' care improvement
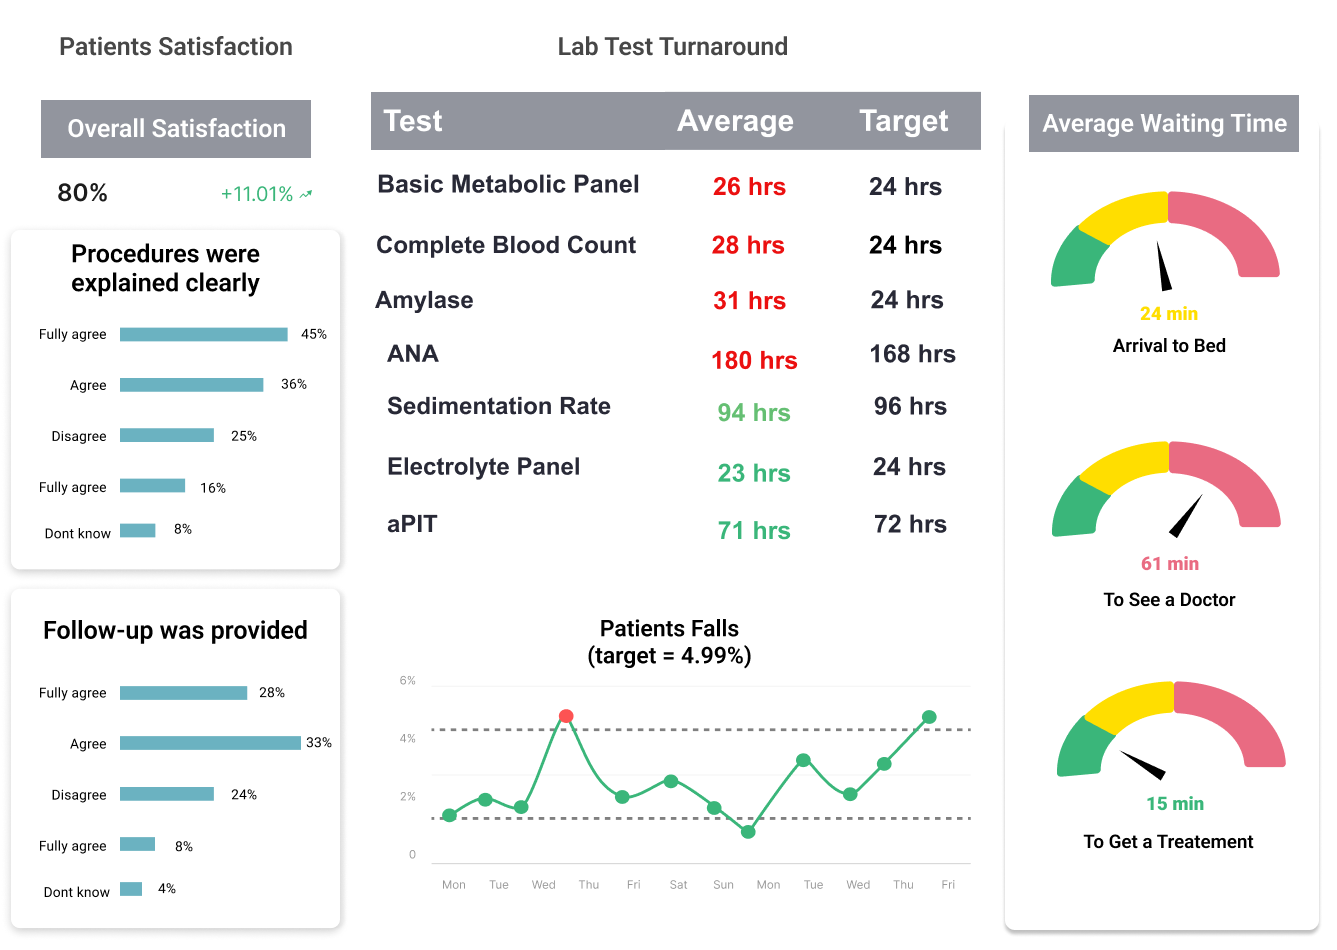
Question: how satisfied are the patients with the facility and the service
Task: provides set specific operational activities to improve service and facility
Data: healthcare KPIs
- Satisfaction, waiting times, and safety
Data visualization: indicator, target meters, trend, anomaly detector, color-coded table with current versus target turnaround (an alternative to bullet chart)
Let's practice!
Dashboard Design Concepts

