Analytical dashboard
Dashboard Design Concepts

Olga Scrivner, PhD
President, Scrivner Solutions Inc
The deep-dive dashboard
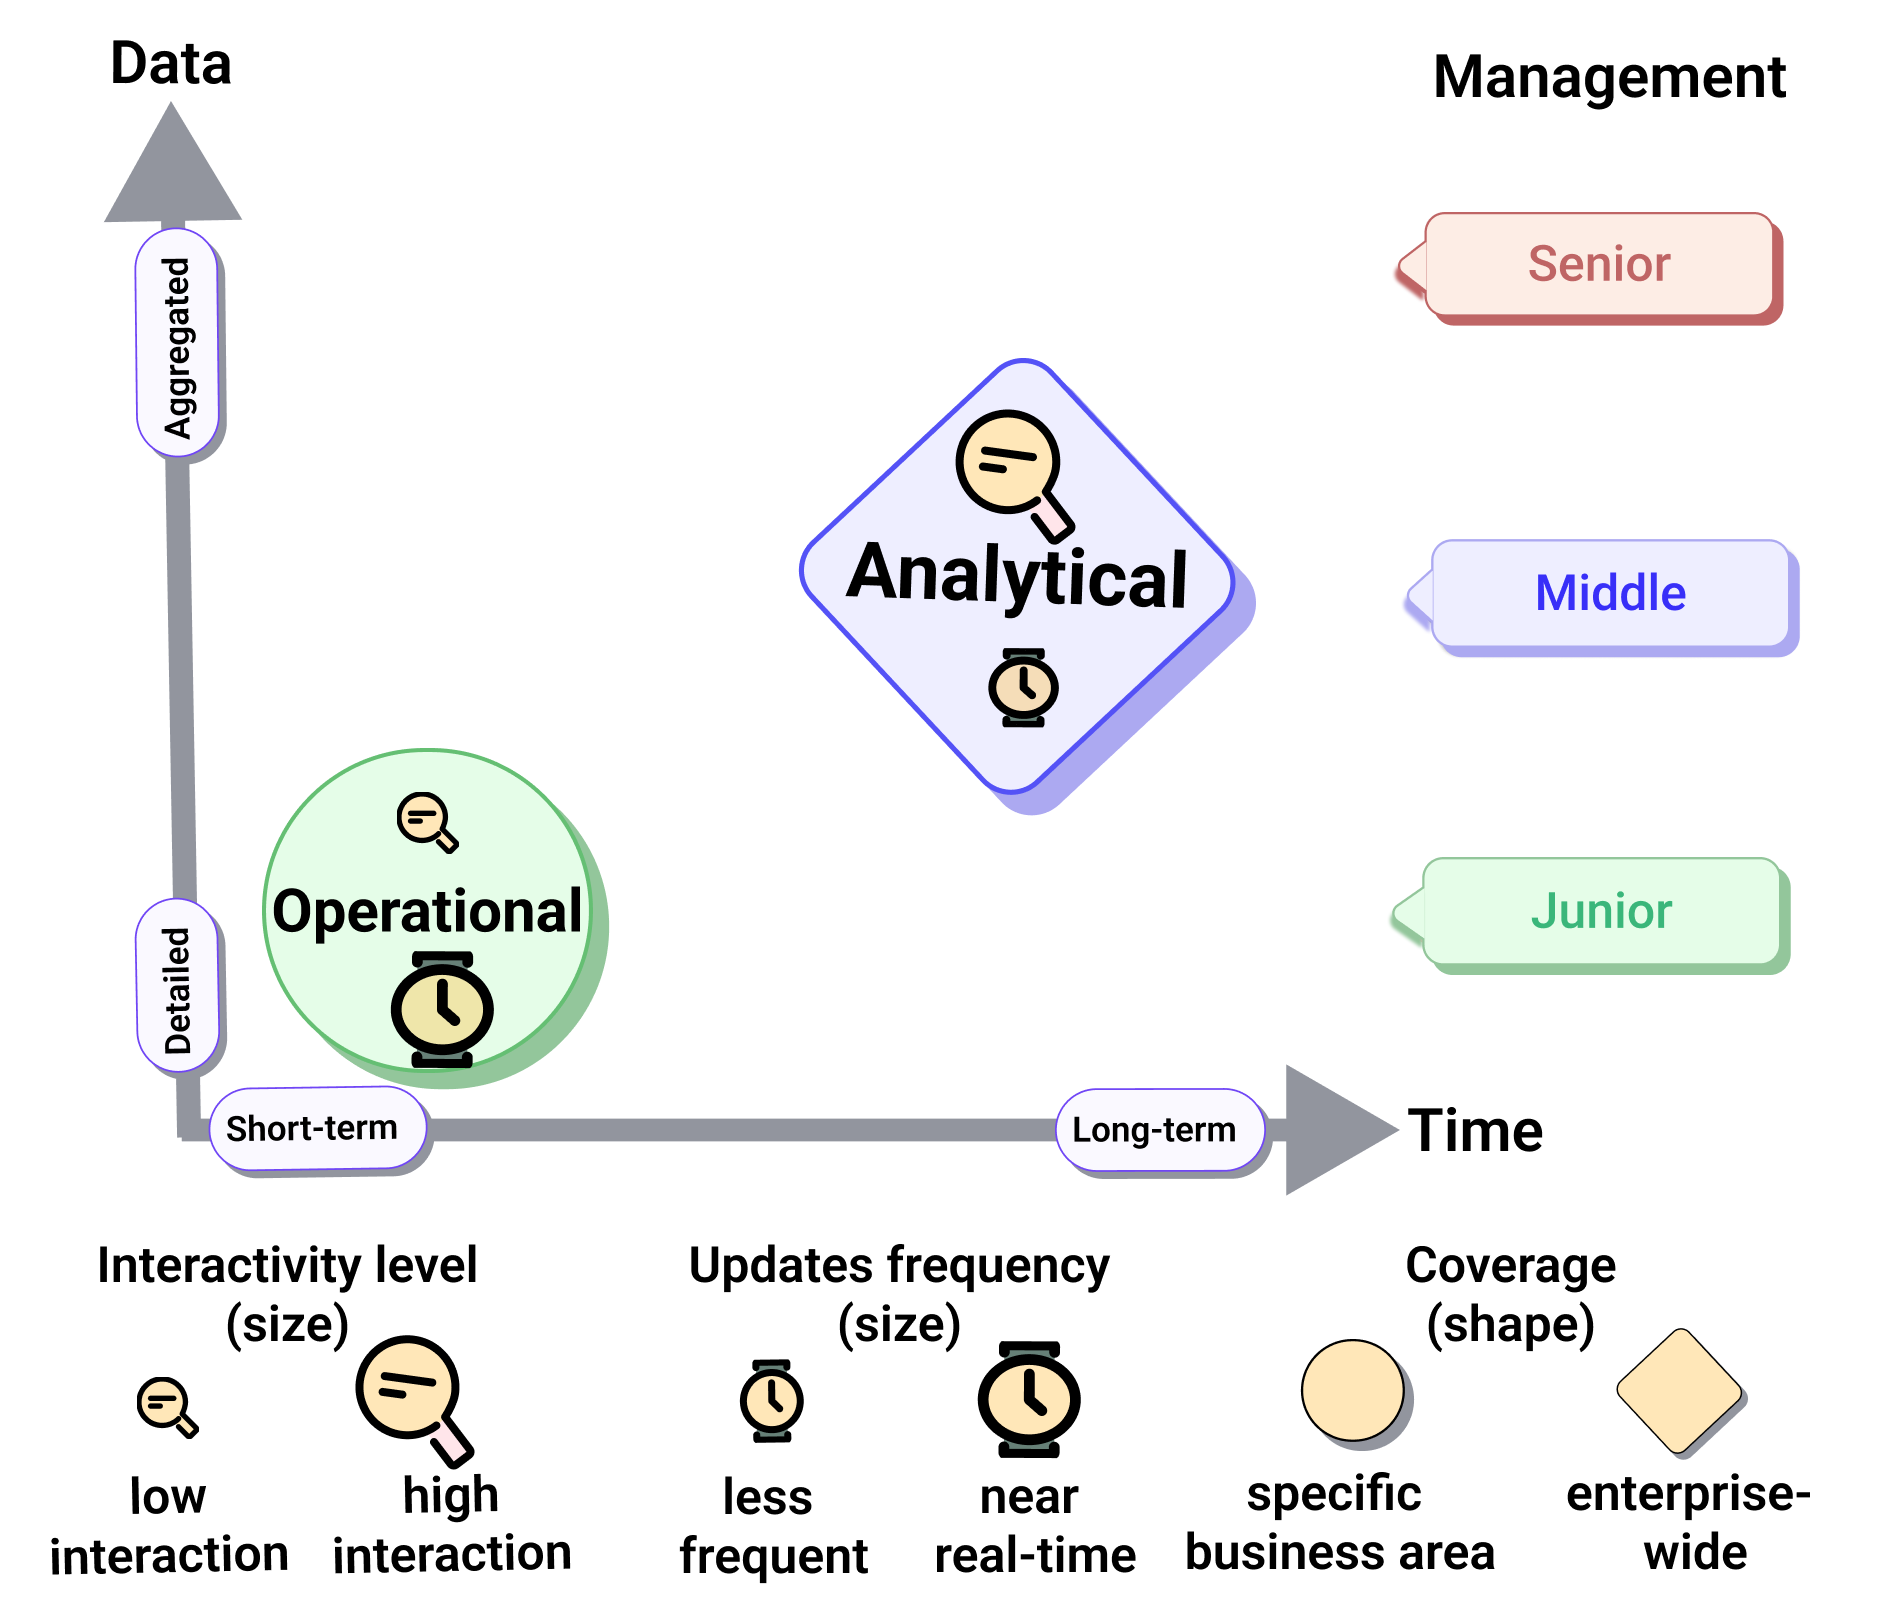
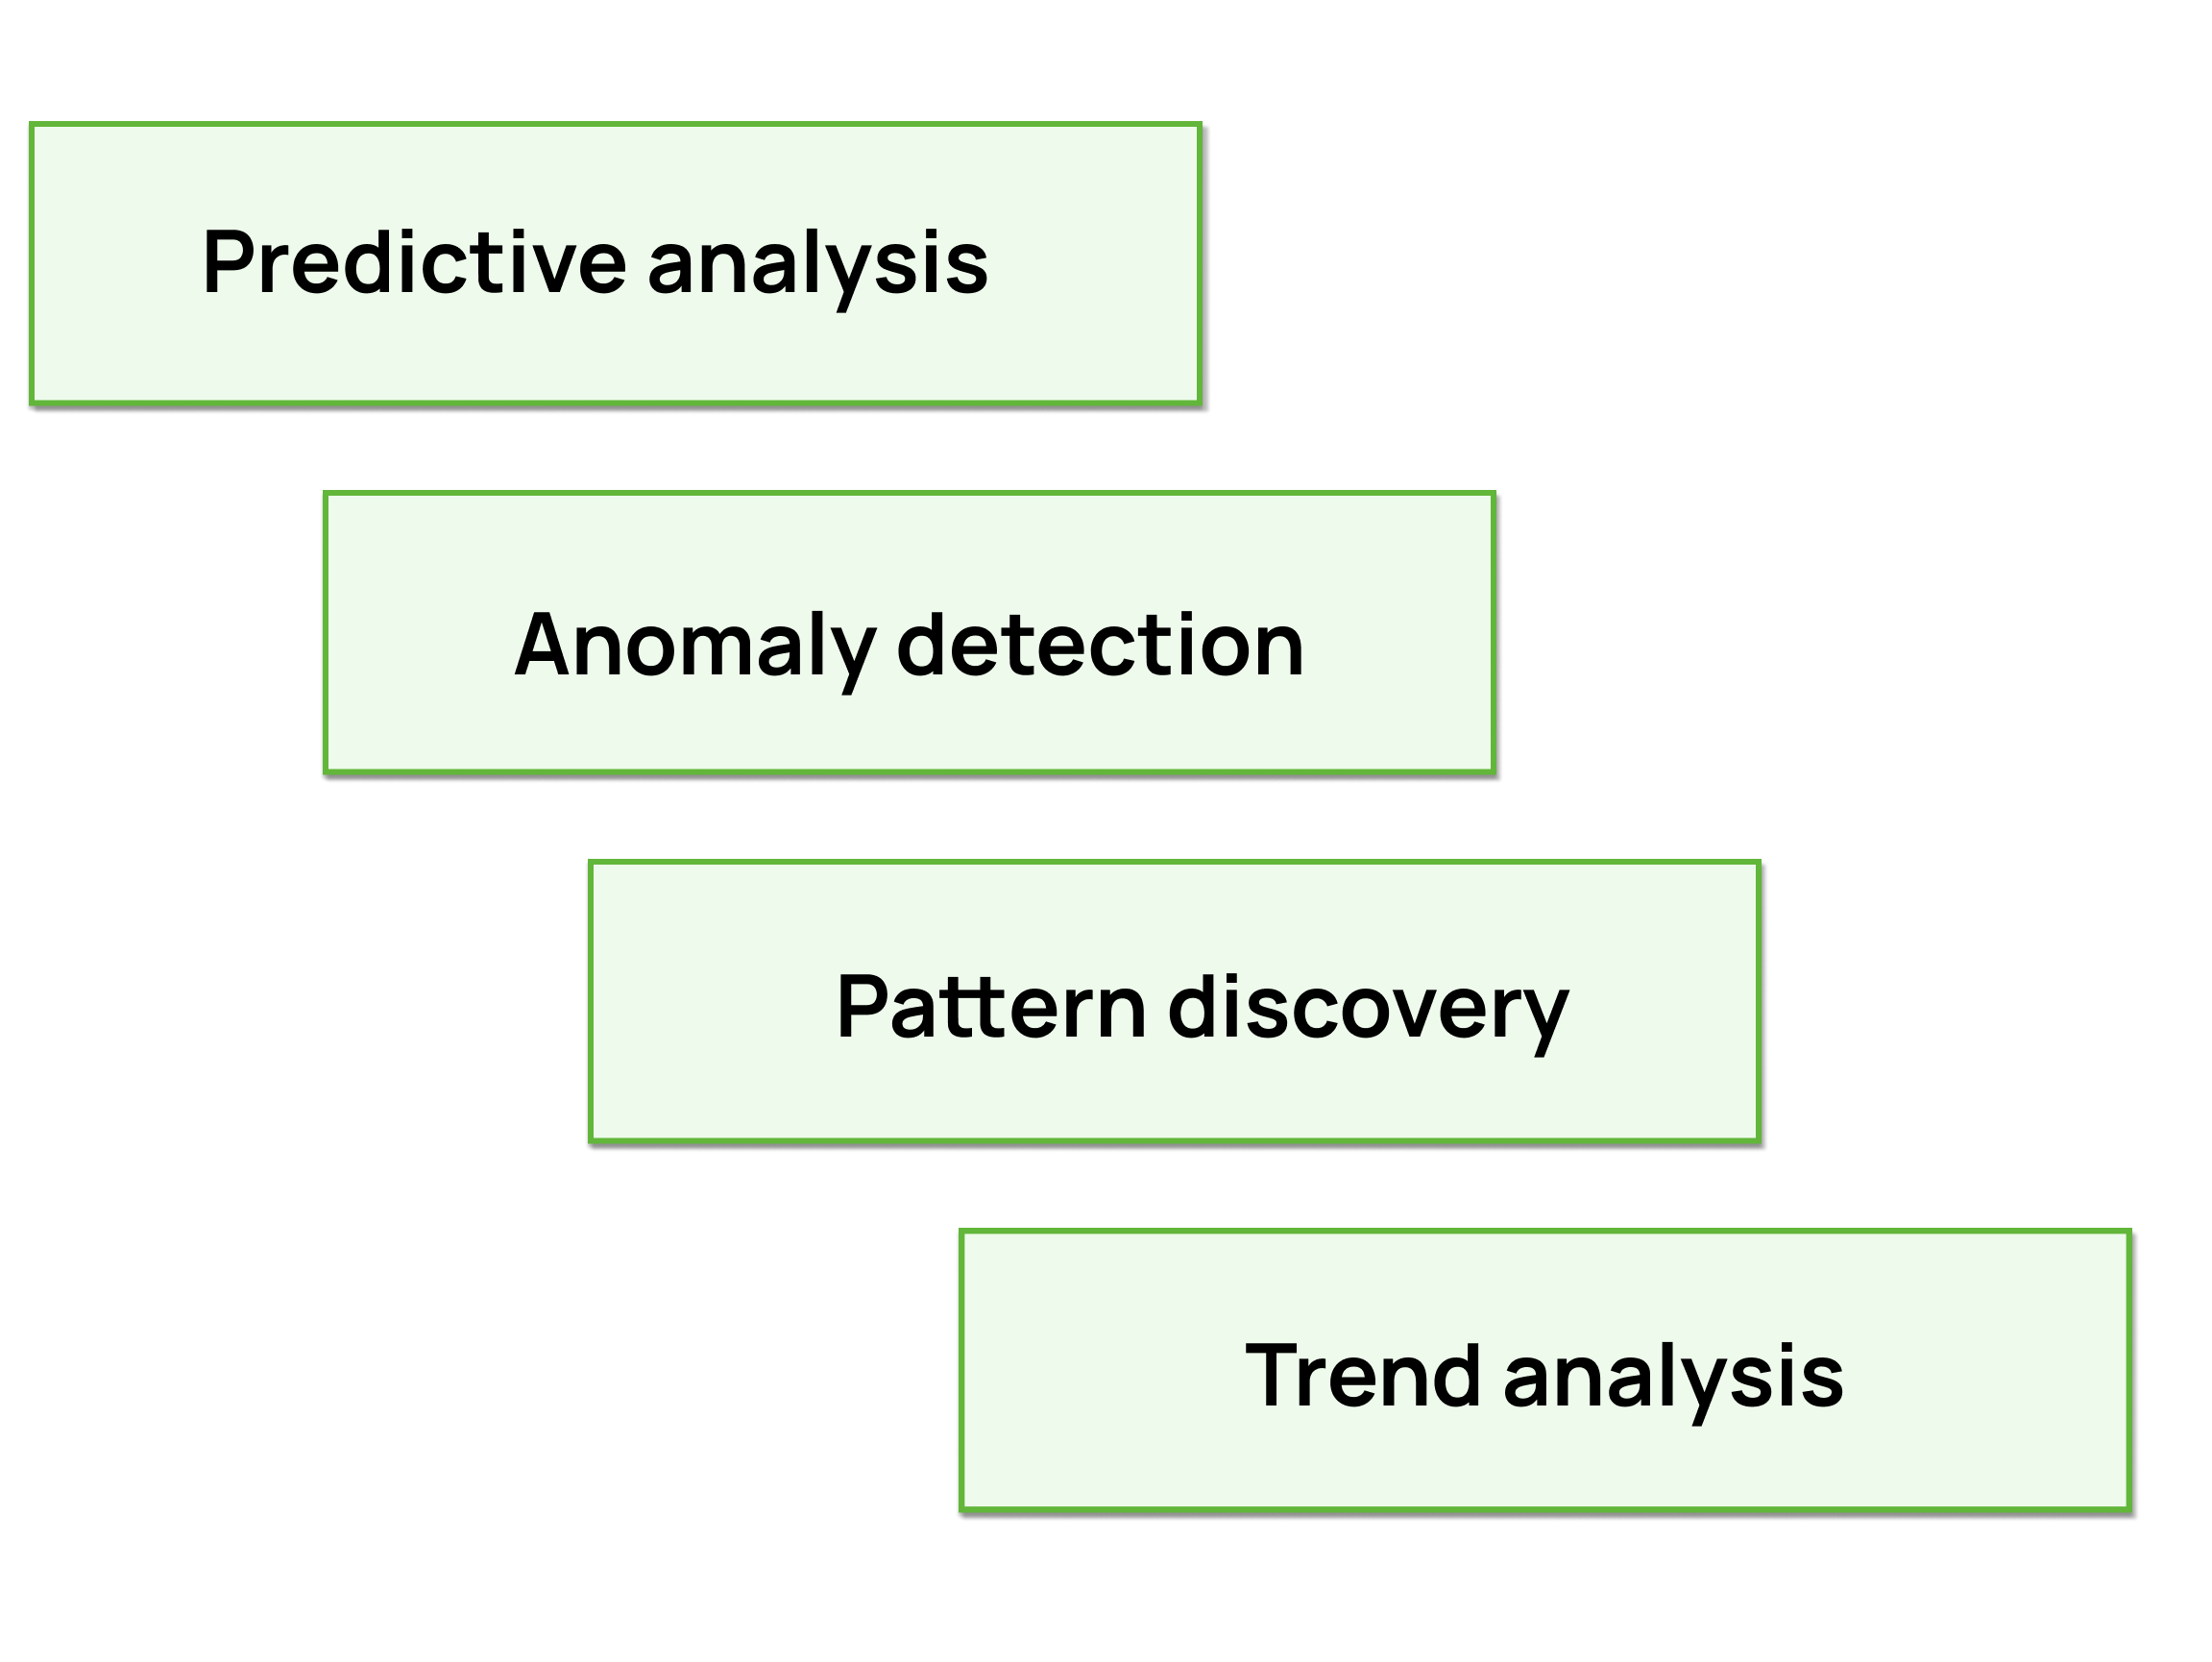
Analytical dashboard benefits
Analytical dashboard benefits
Analytical dashboard benefits
Guiding future decisions based on historical data
Identifying unusual behavior in business trends
Uncovering hidden patterns and how variables interact
![]()
Analytical dashboard benefits
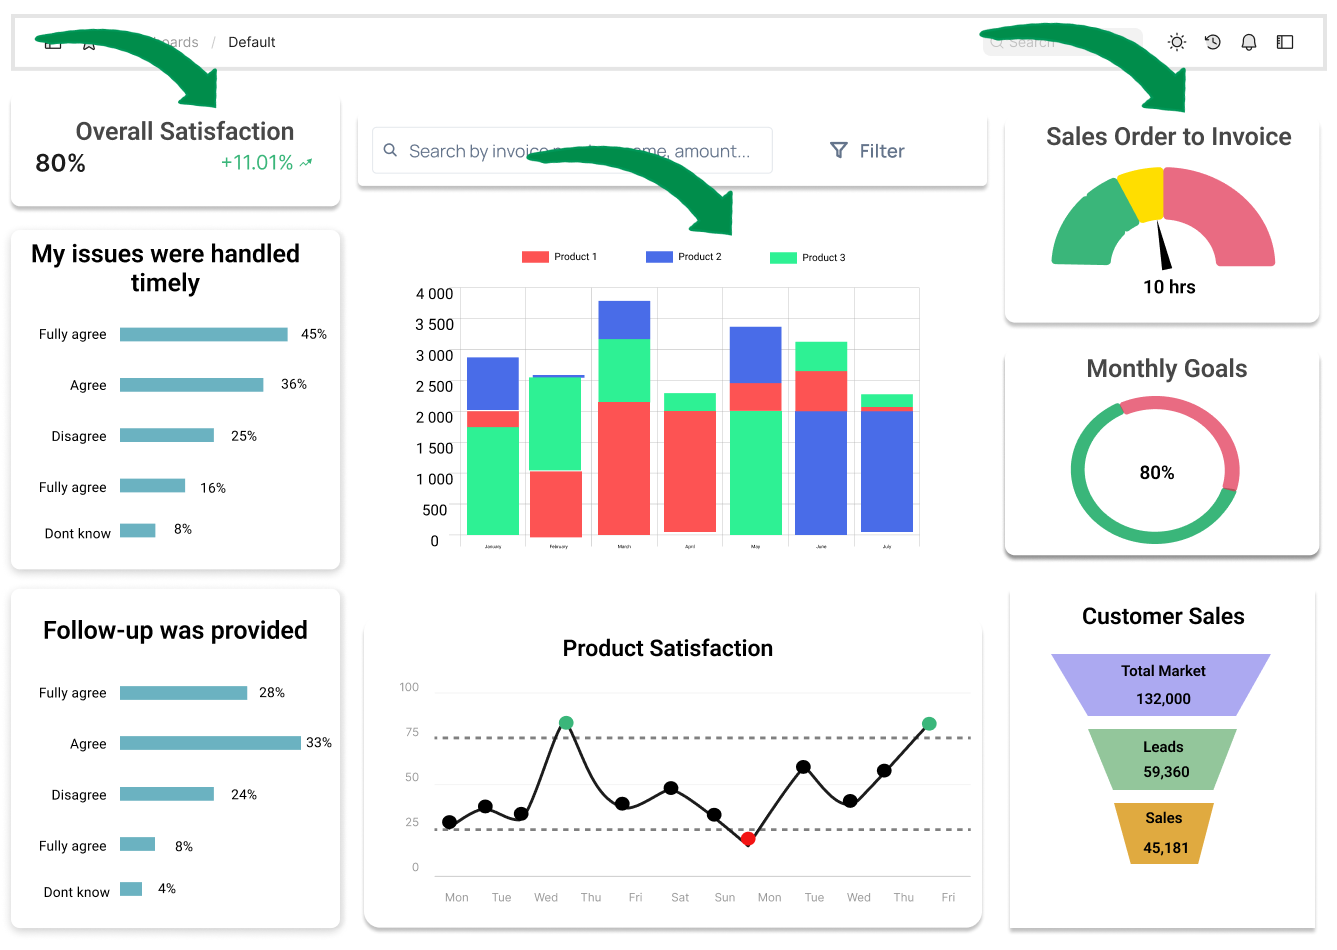
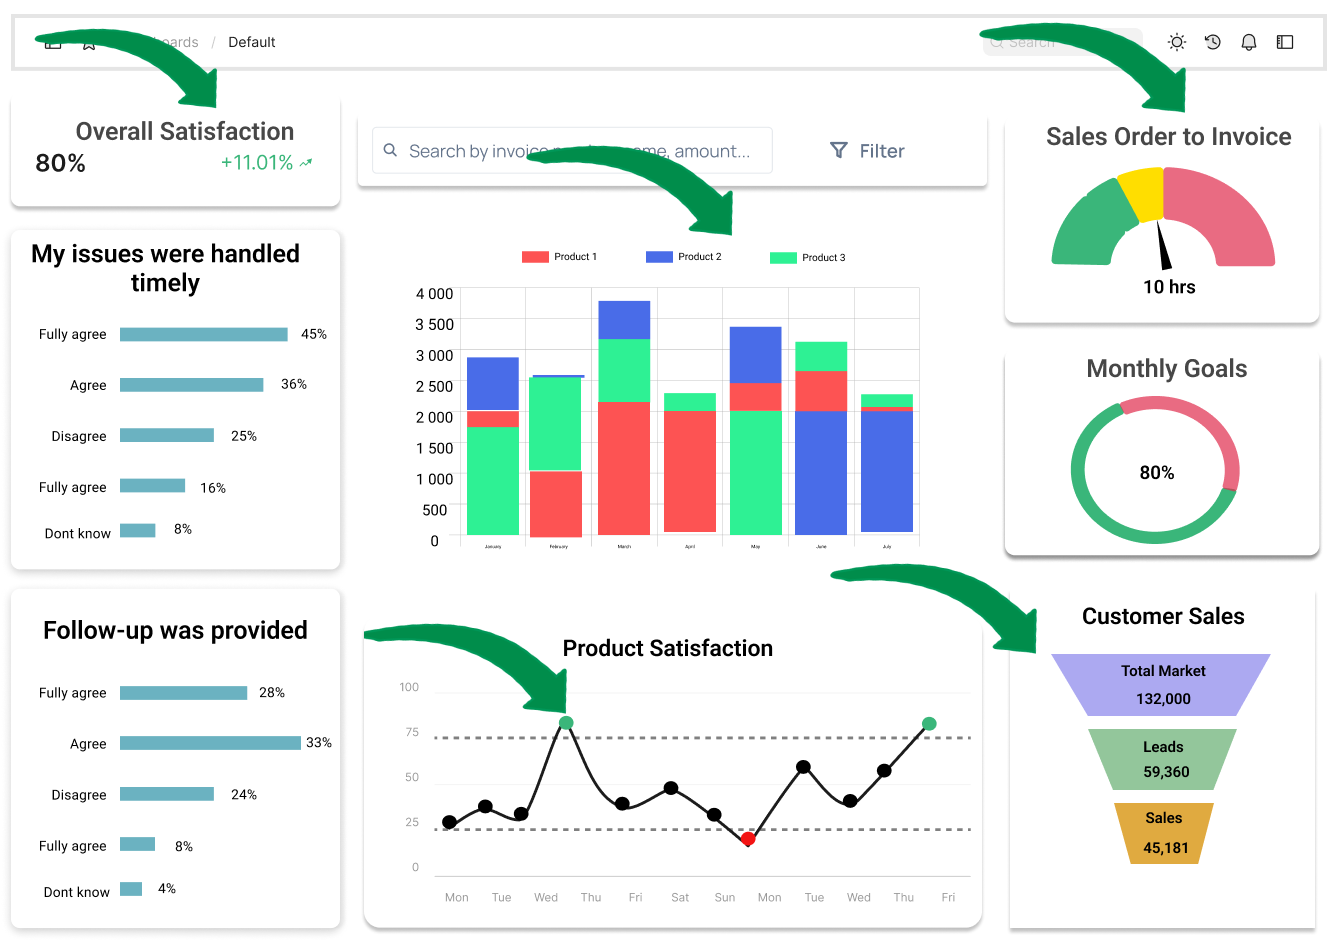
Analytical dashboard graphical components
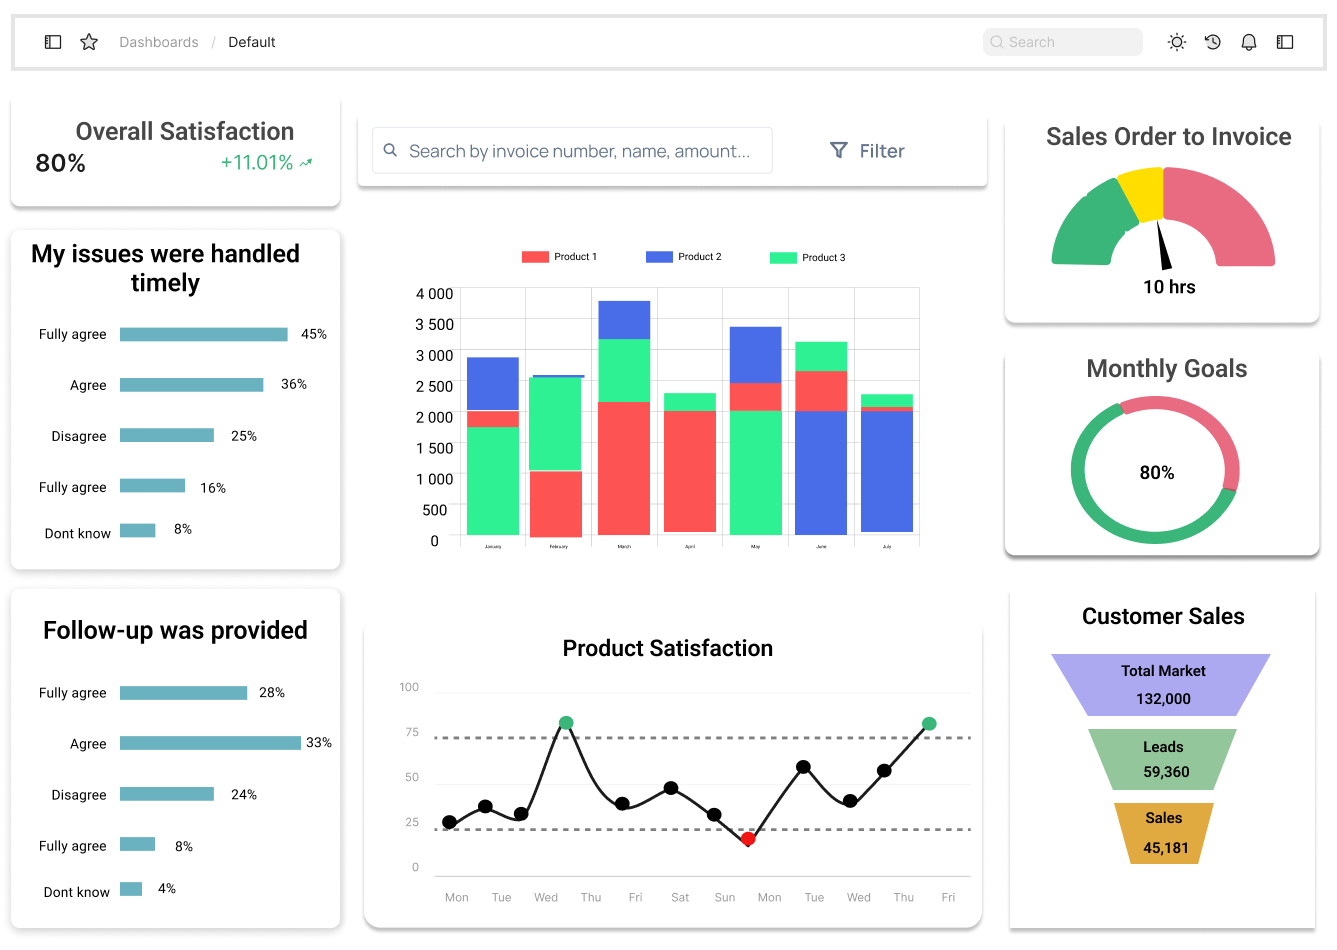
1 Zoho analytics. 2017. Analytical dashboard.
Analytical dashboard graphical components
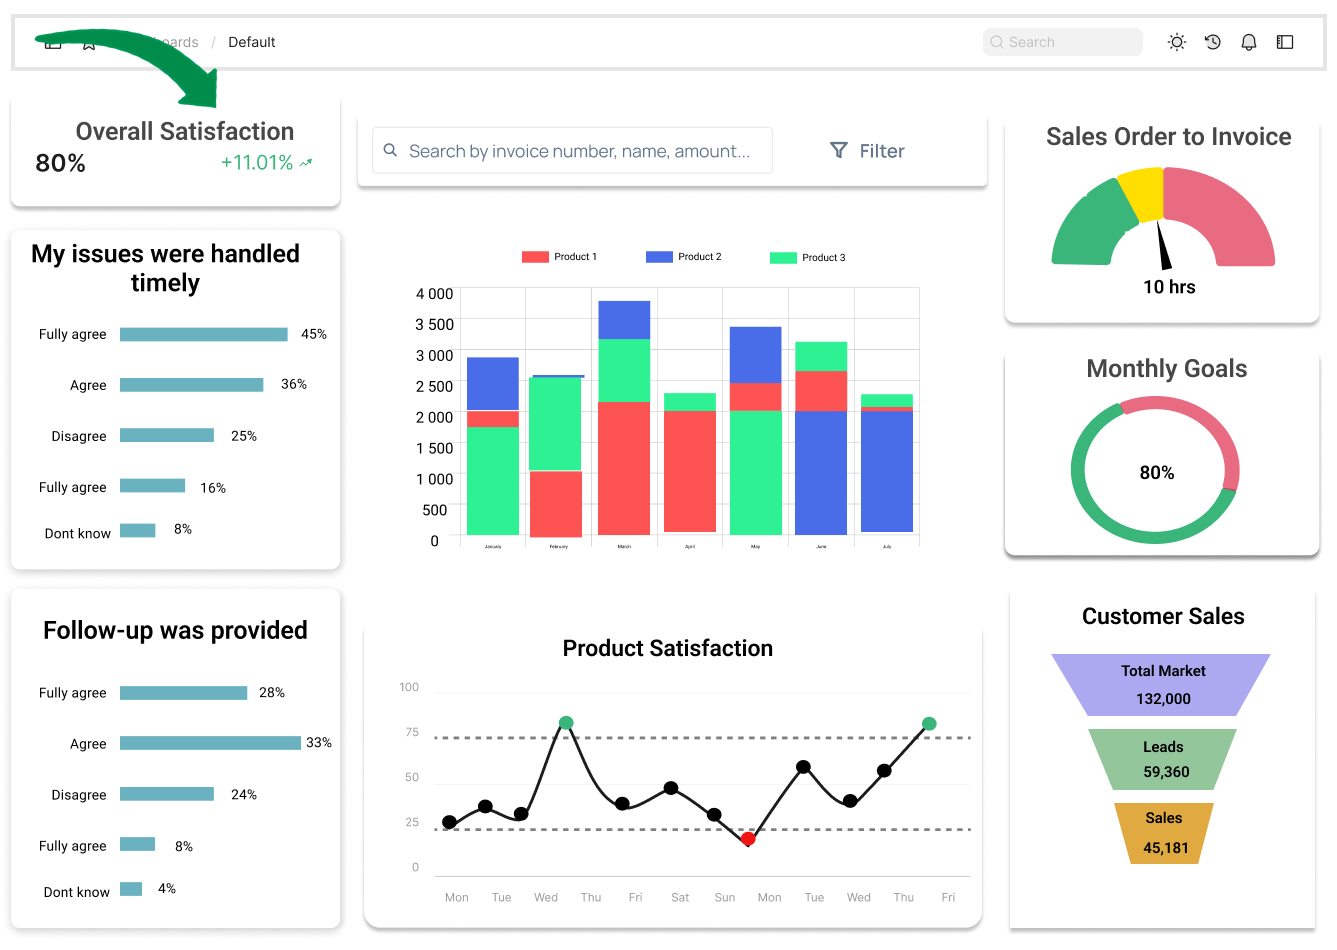
1 Zoho analytics. 2017. Analytical dashboard.
Analytical dashboard graphical components
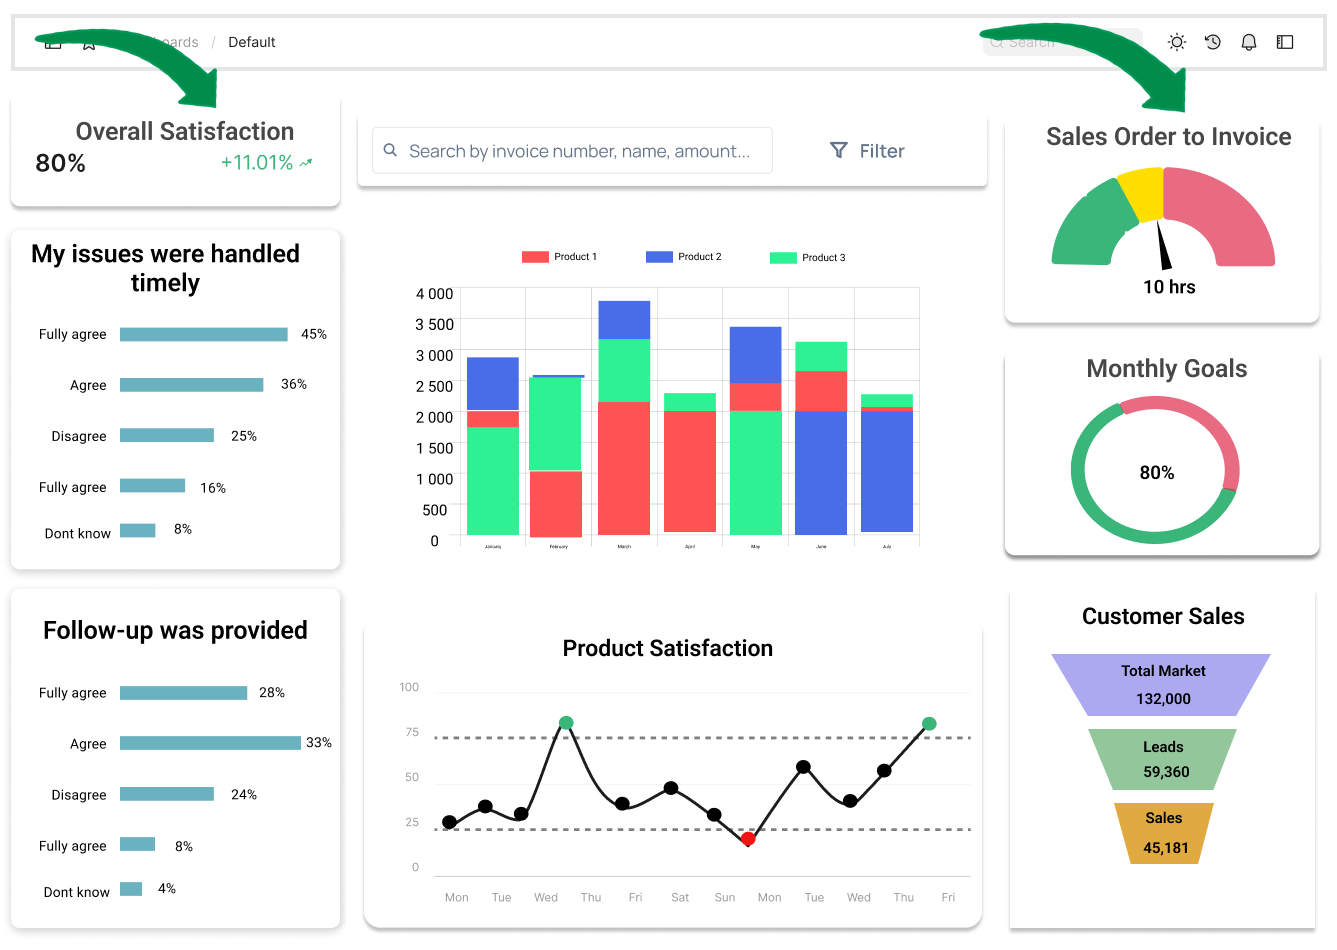
1 Zoho analytics. 2017. Analytical dashboard.
Analytical dashboard graphical components
1 Zoho analytics. 2017. Analytical dashboard.
Analytical dashboard graphical components

1 Zoho analytics. 2017. Analytical dashboard.
Analytical dashboard graphical components
1 Zoho analytics. 2017. Analytical dashboard.
A special word about funnel charts
- Sequential stages of a business process (sales pipeline, marketing campaign outreach)
- Starts from a broad head and breaks down into smaller segments
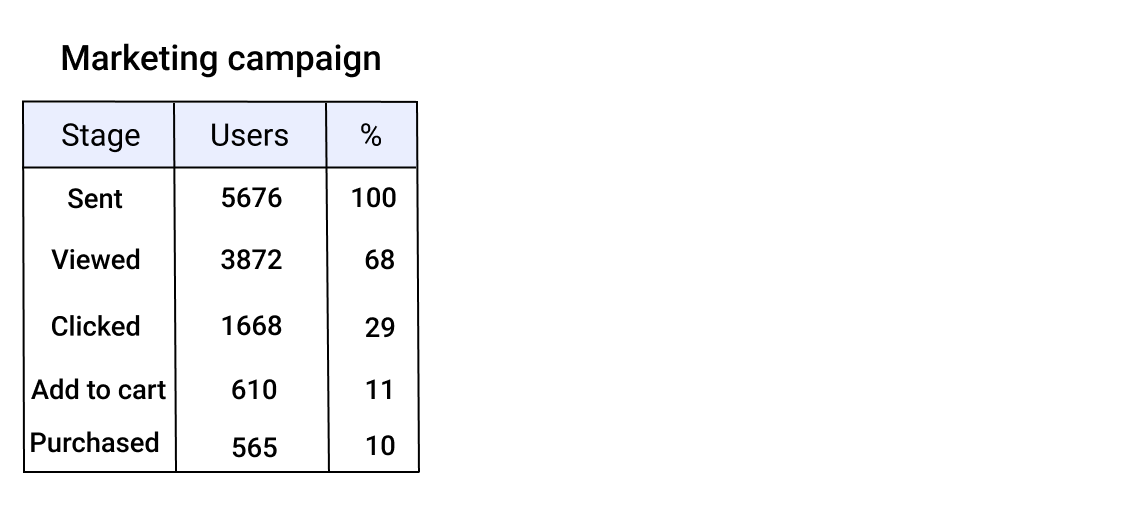
A special word about funnel charts
- Sequential stages of a business process (sales pipeline, marketing campaign outreach)
- Starts from a broad head and breaks down into smaller segments
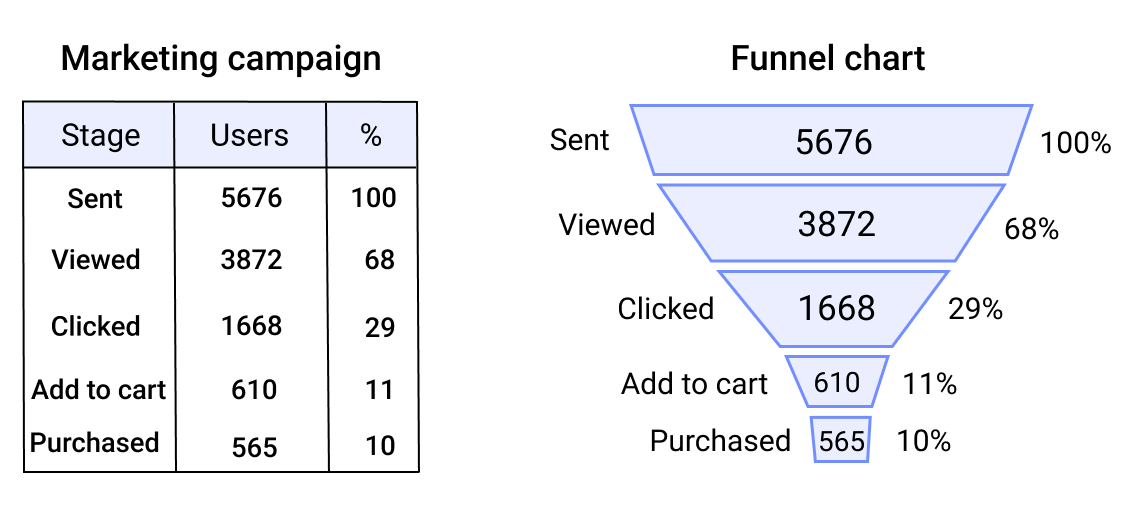
- Used as a high-level discovery visualization
Financial analytical dashboard
Objective: improving investment opportunities
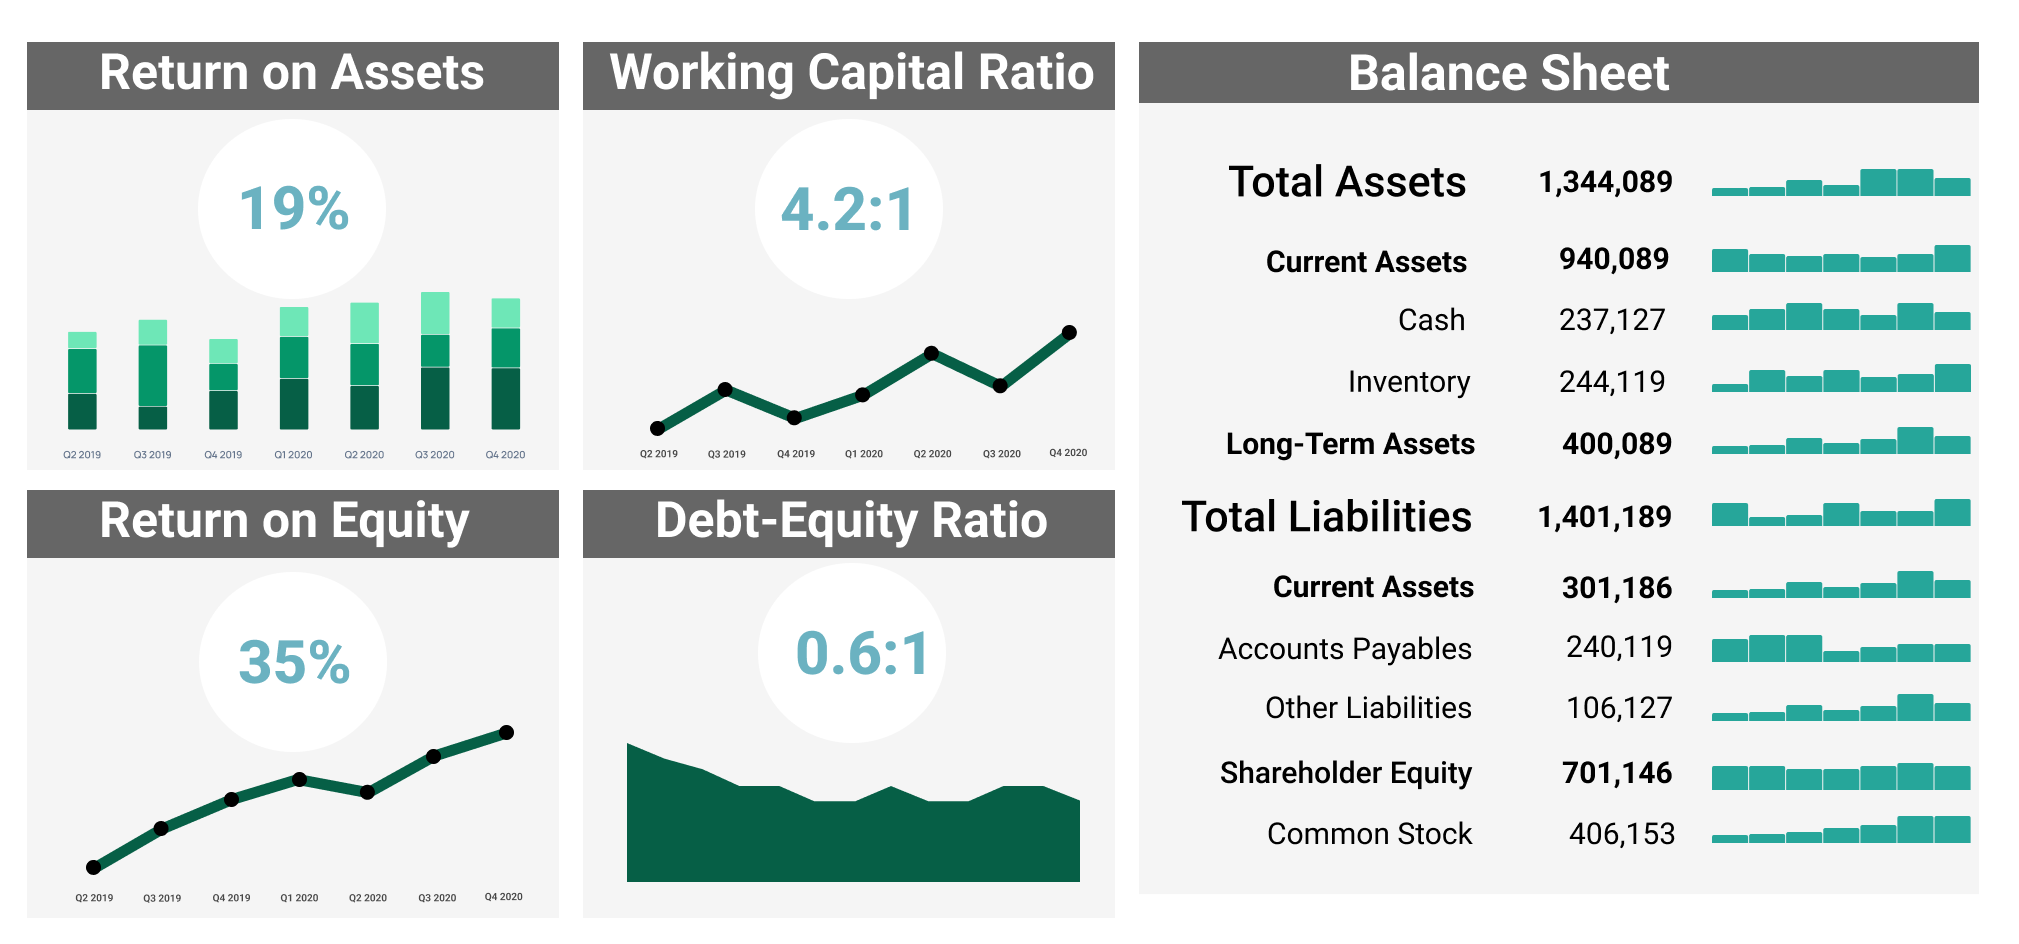
1 Calzon, Bernardita. (2021). Dashboarding. Make Sure You Know The Difference.
Healthcare analytical dashboard
Objective: patients' care improvement
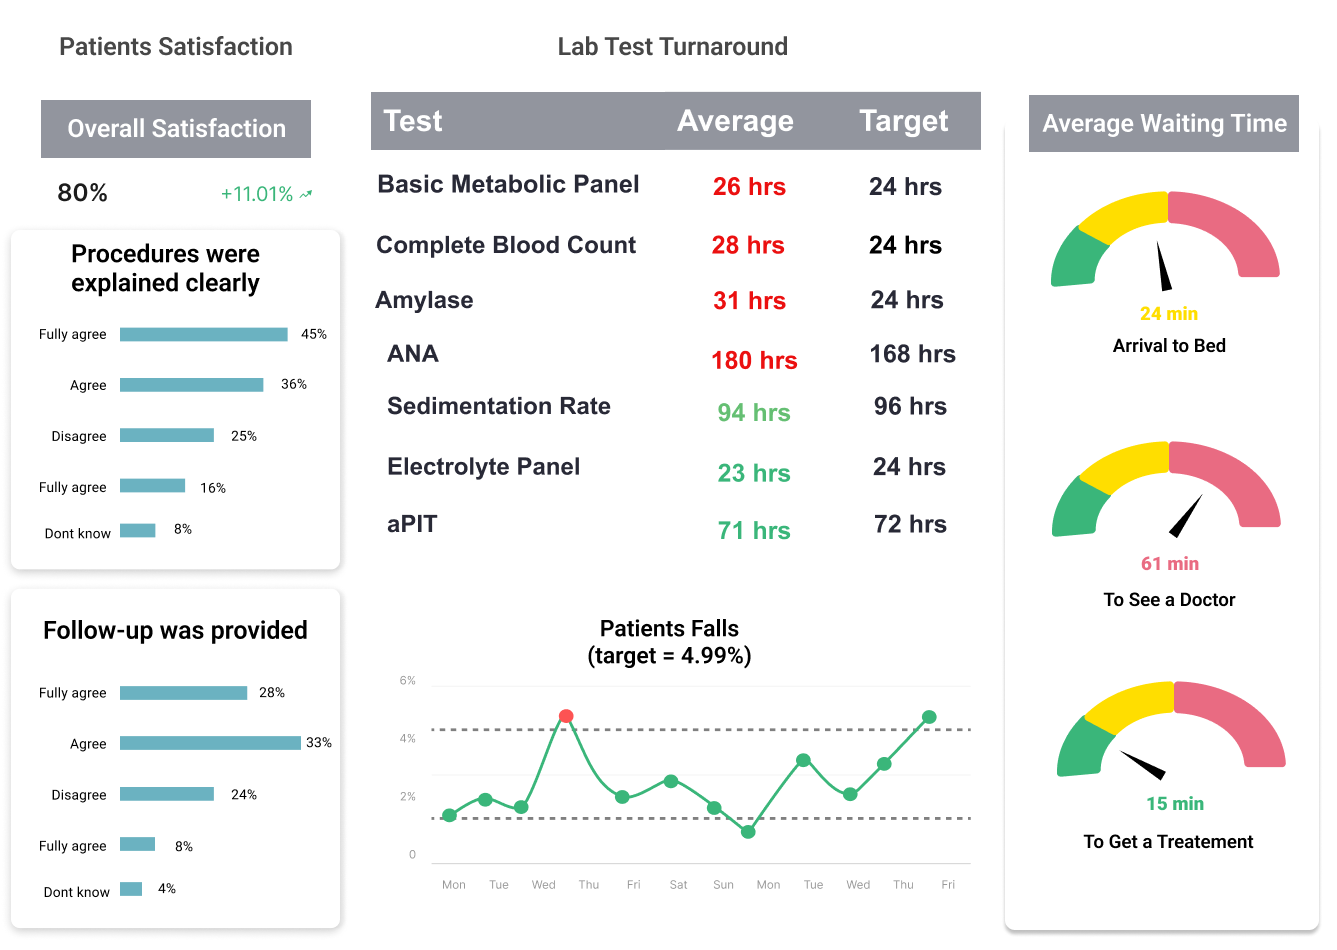
1 Calzon, Bernardita. (2021). Dashboarding. Make Sure You Know The Difference.

