Data Analysis in Google Sheets
James Chapman
Curriculum Manager, DataCamp
Measures of frequency:
Measures of center:
Measures of spread:
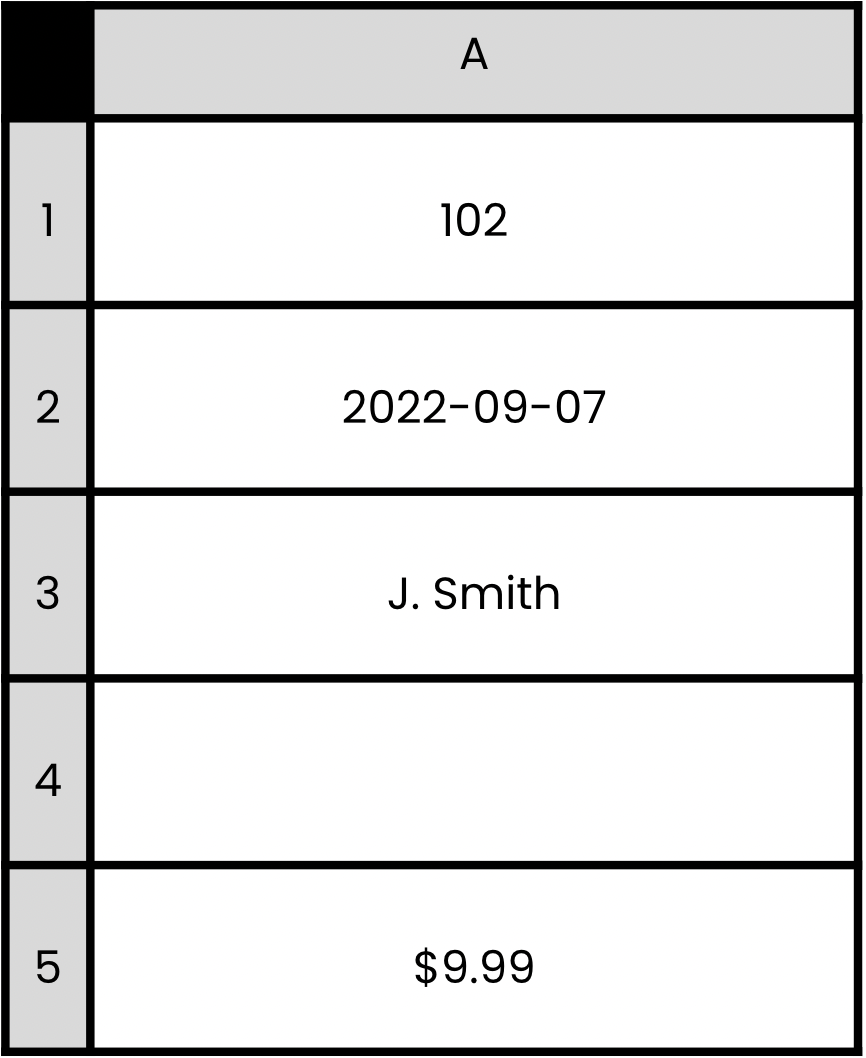
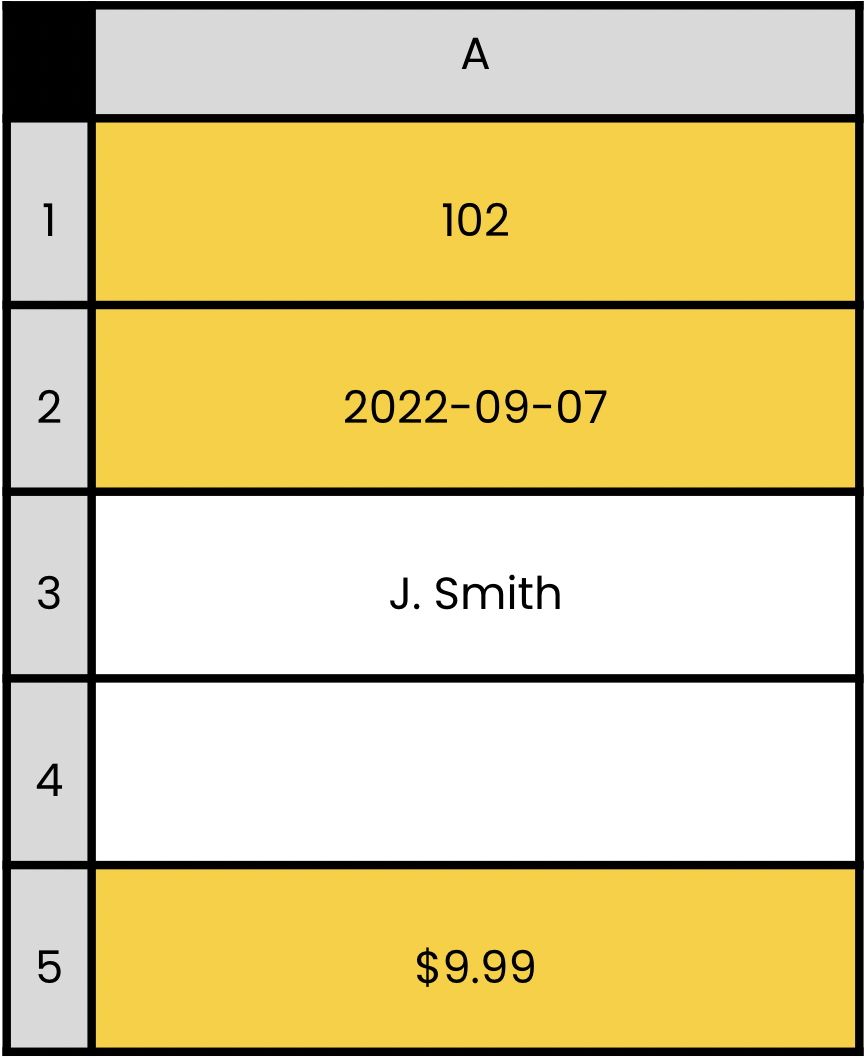
COUNT()
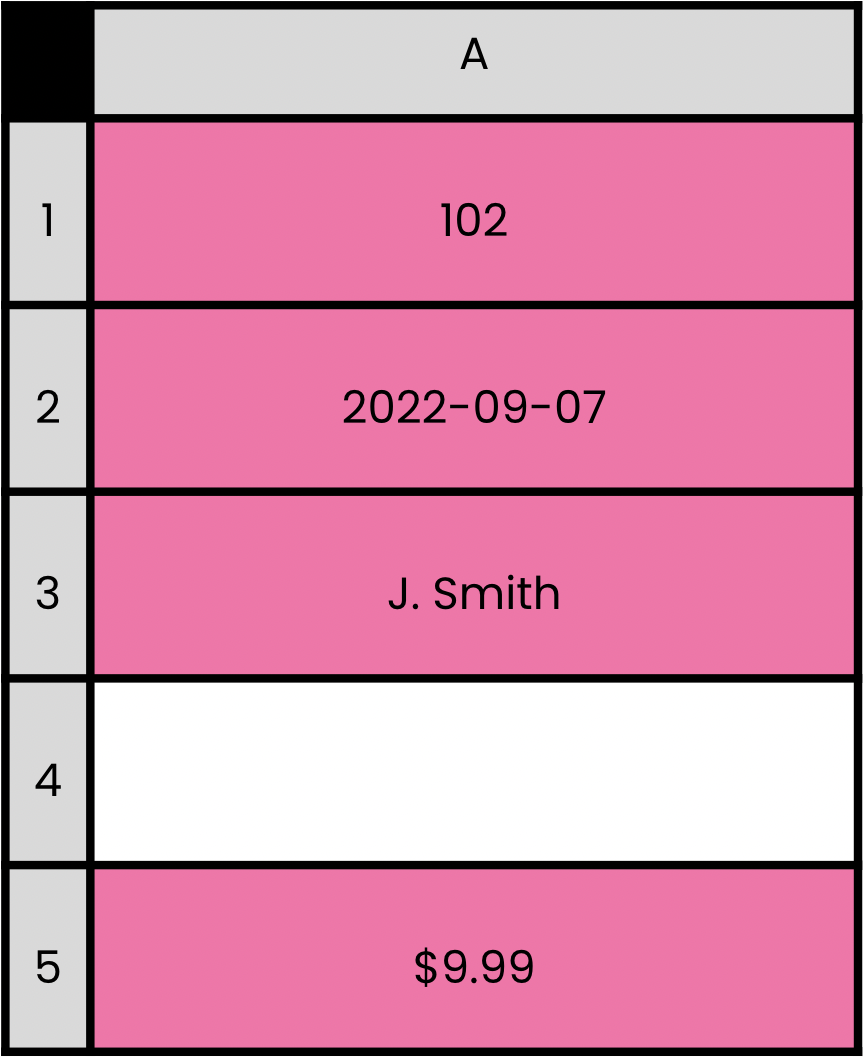
COUNTA()
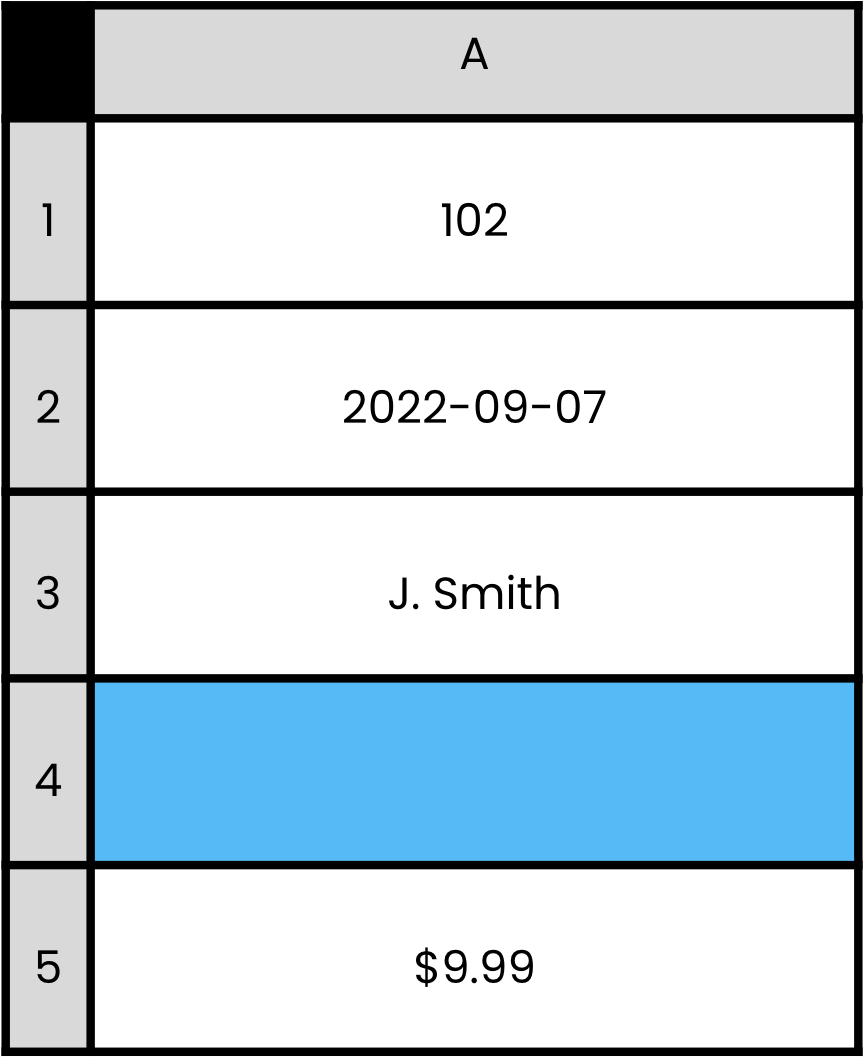
COUNTBLANK()
= COUNT(A1:A5)
3
""
#DIV/0!
= COUNTA(A1:A5)
4
= COUNTBLANK(A1:A5)
1
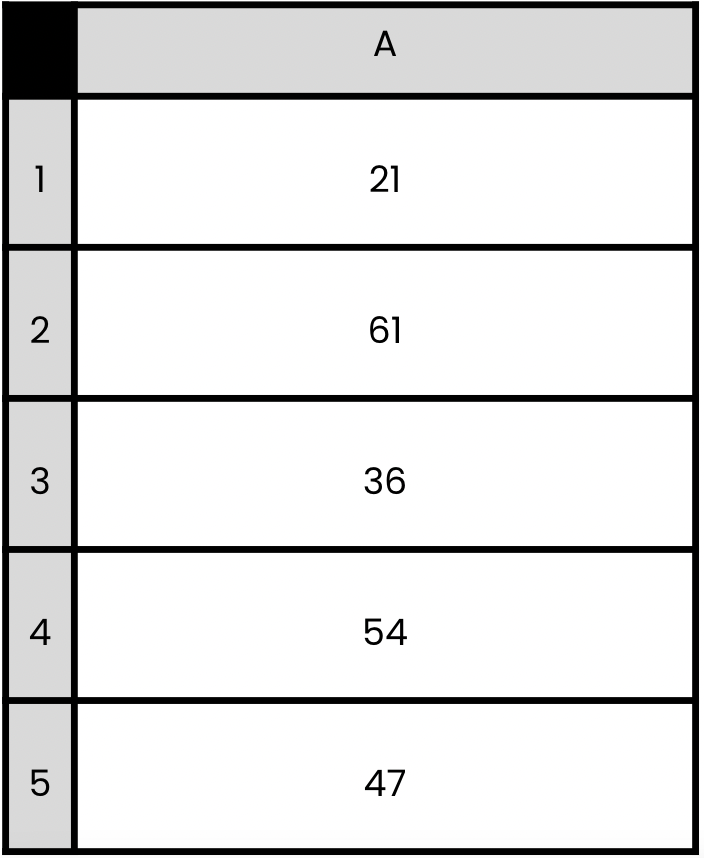
= SUM(A1:A5)
219
= SUM(A1:A5) / COUNT(A1:A5)
43.8
= AVERAGE(A1:A5)
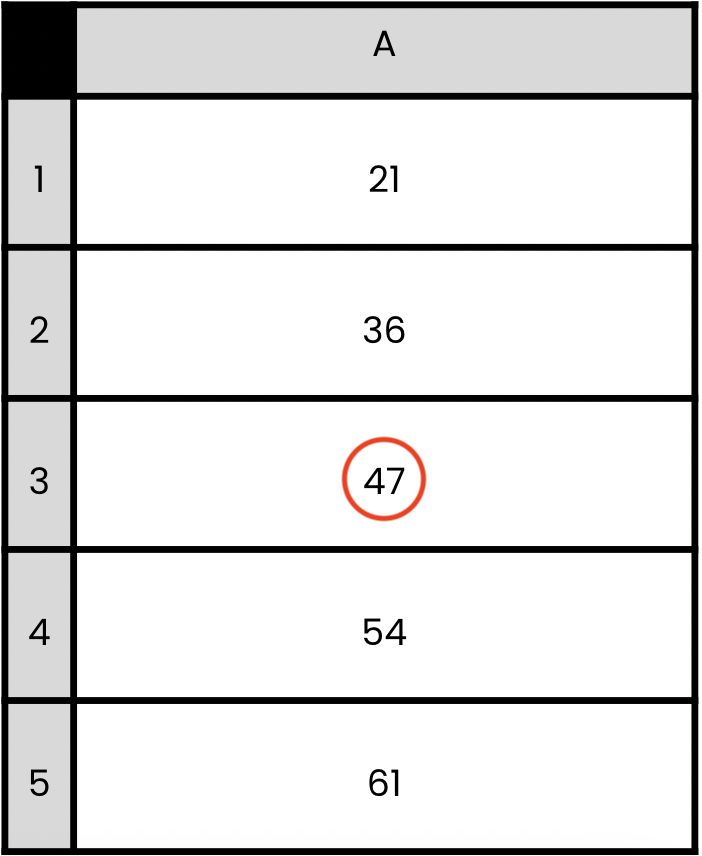
= MEDIAN(A1:A5)
47
MAX()
MIN()
-1
250