Simulation ensembles: Monte-Carlo sampling
Discrete Event Simulation in Python

Diogo Costa (PhD, MSc)
Adjunct Professor, University of Saskatchewan, Canada & CEO of ImpactBLUE-Scientific
System response to different scenarios
- Non-deterministic processes cause variation in system response
- Previous video: Learned how to model non-deterministic processes
- Characterize uncertainty propagation in model
- Study system's response to different scenarios
This can assist with
- Planning business expansions
- Performing stress tests
- Preparing for extreme situations
Monte Carlo sampling
- Repeated random sampling
- Model system with small changes
- Examine system response to change
Parameter space as samples increase
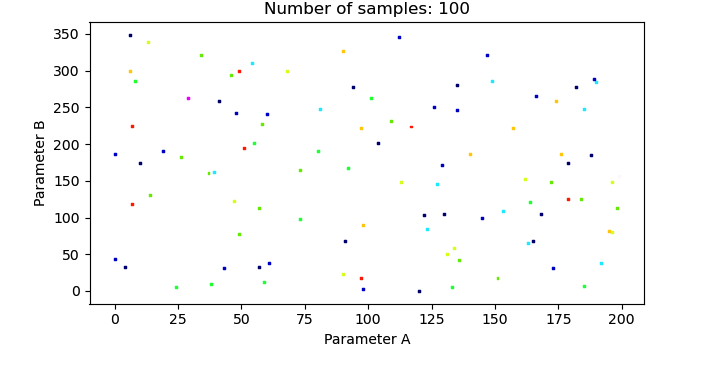
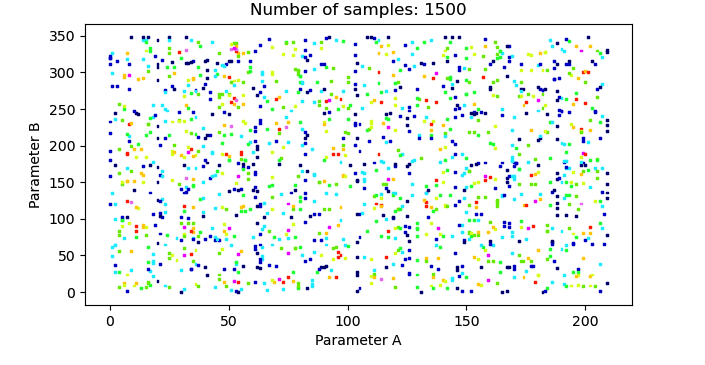
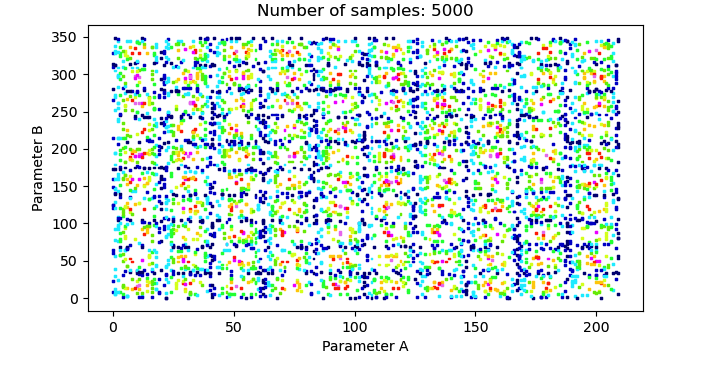
Monte Carlo sampling: Process investigation
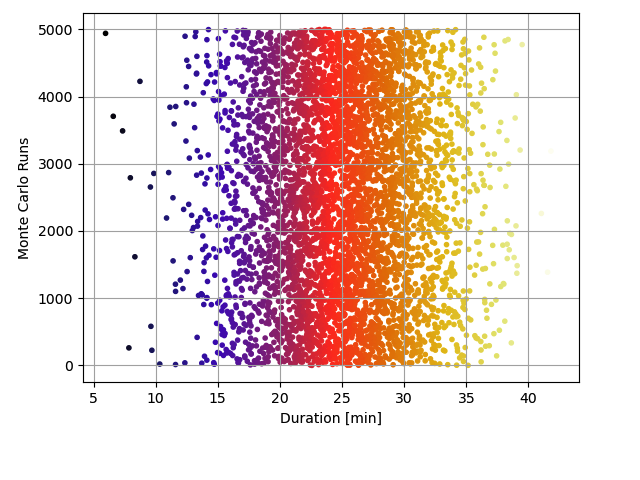
Example: Monte Carlo run to understand range of outputs of an event generator based on normal (gauss) distribution
import random as rd
import matplotlib.pyplot as plt

# Generating samples: Gaussian distribution
duration_sample = [rd.gauss(25, 5)
for i in range(5000)]

# Plotting
plt.scatter(duration_sample, np.r_[0:5000],
marker='.', c=duration_sample, cmap='CMRmap')
plt.xlabel("Duration [min]")
plt.ylabel("Monte Carlo Runs")
Plotting results
Monte Carlo sampling: Discrete-event models
Underlying objective
- Explore model uncertainty
- Arising from non-deterministic processes
- Characterize uncertainty
- Support decision-making
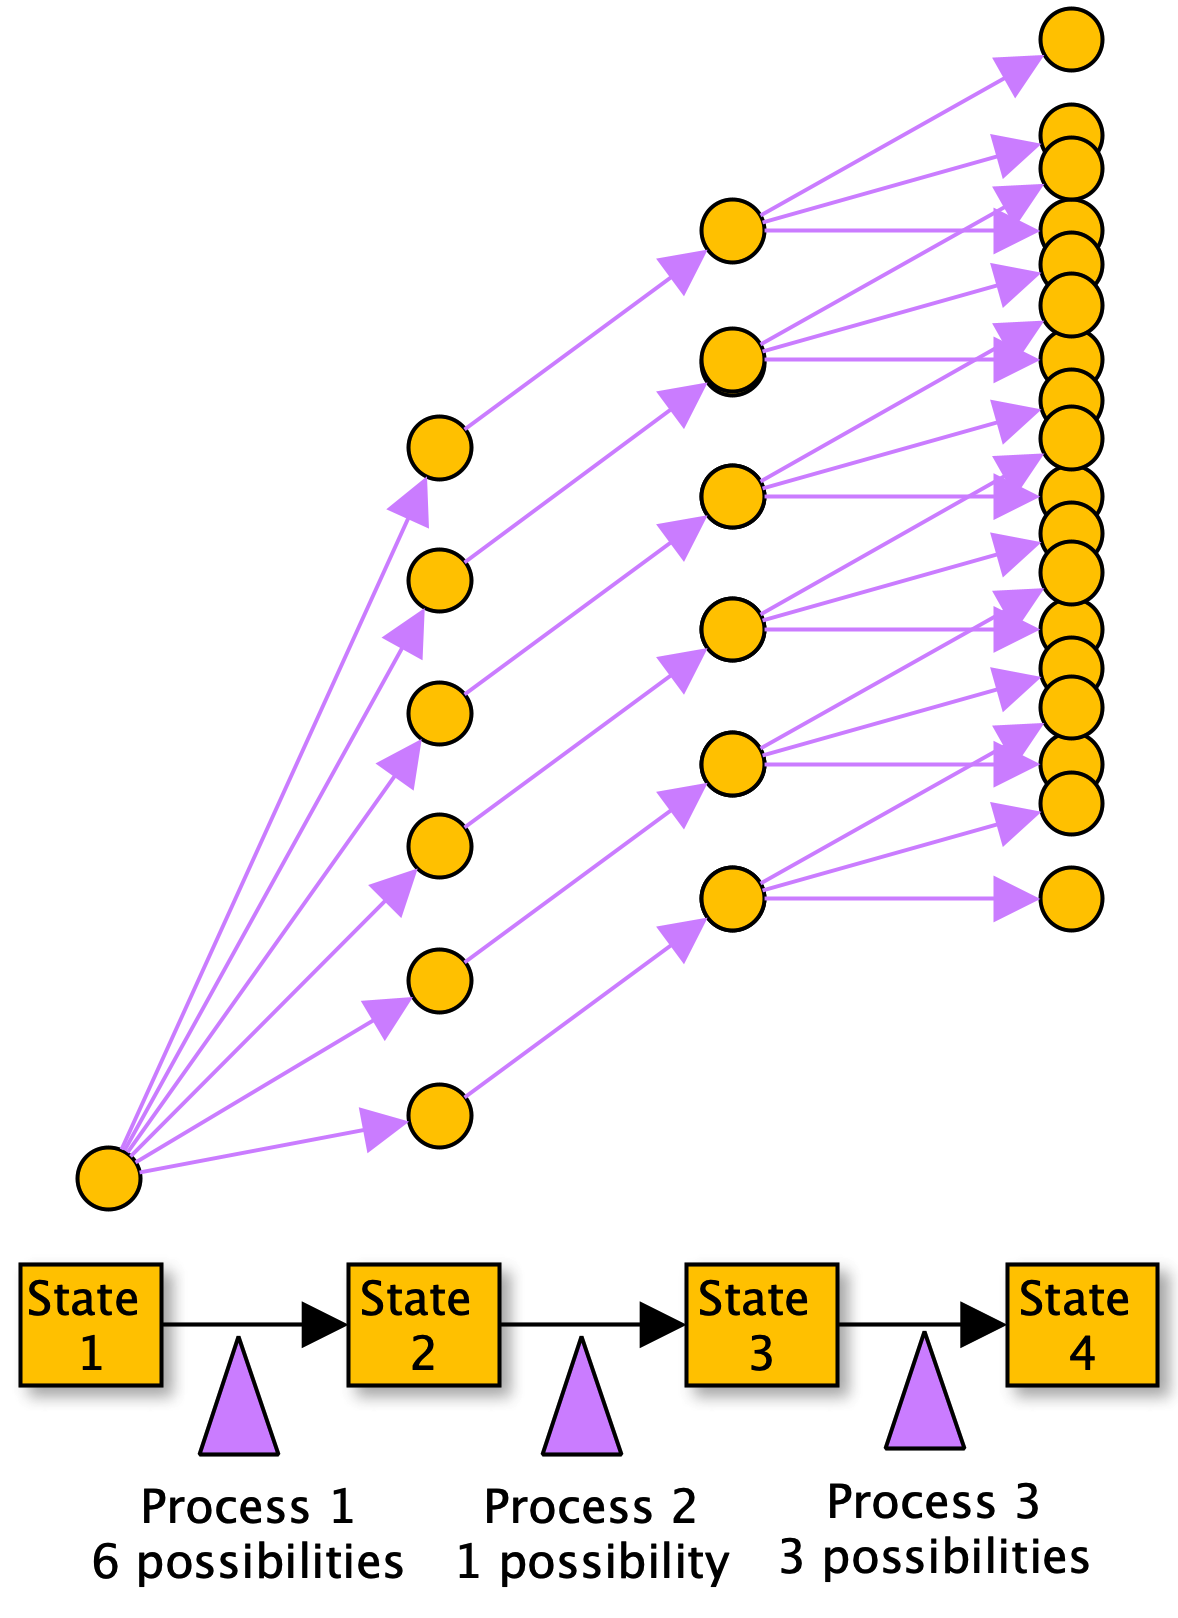
Monte Carlo sampling: Discrete-event models
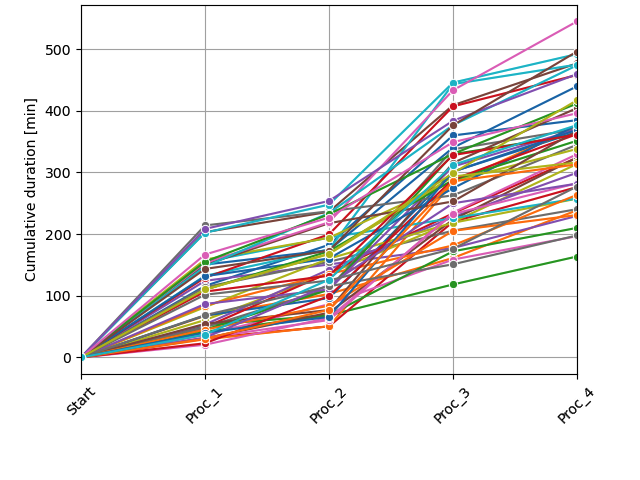
Uncertainty in each process duration propagates through system
Results in different model trajectories
Referred to as Response Envelope
Example:
n_trajectories = 50

process_1 = {"Name": "Raw_material",
             "OperationTime": 20,
             "MaxDelayTimePercent": 10}
process_2 = {"Name": "Unloading",
            "OperationTime": 15,
            "MaxDelayTimePercent": 5}
Let's practice!
Discrete Event Simulation in Python

