Clustering and cluster models
Discrete Event Simulation in Python

Diogo Costa (PhD, MSc)
Adjunct Professor, University of Saskatchewan, Canada & CEO of ImpactBLUE-Scientific
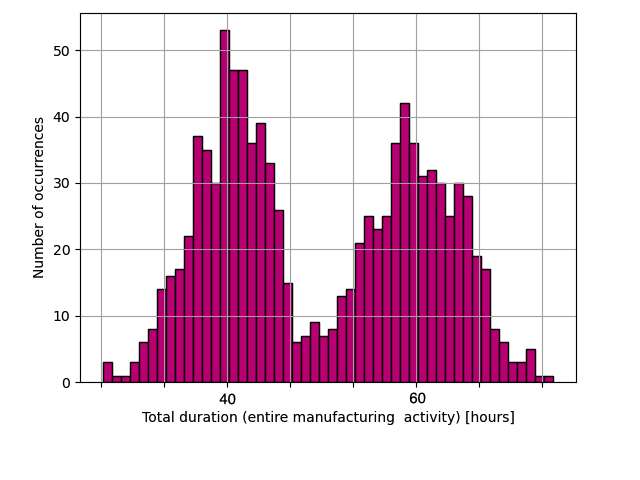
Histograms of model results
Use: Create an histogram of dataset data with 50 bins
plt.hist(data, bins=50)
Cluster analysis and application to models
- Applications
- Pattern recognition (e.g., model results)
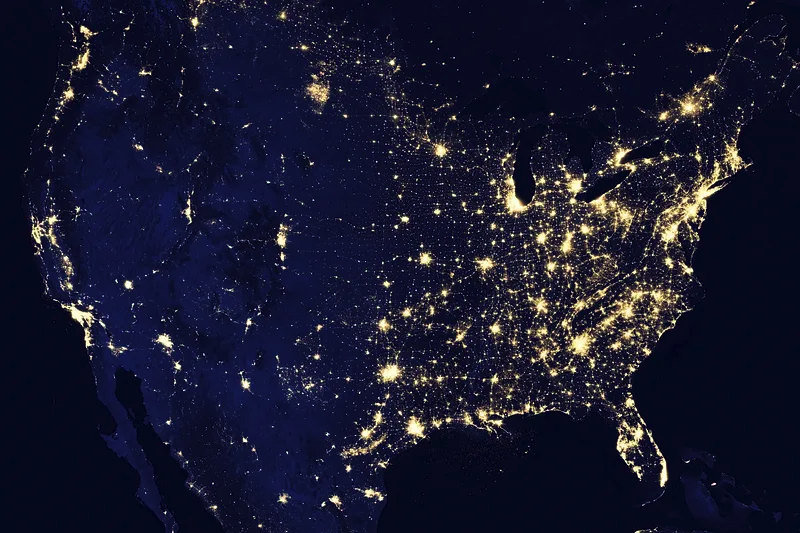
- Image analysis
- Data compression
- Computer graphics
Machine learning

In discrete-event models
- Identify model output patterns
- More actionable information
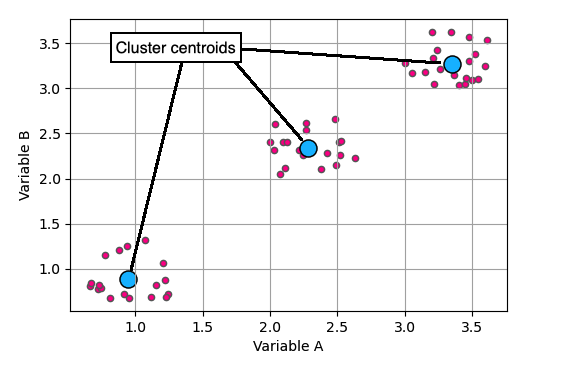
k-means clustering
Observations and cluster centroids
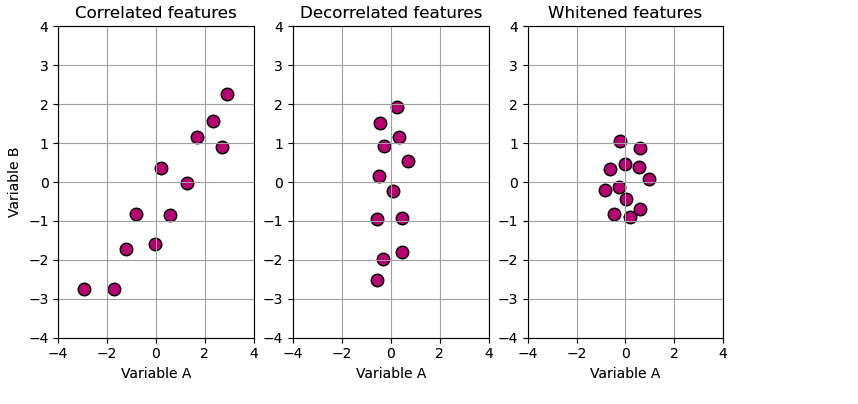
Data whitening: Decorrelation and rescalling
Before running k-mean: Data whitening
- Decorrelate
obsdata - Rescale each dimension of
obsby its standard deviation
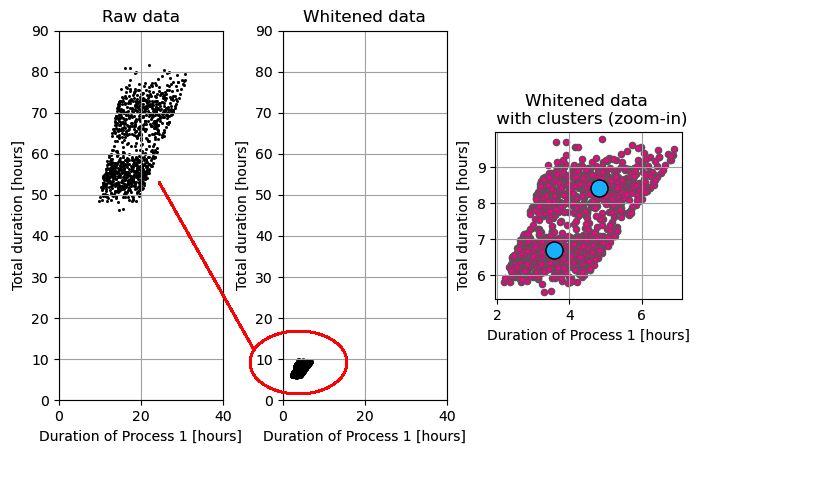
Example of whitening and k-means
- Manufacturing activity involving several processes
- Let's examine the impact of
Process 1