Mathematical models of dynamic systems
Discrete Event Simulation in Python

Diogo Costa (PhD, MSc)
Adjunct Professor, University of Saskatchewan, Canada & CEO of ImpactBLUE-Scientific
What is a mathematical model?
Description of a natural or human-driven system using mathematical concepts and language.
Models can be classified as:
- Dynamic vs. non-dynamic
- Discrete vs. continuous
- Deterministic vs. probabilistic (stochastic)
- Linear vs. nonlinear
- Others
Mathematical models can be simple or complex.
- Digital approximations of reality
- Impossible to account for all processes
George Box: "All models are wrong, but some are useful."

Example: model to predict natural processes
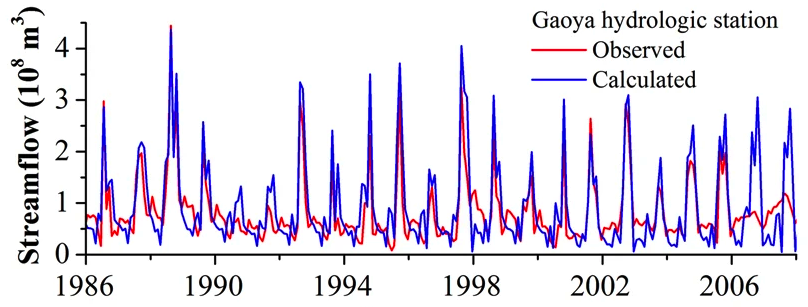
Model of flow in a river

This model predicts streamflow for the Goaya hydrologic station, China.
The prediction is based on rainfall information that is used as model input.
Other examples
- Weather forecast
- Ocean swell forecast
- Water quality in lakes
- Urban flooding
- and many other applications
Example: model to predict human-driven activities
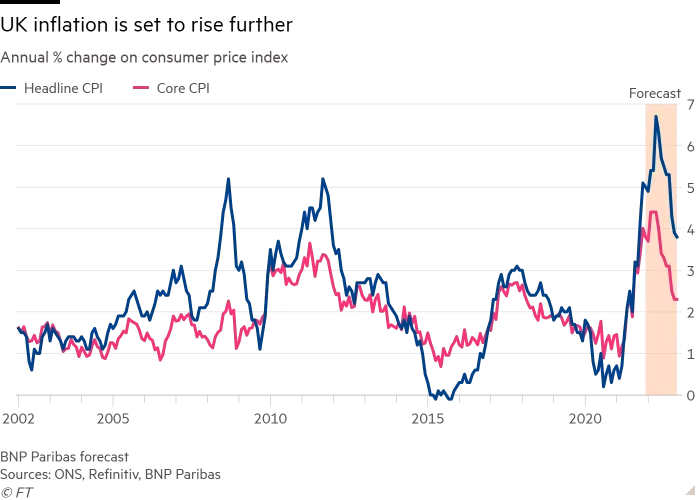
Predicting Inflation

- Predicting inflation is hugely important to help avoid economic crises
Other examples
- Supply-Chain
- Manufacturing
- Logistics
- Economic forecasts
- Transport
- Others
General code components and structure
- 3 main components
- Input data and model parameters
# Define model parameters
processes = {"process_1": 5,
             "process_2": 2,
             "process_3": 3}
- Run configuration
# Simulation period
simulation_time = 365

# Run model
discrete_model(processes, simulation_time)
- Model engine
def discrete_model(processes, simulation_time): # 1) Run end-condition while (time < simulation_time): process_names = list(processes.keys())# 2) Loop over all processes for p in range(len(process_names)): process_name_p = process_names[p]# 3) Account for effect of each process time += processes[process_name_p]
Model outputs
Example of a discrete-event model output for a manufacturing activity
=> START OF SIMULATION  (Time = 0 days)
Time =    6.00 days  |  Process Complete: Transport of raw material
Time =    9.00 days  |  Process Complete: Building components
Time =   11.00 days  |  Process Complete: Assembling parts
Time =   14.00 days  |  Process Complete: Selling product
=> COMPLETED: Supply-Chain cycle #1 | Time = 15.5 days
Time =   21.50 days  |  Process Complete: Transport raw material
Time =   24.50 days  | Process Complete: Building components
Time =   26.50 days  |  Process Complete: Assembling parts
Time =   29.50 days  |  Process Complete: Selling product
=> COMPLETED: Supply-Chain cycle #2 | Time = 31.0 days
Visualization of model results
Graphical visualizing of model results: helpful to identify patterns and tipping points in the system.
Visualization should be tailored to simulation objectives.
Many useful visualization packages available:
matplotlib,seaborn,plotly.


Examples
- 2D line or scatter plots of the modeled data (
y) vs. the corresponding time values (x)
plt.plot(x, y, color='green', marker='o',
         markersize=12, linestyle='dashed',
         linewidth=2)
- Histogram to bin the data in
xand count the number of values in each bin
plt.hist(x, 50, density=True,
         facecolor='g', alpha=0.75)
Let's practice!
Discrete Event Simulation in Python

