Chi-square test
Analyzing Survey Data in Python

EbunOluwa Andrew
Data Scientist
Chi-square test
- Inferences about categorical variable distribution
- Compares observed observations to expected observations

Chi-square test in survey analysis
- Decide relationship between two categorical variables of a population
- $H_{o}$ = no relationship between variables
- $H_{a}$ = relationship between variables
- P-value
- if significant (<0.05), reject null hypothesis
- if insignificant (>0.05), accept null hypothesis
Why use chi-square testing in survey analysis
Input variables relevant to output variable
Understand impact of different variables on population
Check if differences are by chance or statistically significant

1 Photo by Firmbee.com on Unsplash
Assumptions of chi-square test on survey analysis
- Both variables = categorical
- Sample randomly selected from population
- Sample size > 100
- Expected frequencies >=5
Survey data for chi-square analysis
| pet_type | current_pets | time_spent | reduces_stress |
|---|---|---|---|
| dog | 1 | 420 | yes |
| dog | 1 | 180 | yes |
| dog | 4 | 30 | yes |
| dog | 1 | 30 | yes |
| dog | 1 | 60 | yes |
Survey data for chi-square analysis
- Sample size >100
- Two categorical variables:
pet_typereduces_stress
- $$H_{o} $$ NO relationship between the type of pet owned by pet owners and their perceived reduced stress
- $$H_{a}$$ relationship between the type of pet owned by pet owners and their perceived reduced stress
Steps of chi-square analysis on pet_survey in python
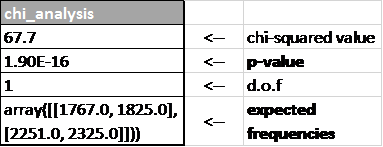
import pandas as pd import scipy.stats as st data = pd.read_csv('pet_survey.csv')cross_table = pd.crosstab(data.reduces_stress, data.pet_type)chi_analysis = st.chi2_contingency(cross_table)print(chi_analysis)
|--------------------------|
| (67.7,                   |
| 1.9e-16,                 |
| 1,                       |
| array([[1767.0, 1825.0], |
| [2251.0, 2325.0]]))      |
Result and interpretation of pet_survey
Frequencies >= 5
- Valid results
p-value < 0.05
- reject null hypothesis
pet_ownedandreduces_stressare related
Type of pet owned has an effect on whether pet owners perceive stress reduction

Let's practice!
Analyzing Survey Data in Python

