Chi-square test
Analyzing Survey Data in Python

EbunOluwa Andrew
Data Scientist
Chi-square test
- Inferences about categorical variable distribution
- Compares observed observations to expected observations

Why use chi-square testing in survey analysis
Input variables relevant to output variable
Understand impact of different variables on population
Check if differences are by chance or statistically significant

1 Photo by Firmbee.com on Unsplash
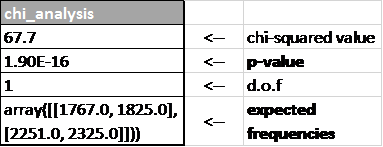
Result and interpretation of pet_survey