What is cluster sampling?
Entire population divided into several subgroups
- Subgroups has characteristics similar to the population
Population -> Clusters
Does not sample individuals, but randomly selects the whole subgroup
Why cluster sampling is important
- We cannot always gather data from the entire population
- Minimize error due to the large number in the population

Steps in cluster sampling analysis
- First, divide the population into clusters
- Second, perform a random selection of these clusters
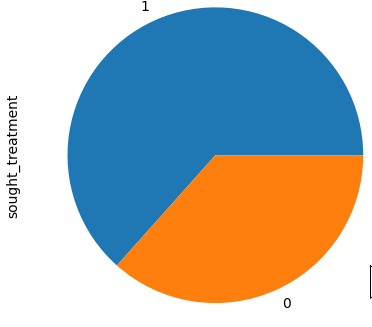
Sample dataset and plot
1 _partial data plotted due to space_
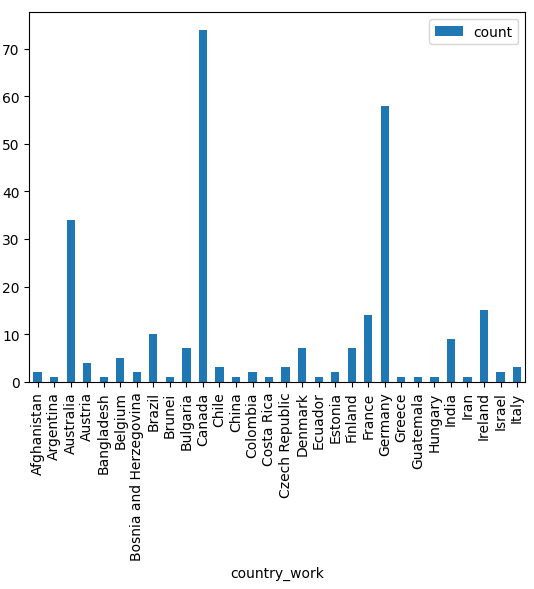
Plot cluster sample
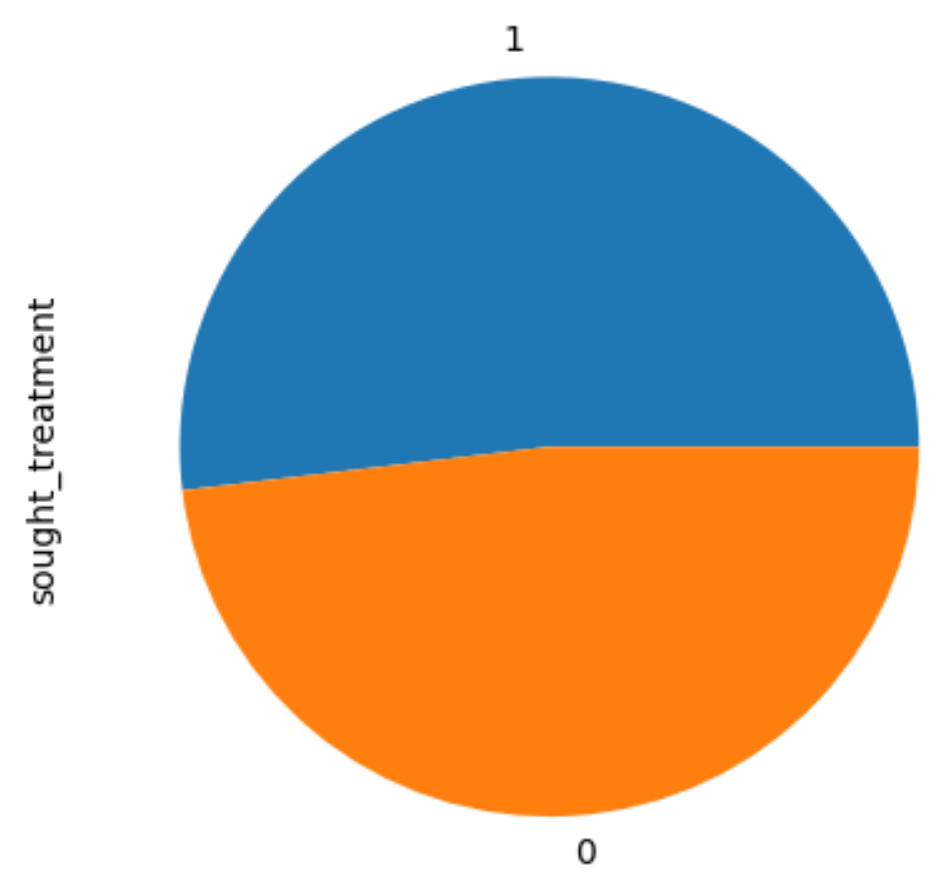
Plot cluster sample