Regression analysis

Analyzing Survey Data in Python

EbunOluwa Andrew

Data Scientist

Regression analysis

  • Understand the relationship between variables
  • Utilized to predict a precise outcome
  • Gauge influence of different independent variables on dependent variable
  • Forecasts potential future opportunities and risks
  • Reduces huge piles of raw data into actionable information
  • Provides factual support for informed decisions

People trying to keep downward financial arrow

Analyzing Survey Data in Python

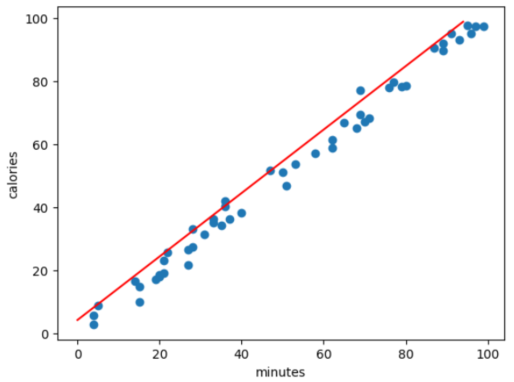
Linear regression using ordinary least squares (OLS) method

  • Linear regression model
    • Assumes linear relationship between x and y variable
    • y = m * x + b
    • Ordinary Squares (OLS) Method
    • Sum((calculated-observed)^2) => minimized

https://seeing-theory.brown.edu/regression-analysis/index.html

1 https://seeing-theory.brown.edu/regression-analysis/index.html
Analyzing Survey Data in Python

Loading data

import pandas as pd

import numpy as np
import matplotlib.pyplot as plt
import statsmodels.api as sm
exercise_data = pd.read_csv('workout_survey_data.csv') print(exercise_data.head())
| workout_minutes | calories_burned |
|-----------------|-----------------|
| 77              | 79.775152       |
| 21              | 23.177279       |
| 22              | 25.609262       |
| 20              | 17.857388       |
Analyzing Survey Data in Python

Define variables

x = independent variable y = dependent variable

x = exercise_data.minutes.tolist()
y = exercise_data.calories.tolist() 
print(x,'\n',y)
| [77, 21, 22, 20, 36...           |
|----------------------------------|
| [79.7, 23.1, 25.6, 17.8, 41.8... |

Survey data

workout_minutes calories_burned
77 79.775152
21 23.177279
22 25.609262
20 17.857388
36 41.849864
Analyzing Survey Data in Python

Add constant term

x = sm.add_constant(x)
print (x)
  • Tells model to fit a value for b

Analyzing Survey Data in Python

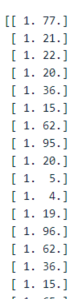
Perform regression and fit
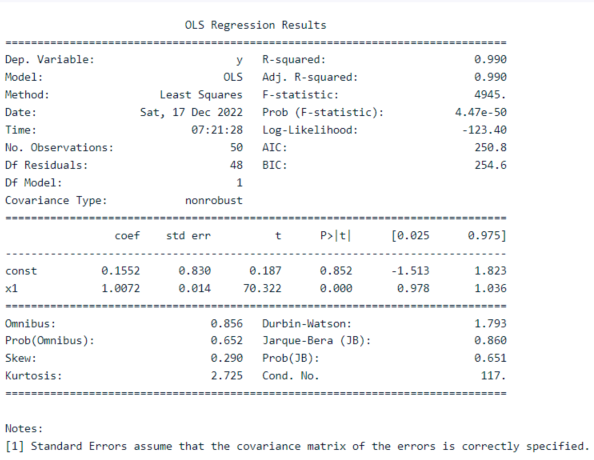
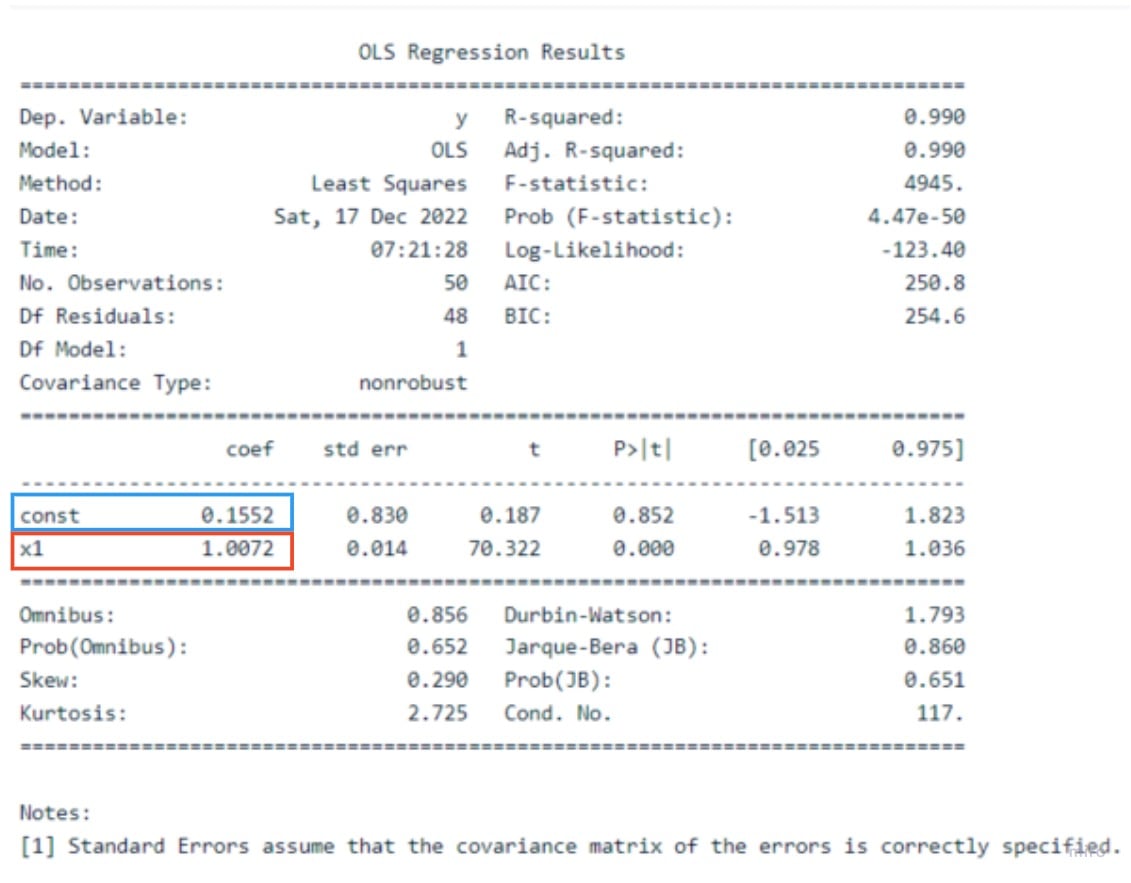
result = sm.OLS(y,x).fit()
print(result.summary())

Analyzing Survey Data in Python

Retrieving m and b

Analyzing Survey Data in Python

Plot original values

x = exercise_data.minutes.tolist()
y = exercise_data.calories.tolist()
plt.scatter(x,y)
plt.xlabel('minutes')
plt.ylabel('calories')
plt.show()

Analyzing Survey Data in Python

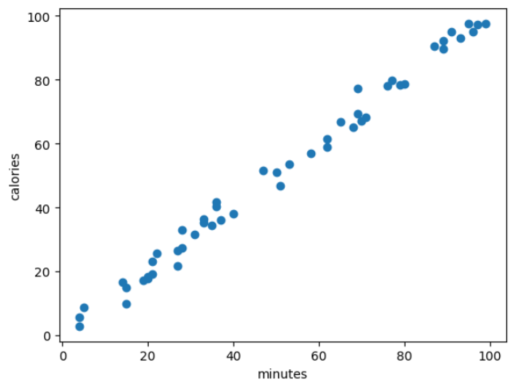
Plotting the regression line

max_x = exercise_data.minutes.max()
min_x = exercise_data.minutes.min()
x = np.arange(min_x, max_x, 1)

y = 1.0072*x + 0.1552
plt.plot(y, 'r') plt.show()

Analyzing Survey Data in Python

Predict response

y = 1.0072 * 30 + 0.1552
print(y)
30.3712
Analyzing Survey Data in Python

Linear regression pros and cons

  • Pro
    • Performs well when data is linearly separable
  • Con
    • Assumes linear relationship for non-linear cases

Analyzing Survey Data in Python

Let's practice!

Analyzing Survey Data in Python

Preparing Video For Download...