Correlations
Analyzing Survey Data in Python

EbunOluwa Andrew
Data Scientist
Correlations in survey analysis
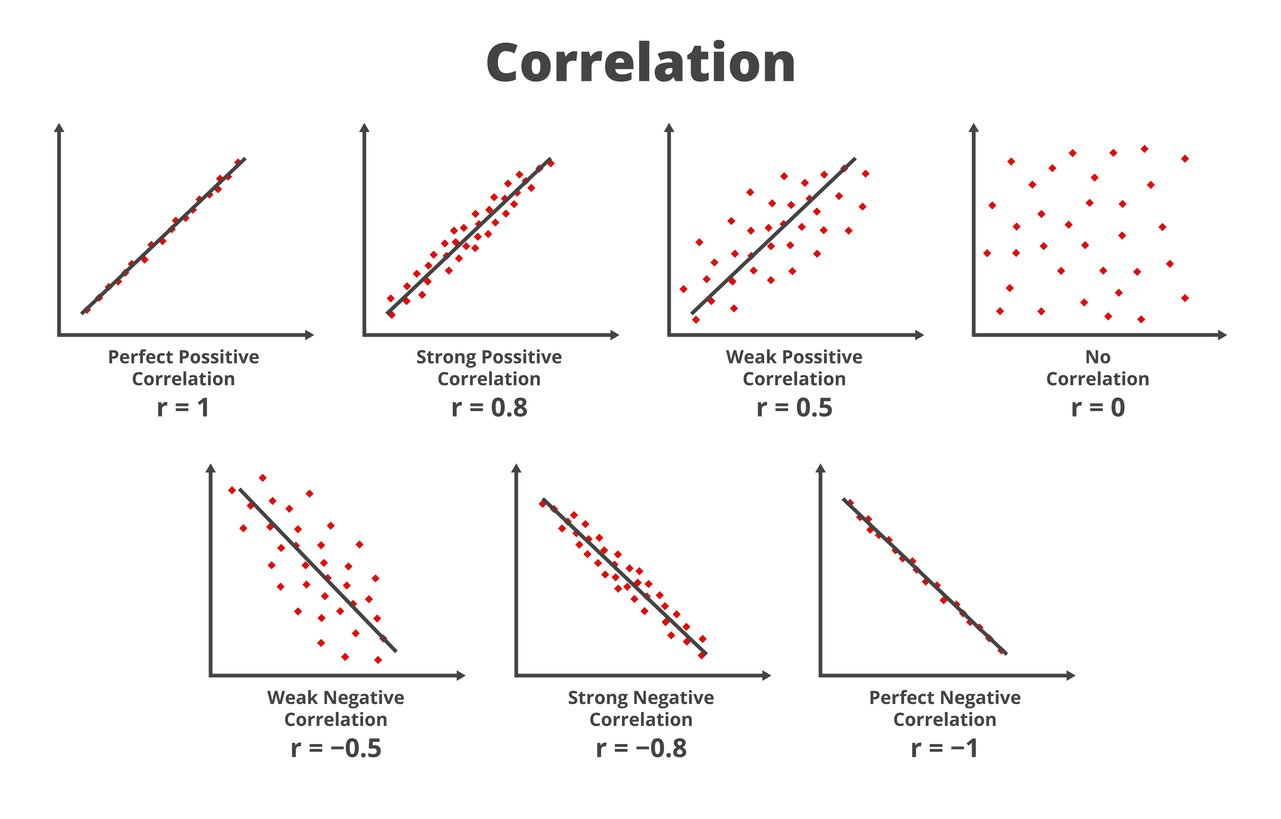
Correlation strength and direction
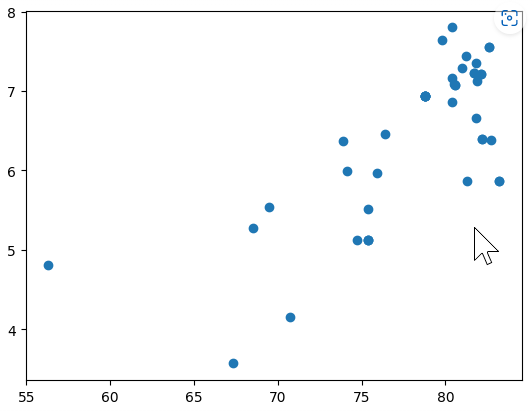
.corr() function
.corr() example: healthy_city
Analyzing Survey Data in Python
EbunOluwa Andrew
Data Scientist

