Introducing Survey Data Analysis
Analyzing Survey Data in Python

EbunOluwa Andrew
Data Scientist
What is survey data analysis?

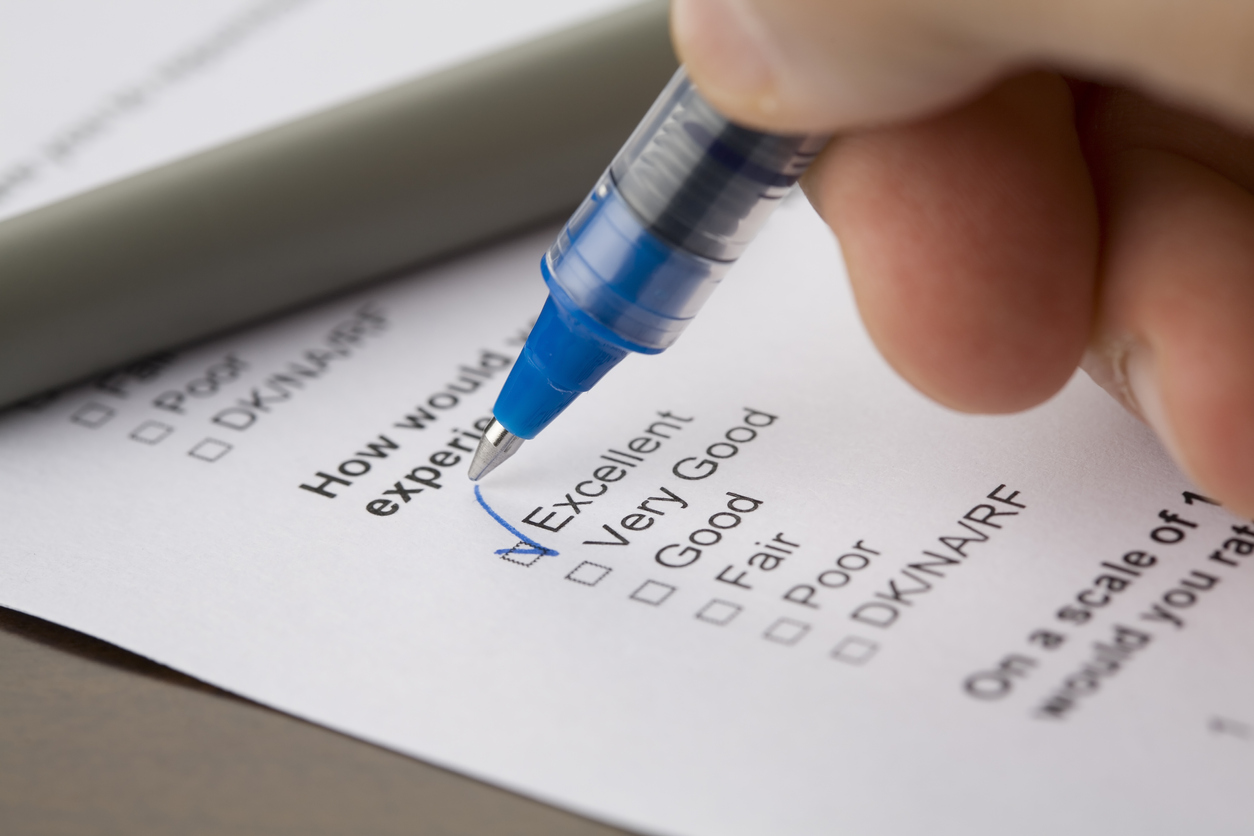
What is survey data?

1 Photo by Celpax on Unsplash
Types of survey data
Types of survey data
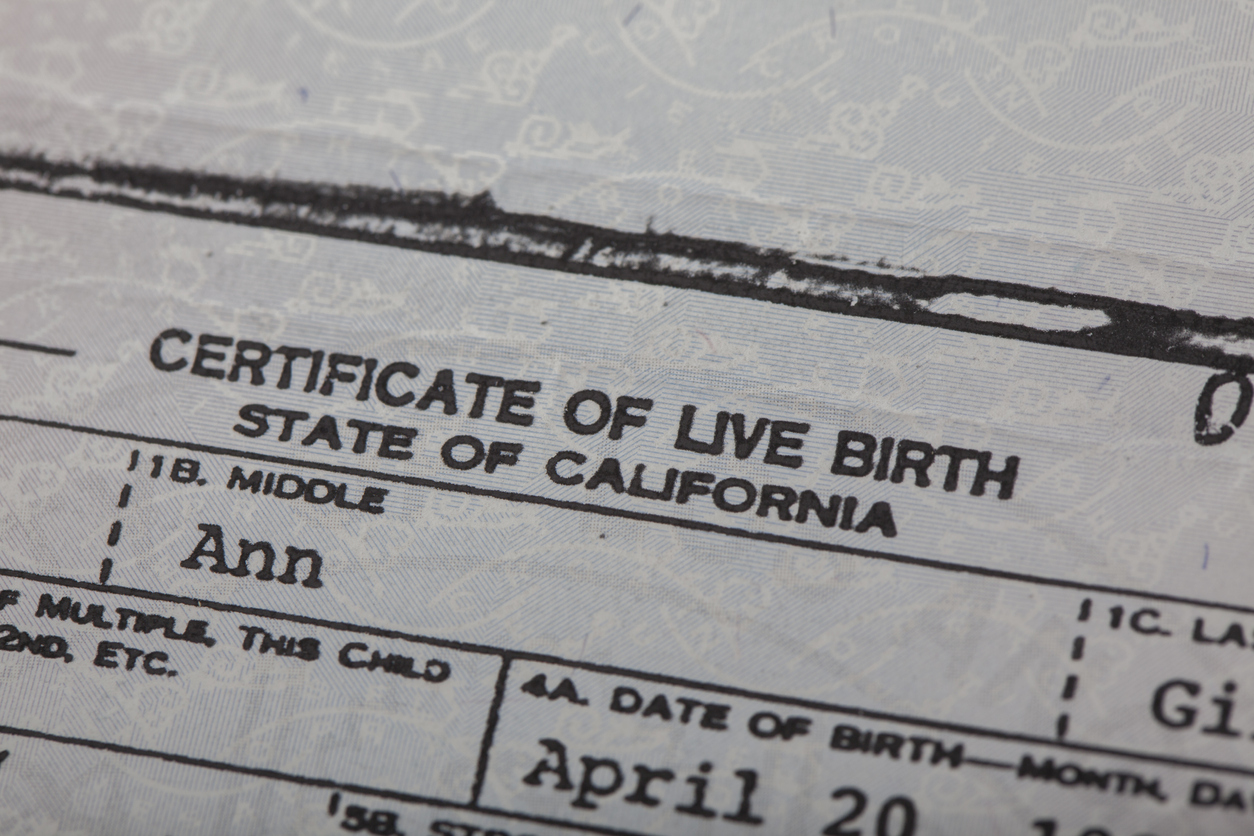
Types of survey data

Defining goals
Sampling for surveys

1 Photo by Joseph Chan on Unsplash
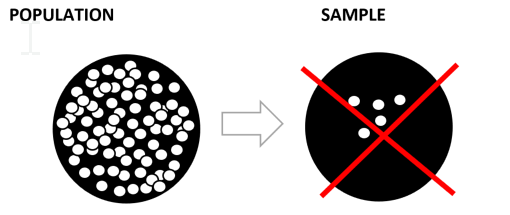
Sampling techniques overview
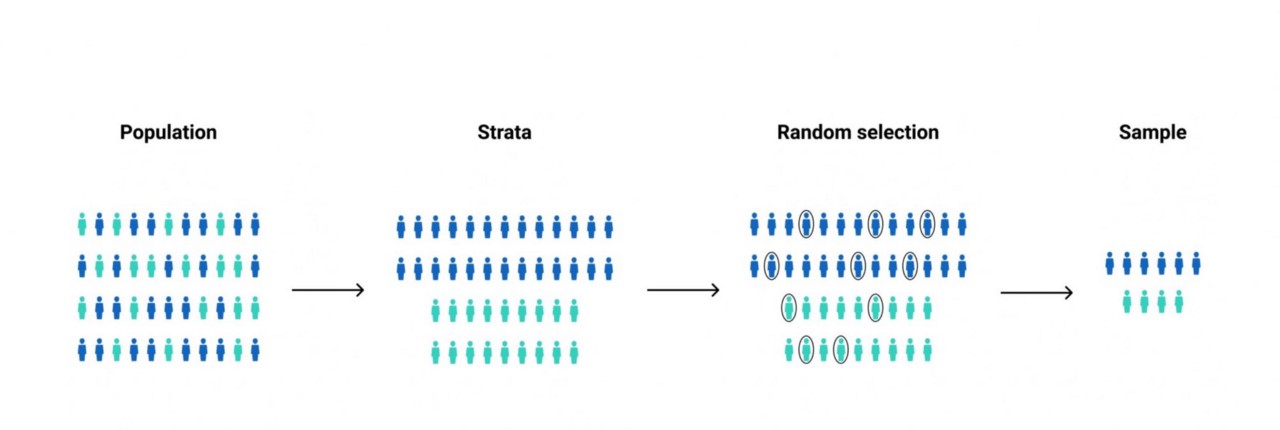
Sampling techniques overview
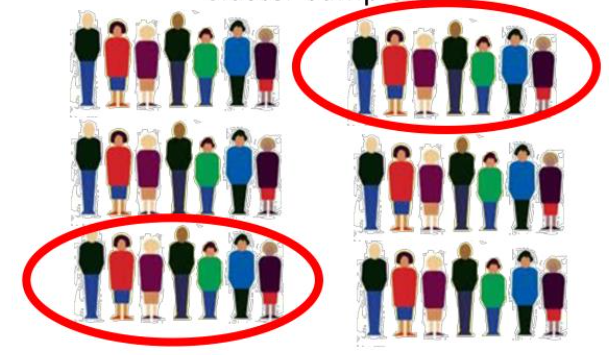
1 Aoife Dalton on SlideServe

