Statistical Modeling Techniques
Analyzing Survey Data in Python

EbunOluwa Andrew
Data Scientist
Why use statistical modeling techniques in survey analysis?
- Make predictions from relationships between variables
- Enable visualization tools
- Insights are unforgettable

1 Photo by Chris Liverani on Unsplash
When to use statistical modeling techniques
- Difficult data
- Influence between variables
- Predict outcome

1 Photo by Tyler Easton on Unsplash
Example statistical modeling techniques
- Linear regression
- Two sample t-test
- Chi-square test

Linear regression model
- Linear regression model
- Assumes linear relationship between x and y variable
- y = m*x + b
- y = dependent variable
- x = independent variable
- m = slope
- b = y-intercept

1 Photo from Seeing Theory-Brown.edu
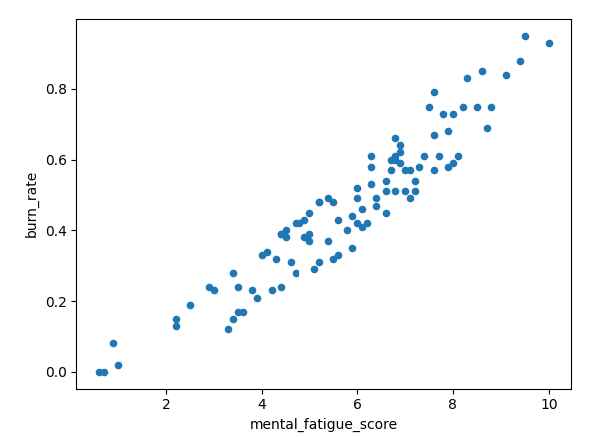
Linear regression in survey analysis
| employee | gender | company_type | wfh_available | mental_fatigue_score | burn_rate |
|---|---|---|---|---|---|
| fff200 | Male | Service | No | 3 | 0.24 |
| fff500 | Female | Service | Yes | 5.7 | 0.45 |
| fff700 | Female | Service | Yes | 5.8 | 0.49 |
| fff300 | Female | Service | Yes | 6.7 | 0.63 |
| fff100 | Female | Product | Yes | 4.7 | 0.38 |
| fff400 | Male | Service | Yes | 3.4 | 0.28 |
| fff600 | Female | Product | Yes | 5.4 | 0.5 |
| fffe3400 | Female | Product | No | 6.7 | 0.58 |
| fffe200 | Male | Service | Yes | 6.3 | 0.48 |
| fffe3000 | Male | Service | Yes | 5.4 | 0.41 |
Linear regression in survey analysis
data.plot.scatter(
x='mental_fatigue_score',
y='burn_rate')
plt.show()

Two-sample t-test
- Test statistically significant difference between two population means
- Null hypothesis = two population means are equal
- Alternate hypothesis = two population means are NOT equal

1 Photo by Olesia Bahrii on Unsplash
Two-sample t-test in survey analysis
| employee | gender | company_type | wfh_available | mental_fatigue_score | burn_rate |
|---|---|---|---|---|---|
| fff100 | Female | Product | Yes | 4.7 | 0.38 |
| fff400 | Male | Service | Yes | 3.4 | 0.28 |
| fff600 | Female | Product | Yes | 5.4 | 0.5 |
| company_type | burn_rate |
|---|---|
| Service | 0.57 |
| Service | 0.75 |
| Service | 0.51 |
| Service | 0.57 |
| company_type | burn_rate |
|---|---|
| Product | 0.51 |
| Product | 0.79 |
| Product | 0.66 |
| Product | 0.39 |
Chi-squared test
- Test statistical significance between two categorical variables
- Null hypothesis = no significant association between variables
- Alternate hypothesis = significant association between variables
Chi-square test in survey analysis
Variable #1
company_type- Product or Service
Variable #2
wfh_available- Yes or No
| company_type | wfh_available |
|---|---|
| Product | Yes |
| Product | Yes |
| Product | No |
| Service | Yes |
| Service | Yes |
| Product | Yes |
| Service | No |
| Service | No |
| Product | Yes |
| Service | Yes |
Which technique to use? - linear regression
Both variables = numerical

Which technique to use? - two-sample t-test
- Two sample t-test
- One variable = categorical
- One variable = numerical

1 Photo by Diana Polekhina on Unsplash
Which technique to use? - chi-square test
- Chi-square test
- Both variables = categorical

1 Photo by Element5 Digital on Unsplash
Let's practice!
Analyzing Survey Data in Python

