Statistical Modeling Techniques
Analyzing Survey Data in Python

EbunOluwa Andrew
Data Scientist
Why use statistical modeling techniques in survey analysis?
- Make predictions from relationships between variables
- Enable visualization tools
- Insights are unforgettable

1 Photo by Chris Liverani on Unsplash
When to use statistical modeling techniques
- Difficult data
- Influence between variables
- Predict outcome

1 Photo by Tyler Easton on Unsplash
Example statistical modeling techniques

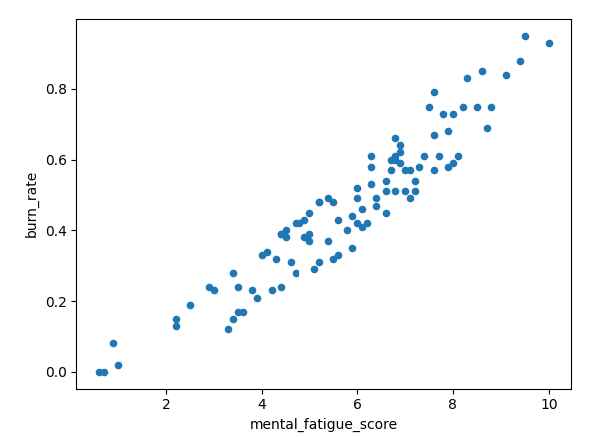
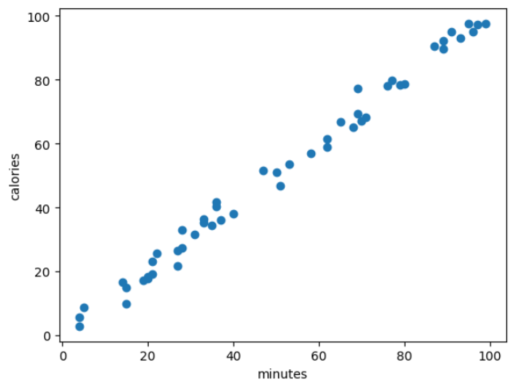
Linear regression model

1 Photo from Seeing Theory-Brown.edu
Linear regression in survey analysis
Two-sample t-test

1 Photo by Olesia Bahrii on Unsplash
Which technique to use? - linear regression
Which technique to use? - two-sample t-test

1 Photo by Diana Polekhina on Unsplash
Which technique to use? - chi-square test

1 Photo by Element5 Digital on Unsplash

