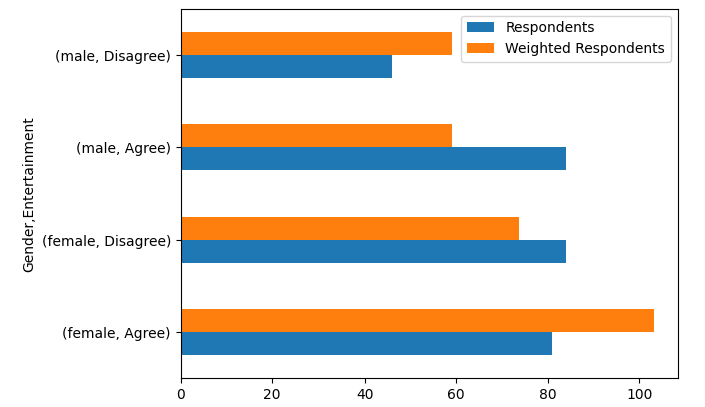
Weighted sampling
Analyzing Survey Data in Python

EbunOluwa Andrew
Data Scientist
What is weighted sampling?
- Unequal probabilities
- Allows researchers to correct issues during data collection

Weighted sampling common variables
- Demographic characteristics like gender, age, location, and education
- Account for differences between those who do or do not partake in research studies
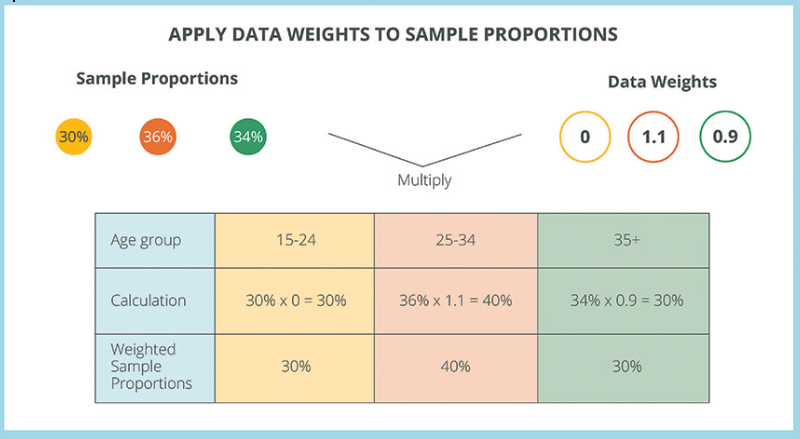
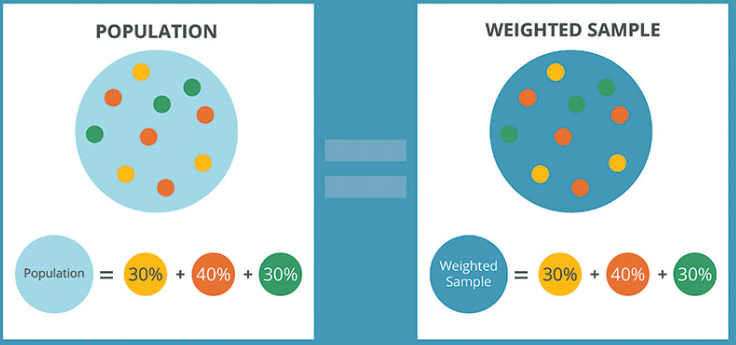
Cell-based weighting
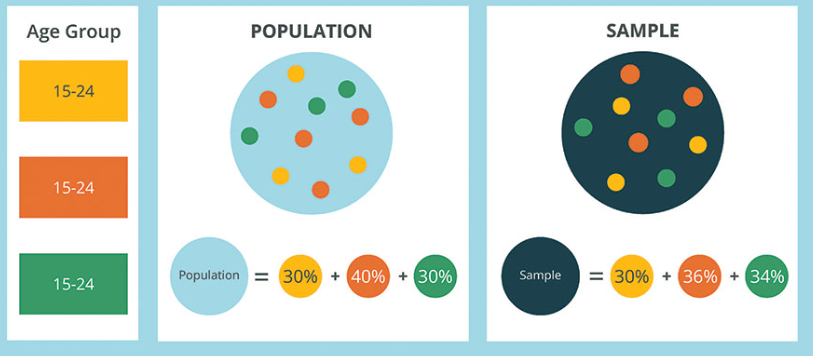
1 https://www.geopoll.com/blog/weighting-survey-data-raking-cell-weighting/
Cell based-weighting
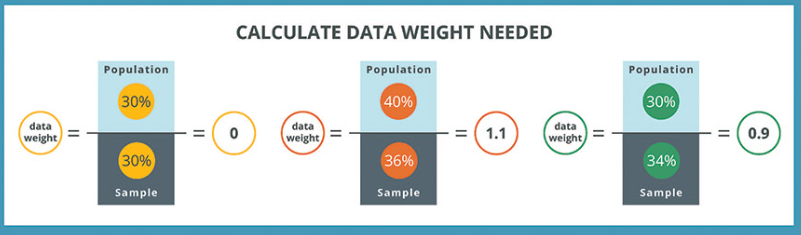
1 https://www.geopoll.com/blog/weighting-survey-data-raking-cell-weighting/
Cell based-weighting
1 https://www.geopoll.com/blog/weighting-survey-data-raking-cell-weighting/
Cell based-weighting
1 https://www.geopoll.com/blog/weighting-survey-data-raking-cell-weighting/
Analyzing youth spending patterns with Python
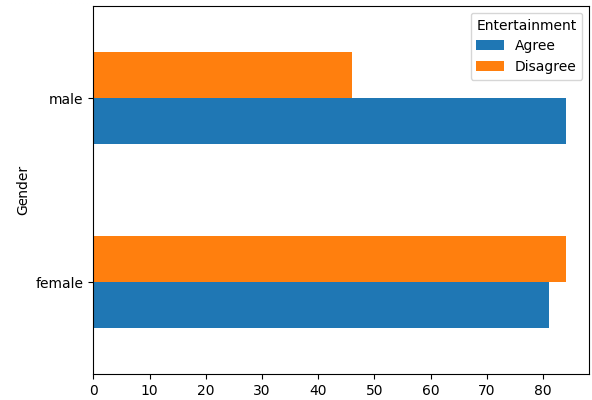
Analyzing youth spending patterns with Python